

Abstract
Genome-wide association studies with metabolomics (mGWAS) identify genetically influenced metabotypes (GIMs), their ensemble defining the heritable part of every human's metabolic individuality. Knowledge of genetic variation in metabolism has many applications of biomedical and pharmaceutical interests, including the functional understanding of genetic associations with clinical end points, design of strategies to correct dysregulations in metabolic disorders and the identification of genetic effect modifiers of metabolic disease biomarkers. Furthermore, it has been shown that GIMs provide testable hypotheses for functional genomics and metabolomics and for the identification of novel gene functions and metabolite identities. mGWAS with growing sample sizes and increasingly complex metabolic trait panels are being conducted, allowing for more comprehensive and systems-based downstream analyses. The generated large datasets of genetic associations can now be mined by the biomedical research community and provide valuable resources for hypothesis-driven studies. In this review, we provide a brief summary of the key aspects of mGWAS, followed by an update of recently published mGWAS. We then discuss new approaches of integrating and exploring mGWAS results and finish by presenting selected applications of GIMs in recent studies.
Introduction
Homeostasis of blood metabolites and excretion of metabolites through urine are crucial for maintaining human health. Therefore, dysregulations of metabolite levels often indicate critical physiological states, a fact that is widely used in clinical chemistry for the diagnosis of common metabolic diseases, such as diabetes and chronic kidney disease, but also of rare metabolic disorders, including inborn errors of metabolism, such as phenylketonuria and medium-chain acyl-CoA dehydrogenase deficiency. The number and variety of metabolites that are detectable and quantifiable in biological samples in a single experiment largely increased through the advent of modern metabolomics techniques, which are mainly based on nuclear magnetic resonance spectroscopy or mass spectrometry coupled to gas or liquid chromatography (1). As a consequence, blood and urine levels of a broad range of metabolites can be determined on an epidemiological scale from bio samples of thousands of individuals, opening new avenues to study human metabolism and its variation in health and disease based on large population studies (2).
Metabolite levels and their variation in the human body are influenced by various factors, specifically environmental conditions (day light, exposure to xenobiotics, etc.), lifestyle (nutrition habits, smoking and alcohol consumption, physical activity, etc.) and genetics. The genetic control of metabolite levels and its impact on human health are apparent in inborn errors of metabolism, where rare genetic variants disrupt a single gene that then leads to extreme, eventually toxic levels of related metabolites. Availability of population scale metabolomics and genotype data now allows to systematically investigate also the less apparent influences of more common and less deleterious genetic variants on human metabolism by conducting genome-wide association studies with metabolomics (mGWAS). This has been demonstrated in the first mGWAS by Gieger et al. (3), in which the authors performed a genome-wide scan for associations of common single-nucleotide polymorphisms (SNPs) with the levels of >350 metabolites and all pairwise ratios thereof. Despite the relatively small sample size of this first mGWAS (n = 284), they identified four common SNPs that significantly alter functionally related metabolic traits. Moreover, they found that ratios between metabolites can serve as proxies for the biochemical conversion of metabolites and thereby significantly strengthen the associations, a concept that has been helpful in many subsequent studies (4).
SNP-metabolite trait associations [metabolite quantitative trait loci (mQTLs)] identified in mGWAS typically cluster in groups of SNPs in high linkage disequilibrium (LD) that are associated with the same and/or biochemically related metabolites. Each of these groups of mQTLs defines a distinct genetically influenced metabotype (GIM). Many GIMs identified so far share most of the following properties (2): (i) The variance explained by the common genetic variants in the observed metabolic traits is often large, exceeding 10%, and the effect sizes are strong, with minor allele homozygotes sometimes displaying 50% differences in their estimated enzymatic throughput compared with major allele homozygotes. (ii) For the majority of GIMs, the metabolic traits can be functionally linked to an enzyme, a transporter or a regulator of metabolism that is encoded at the genetic locus (e.g. the associated metabolites being substrates or products of the encoded enzyme). (iii) Associations found in GWAS with clinical end points are enriched in GIMs, and the related metabotypes are candidate intermediate traits on the pathway to the disease [for details on the concept of the intermediate phenotype, see (5)]. For instance, Ried et al. (6) demonstrated the potential of mGWAS results to infer asthma-related metabolic markers by the identification of potentially deregulated phospholipids that associate with asthma and asthma risk alleles.
Recent GWAS with Metabolic Traits
Recent mGWAS have extended previous studies in samples size, variety of metabolic traits and depth of genetic analysis (Table 1). As a result, the number of known GIMs largely increased. At the same time, most previously reported associations could be replicated in various cohorts, often using different metabolomics platforms and sometimes also different biofluids. Moreover, the functional interpretation of GIMs remarkably improved as recent studies started to systematically combine GIMs with additional data, such as expression quantitative trait loci (eQTLs) and metabolic pathway information. Thus, mGWAS published in recent years did not only lead to a more comprehensive and refined view on the inherited part of human metabolic individuality, but it also facilitated establishing potential links of this individuality to disease.
Table 1.
List of published mGWAS in humans and selected GWAS with multiple metabolic traits (in the order of publication date)
| Biofluid | Metabolic trait(s) | Traits (N) | Platform | Study population | Cohort size (n) | Loci (n) | References |
|---|---|---|---|---|---|---|---|
| Serum | Targeted MS | 363 + all ratios | MS | German | 284 | 4 | Gieger et al. (3) |
| Plasma and Serum | Sphingolipids | 33 + 43 ratios | MS | European | 4400 | 5 | Hicks et al. (7) |
| Serum | Mainly phospholipids | 163 + 26 406 ratios | MS | German, British | 1809 + 422 | 9 | Illig et al. (8) |
| Urine | NMR-derived metabolites | 59 + 1661 ratios | NMR | German | 862 + 992 | 5 | Suhre et al. (9) |
| Serum | Non-targeted MS, knowns | 276 + 37 179 ratios | MS | German, British | 1768 + 1052 | 37 | Suhre et al. (10) |
| Urine and Plasma | Urine: NMR peaks, plasma: mainly phospholipids | Urine: 512 peaks plasma: 163 + ratios | NMR + MS | British | 211 | 3 | Nicholson et al. (11) |
| Serum | Mainly lipid traits | 117 + 99 ratios | NMR | Finnish | 8330 | 31 | Kettunen et al. (12) |
| Plasma | Phospholipids + sphingolipids | 153 | MS | European | 4034 | 35 | Demirkan et al. (13) |
| Serum | Mainly lipid traits | 117 + 99 ratios | NMR | Finnish | 8330 | 30 | Tukiainen et al. (14) |
| Serum | Mainly lipid traits and low-weight metabolites | 130 | NMR | Finnish, British | 1905 + 4703 | 34 | Inouye et al. (15) |
| Serum | Non-targeted MS, unknowns | 517 | MS | German | 1768 | 34 | Krumsiek et al. (16) |
| Urine | NMR peaks | 2425 | NMR | Brazil | 265 | 2 | Montoliu et al. (17) |
| Plasma | NMR peaks | 8600 + 124 750 ratios | NMR | German | 1757 | 7 | Raffler et al. (18) |
| Serum | MS peaks | 6138 | MS | Swedish | 402 + 489 | 7 | Hong et al. (19) |
| Plasma | Amino acids, amines, polar metabolites, lipids | 217 | MS | USA (European ancestry) | 2076 | 31 | Rhee et al. (20) |
| Urine | NMR peaks | 1276 | NMR | European, Brazil | 835 + 601 | 11 | Rueedi et al. (21) |
| Serum | Non-targeted MS, knowns and unknowns | 308 | MS | African American | 1260 | 19 | Yu et al. (22) |
| Serum | Non-targeted MS, knowns and unknowns | 486 + 98 346 ratios | MS | European | 7824 | 145 | Shin et al. (23) |
| Serum | Targeted MS (mainly phospholipids) + non-targeted MS (knowns) | 344 (151 + 193) | MS | European | 1809 + 843 | 12 new | Ried et al. (24) |
| Serum | NMR-derived metabolites | 42 | NMR | European | 2118 | 8 | Demirkan et al. (25) |
| Serum | Mainly phospholipids | 129 | MS | European | 7478 + 1182 | 31 | Draisma et al. (26) |
The largest leap in increasing the number of GIMs in the last 2 years has been achieved in the recent study by Shin et al. (23). The authors reported 145 GIMs (Fig. 1), 84 of which were new. This mGWAS was based on relative quantification from liquid chromatography-mass spectrometry and gas chromatography-mass spectrometry (GC-MS) for 486 metabolites in blood samples of 7824 participants from two European cohorts. The metabolites and their associated genetic loci broadly cover representatives of all major metabolic pathways, providing the most comprehensive picture of how genetic variation affects homeostasis in blood metabolism to date. To facilitate further exploration and functional interpretation of the findings by the biomedical research community, all GIMs have been embedded into the metabolic network, which was reconstructed from the metabolomics data (Fig. 2). This network as well as a rich set of additional information (including mapped eQTLs, GWAS hits to clinical phenotypes, and drug-target information) is available at http://gwas.eu/si.
Figure 1.
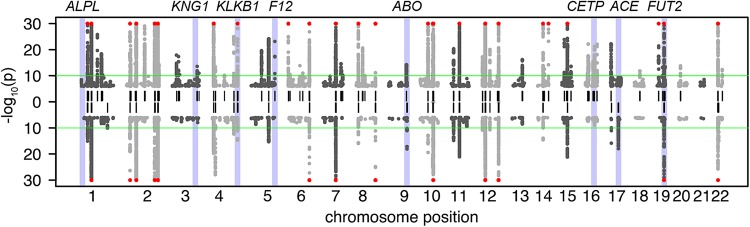
Manhattan plot of the mGWAS by Shin et al. (23). Upward pointing P-values: TwinsUK cohort, downward pointing P-values: KORA population study. Only SNPs with association to raw metabolites (P < 10−6) are displayed (no ratios). The green line indicates the genome-wide significance cutoff for the P-value (P < 10−10). Loci that reach genome-wide significance in either cohort are indicated by a short vertical black line. Loci with P-values <10−30 are indicated with a red symbol. Loci that are further discussed in Figure 3 are highlighted and annotated [figure adapted from the Supplementary Material, Fig. S2 by Shin et al., Nature Genetics, 2014 (23)].
Figure 2.

Network integrating gene–metabolite associations and metabolite–metabolite correlations. Individual metabolites are lumped by pathway (colored circles) and colored by their general metabolic properties (see legend). Genetic loci (gray diamonds) are annotated by the gene that is most likely affected by the variant. Green edges between loci and metabolites represent significant genetic associations with metabolic traits. Gray edges between metabolites represent significant partial correlations between metabolic traits. The highlighted sub-network (shaded box) is further discussed in Figure 3. The full network is freely accessible in digital format at http://gwas.eu/si [figure adapted from Figure 2 by Shin et al., Nature Genetics, 2014 (23)].
Recent mGWAS with similar or even larger sample sizes include the study by Draisma et al. (26), who analyzed 129 mostly lipid-related metabolites in 7478 individuals from seven European cohorts. They identified GIMs at 31 genomic loci, although only 4 of them were new. Nonetheless, the study refined patterns of associations of related lipid traits at already known loci and provided new insights into the complexity of lipid metabolism. Another example is the recent mGWAS by Rhee et al. (20), who identified specific patterns in the genetic associations of 46 triacylglycerols with different lengths of the fatty acid chain and degree of desaturation. Some of their loci have been previously linked to total triglyceride levels in blood, namely variants in glucokinase (hexokinase 4) Regulator (GCKR), FADS1-3 and APOA1/C3/A4/A5. While variants in GCKR showed stronger associations to triacylglycerols with shorter fatty acid chains, associations of variants in FADS1-3 were stronger with longer fatty acid chain lengths and a higher degree of desaturation, which is in line with the fatty acid desaturase function of the proteins encoded at the FADS1-3 locus.
While most early mGWAS were based on samples from individuals of European ancestry, Rueedi et al. (21) recently analyzed genetic associations of nuclear magnetic resonance (NMR)-derived metabolic traits in urine samples from 835 Europeans and replicated their findings in 601 samples from a Brazilian population with a diverse ethnic background. Another recent study by Yu et al. (22) performed an mGWAS in serum samples from almost 2000 individuals of African-American descent and thereby confirmed the robustness of various GIMs across different ethnicities, but also found novel independent variants at the same loci and even new GIMs, which have not been observed in Europeans before.
In addition to fully metabolome-wide mGWAS, many GWAS with smaller and more specialized sets of metabolic traits have been conducted. For instance, Stiles et al. (27) report genetic, anatomic and clinical determinants of human serum sterol and vitamin D levels; Ng et al. (28) analyzed genetic influences on blood levels of polychlorinated biphenyls and Xie et al. (29) conducted a GWAS focused on metabolites related to insulin sensitivity. The CHARGE Consortium (30) reported novel loci associated with plasma concentrations of four fatty acids in the de novo lipogenesis pathway. Further studies identified and refined associations with single metabolic traits, including disease-relevant markers, such as bilirubin (31–34), uric acid (35–38), dimethylarginine (39), homoarginine (40) and creatinine (41). These studies could identify new loci due to their much larger sample sizes, in some cases over 100 000 individuals, while using less expensive biochemistry-based methods.
Interestingly, most conclusions from mGWAS in humans also apply to animals and plants. Ghazalpour et al. (42) studied the genetic regulation of mouse liver metabolite levels. By analyzing 283 metabolites in 104 inbred and recombinant inbred mouse strains, they identified 240 loci, the majority of which accounted for 20–40% of total metabolite variation. Remarkably, more than one-third of the loci that regulate liver metabolites in mice also correspond to human GIMs, supporting the similarity in genetic regulation of metabolites between mice and humans. Chen et al. (43) conducted an mGWAS in rice, covering 840 metabolites and 6.4 million SNPs obtained from 529 diverse accessions of Oryza sativa. This study identified hundreds of common variants influencing numerous secondary metabolites with large effect sizes, and reported 36 candidate genes that modulate levels of metabolites of potential physiological and nutritional importance. The authors concluded that mGWAS provide a powerful tool for large-scale interactive gene–metabolite annotation and identification, pathway elucidation and knowledge about crop improvement.
New Concepts
Identification of non-targeted metabolic traits
Many of the more recent mGWAS were based on non-targeted metabolomics approaches, which record all metabolite signals detectable by the specific NMR or MS method, including signals that could not be assigned to a specific biochemical molecule (unknown metabolite). In contrast to targeted approaches that use optimized methods for the quantification of a set of predefined metabolites, non-targeted approaches usually provide less precise (relative) quantifications, but this for a biochemically broader range of metabolites. While less biological information can be gained from GIMs with signals of unknown identify, it has been shown that genetic association of data for unknown metabolites may allow metabolite identification in MS (16) and NMR (18,21). Often both known and unknown signals were considered in mGWAS to explore the entire breadth of the metabolite data from these non-targeted approaches. In 2013, Raffler et al. (18) reported an mGWAS with non-targeted NMR traits in blood plasma. While the concept of testing NMR signal intensities has already been introduced in previous mGWAS (11,17), this study was the first where the concept of testing ratios between NMR signals at different spectral positions was applied, resulting in the identification of four additional loci that displayed genome-wide significant association signals. To elucidate the chemical identity of the metabolites that underlay the genetically associated NMR signals, the authors used pseudo-spectra to visualize either the strength of genetic associations of NMR signals (‘association spectra’) or the correlation between NMR signals and traits determined on complementary metabolomics platforms, such as MS and clinical biochemistry measurements (‘correlation spectra’). In 2014, Rueedi et al. (21) presented an NMR-based mGWAS in urine where such pseudo-spectra were automatically annotated. There, the authors introduced the ‘metabomatching’ approach that compares association spectra with pure compound spectra derived from the Human Metabolome Database (HMDB) (44). Using this metabomatching approach, Rueedi et al. (21) could identify the metabolic nature of the signals in 6 out of 11 loci reported in their study. Hence, several methods are now available that allow to deduce the biochemical identity of non-targeted metabolic traits using genetic association data.
Exome sequencing and imputation
Identification of causative variants in GWAS is always a major challenge. Intermediate phenotypes with large effect sizes, as obtained from metabolomics, may be useful to figure out the causative variants of associations with complex clinical end points when the genetic structure of the association with the intermediate trait and the disease end point are the same. For the first time, exome-sequencing-based metabolomics associations were reported by Demirkan et al. (25). The authors first performed an NMR-based mGWAS in serum using microarray genotype data of 2118 individuals. Following the mGWAS, they selected a subset of the GWAS cohort (n = 921) and performed exome sequencing on candidate genes within eight candidate loci. They identified seven variants in or near four genes that modulate metabolite levels independently of the GWAS hits. For instance, the common SNP rs1047891 is a missense variant in CPS1 that was tagged by the genotyped SNP rs715. Interestingly, the association of rs1047891 to glycine was also previously reported by Shin et al. (23) using a fine-mapping approach of candidate loci based on 1000 Genomes Project data imputed genetic variants [see the Supplementary Material, Table S8 in Shin et al. (23)]. However, except for one variant, this fine-mapping approach did not significantly strengthen any association signal that was not already apparent using the genotyped SNPs. Fine mapping of association signals using imputed or exome-sequenced variants may thus help single out potentially causative SNPs; but for the moment, there is little evidence that it will help find truly novel association signals at the mGWAS level. This may change with larger sample numbers.
Non-additive genetic models
In most mGWAS, association models between genotype and metabotype assume additive effects, which is intuitively supported by the observation that many GIMs are related to rate limiting steps in enzymatic reactions or transport processes, which suggests a dose-dependent response to genetic variability. Tsepilov et al. (45) investigated systematically non-additive effects on a large panel of serum metabolites and all possible ratios (n = 22 801) in a population-based study (n = 1785). They found that most genetic effects on metabolite concentrations and ratios were indeed additive, with a few notable exceptions that may allow to understand the genetic control of these loci more deeply. However, with larger sample sizes, rare variants with potentially larger effect sizes and recessive modes of inheritance may be detected.
Epistasis and Mendelian randomization
Due to their large number and strong effect sizes, GIMs provide a test bed to identify and investigate more complex genetic and metabolic interactions. Shin et al. (23) provided an example of genetic interaction between two gene variants (epistasis), rs10469966 (NAT8) and rs4488133 (PYROXD2), and blood metabolite levels. The same study also reported an example of a Mendelian randomization analysis to establish causation, where expression of THEM4 was shown to mediate the association between rs6693388 and the ratio of linoleate (18:2n6) to 5,8-tetradecadien. However, it seems that as for now there were only few cases that display association signals that were strong enough to single out statistically significant cases of epistasis and Mendelian randomization.
Multi-phenotype mGWAS
Strategies that combine several phenotypes in an mGWAS may potentially detect additional genetic loci and further their functional characterization. Inouye et al. (15) showed that association testing of multiple correlated phenotypes offers better power than univariate analysis of single traits. Ried et al. (24) applied phenotype set enrichment analysis (PSEA), a method that tests sets of metabolites for association enrichment at genetic loci. In addition to confirming previously reported GIMs, the authors identified and validated 12 new loci.
Augmenting GIMs with functional information
A crucial step in the interpretation of mGWAS results is to put the identified associations into the context of results from other association studies, including associations of genetic variants to traits at different phenotype layers. Most recently published mGWAS studies, therefore, go beyond the mere reporting of genetic associations by combining their results with additional -omics datasets (i.e. eQTLs) (23,25), by linking individual associations in a systems level approach (16,46), and by adding clinical association data to establish complex gene-to-disease networks (for an example, see Fig. 3). However, collecting and integrating publicly available association data still present a major bottleneck in the evaluation of mGWAS results, in large part due to the fact that data from different sources are reported on different, but highly correlated SNP sets. To facilitate this task, Arnold et al. (48) recently established the SNiPA web service (http://www.snipa.org). SNiPA contains LD information as well as functional annotations for almost all genetic variants of the latest 1000 Genomes Project dataset. The functional annotations include regulatory elements, eQTLs, associations to clinical traits and also associations to metabolic traits as provided by the NHGRI-EBI GWAS catalog (http://www.ebi.ac.uk/gwas). SNiPA provides several user-friendly, interactive tools that are especially useful in the context of mGWAS, such as regional association plots and LD plots that are enriched with functional annotations. In particular, links to the Metabolomics GWAS server (http://www.gwas.eu) allow direct access to association data from the Suhre et al. (10) and Shin et al. (23) mGWAS, including many unpublished associations below the conservative level of genome-wide significance, that may prove to represent true positive associations when combined with additional evidence from user-provided studies (49).
Figure 3.

Example of the integration of mGWAS results in a biomedical context using data from different sources. This figure displays a ‘Cardiovascular disease and hypertension metabolic sub-network’, annotated based on correlations between molecular relationships and expert knowledge on blood pressure regulation, blood coagulation and known molecular risk factors for cardiovascular disease and hypertension. Metabolites (circles) and genes (diamonds) of the fibrinogen cleavage (left) and the kininogen/kinin system (right) and their interconnections were derived from the Shin et al. (see shaded box in Fig. 2) data. Gray nodes and edges display annotations of biochemical function based on expert knowledge (47). Colored nodes and edges correspond to reported associations based on genome-wide studies for blood pressure regulation (orange), blood coagulation (blue) and cholesterol levels (purple). This figure was first published as the Supplementary Material, Fig. S5 by Shin et al., Nature Genetics, 2014 (23).
Application of GIMS for Hypothesis Generation
mGWAS results are more and more used as starting hypothesis for deeper functional research. The great potential of mGWAS as hypothesis generating tool is demonstrated when mGWAS ‘rediscover’—sometimes decades-old—findings from biochemical experiments in the setting of modern genomic and metabolomic studies (50). One interesting example is SNP rs37369, which is a non-synonymous variant (Val140Ile) in the coding region of alanine-glyoxylate aminotransferase 2 (AGXT2). Several mGWAS linked this variant to changes in homeostasis of plasma beta-aminoisobutyrate (BAIB) (20), serum symmetric/asymmetric dimethylarginine (39) and serum homoarginine (40). Furthermore, SNP rs37369 was associated to elevated urinary excretion of BAIB (9,11,21) with BAIB concentrations >10 times higher in urine of homozygotes for the minor SNP allele. Since BAIB is one of AGXT2's substrates (51), it was hypothesized that rs37369 is causative for hyper-beta-aminoisobutyric aciduria (9,11), a heritable trait first described in the early 1950s (52,53). This mGWAS-generated hypothesis was recently validated by Kittel et al. (54) by in vitro studies where the authors demonstrated that the rs37369 polymorphism results in a significantly lower AGXT2 enzyme activity when compared with the wild type. These studies, inspired by a single mGWAS result, rejuvenated research interest in AGXT2, indicating that altered AGXT2 activity may contribute to the pathogenesis of cardiovascular, renal, neurological and hematological diseases, and highlighted the unique role of AGXT2 at the intersection of key mitochondrial pathways, and even as a potential drug target (50). Inspired by an observed co-association of BAIB and certain triglyceride levels at the AGXT2 locus in their mGWAS, Rhee et al. (20) further set out to investigate the relationship between BAIB metabolism and lipid homeostasis. Using a morpholino knockdown of agxt2 in zebrafish, the authors could indeed establish a functional link between BAIB, cholesterol ester and TAG metabolism, concluding that their data ‘provides an example how the breadth of gene, metabolite, and phenotype data […] can provide a springboard for research in metabolism’.
Another example where mGWAS data could have helped to formulate a hypothesis on a solute transporter's specificity has just been published by Nguyen et al. (55). Among the 12 novel loci reported by Ried et al. (24) was MFSD2A, a member of the major facilitator superfamily. The mouse homologue (Mfsd2a) was identified by Nguyen et al. (55) as a transporter for the essential omega-3 fatty acid docosahexaenoic acid. The authors showed that this previously orphan transporter transports lysolipids, writing: ‘Unexpectedly, cell-based studies indicate that Mfsd2a transports DHA in the form of lysophosphatidylcholine (LPC), but not unesterified fatty acid, in a sodium-dependent manner. Notably, Mfsd2a transports common plasma LPCs carrying long-chain fatty acids such LPC oleate and LPC palmitate, but not LPCs with less than a 14-carbon acyl chain’. This finding was reflected in Ried et al.'s study data, which associated this locus with acyl-bound LPCs with side chain lengths C16:0, C17:0, C18:1, C20:4 and C18:0. This finding was further replicated by Draisma et al. (26), who found an association of SNP rs7529794 with these same LPCs, the top association at a P-value of 2.8 × 10⁻¹³. Thus, had this information been available to the Nguyen et al., they might actually have expected that Mfsd2a transports LPCs and have designed their experiments accordingly.
Pharmaceutical companies are exploring innovative ways of drug development from candidate selection to clinical proof of concept (56). One compelling application of GWAS for the validation of therapeutic targets through human genetics has been suggested by Plenge et al. (57). The authors describe the concept of using dose–response curves based on multiple functional variants in genes of pharmaceutical interest in order to prioritize molecular targets in drug development. However, for such an approach to be applicable, the target gene is required to harbor a causal variant that is unequivocally associated with a medical trait of interest, the biological function of the causal gene and causal variant needs to be known, and the gene has to harbor multiple causal variants of known biological function, thereby enabling the generation of genotype–phenotype dose–response curves. These criteria are unfortunately rarely met by genetic associations with clinical end points, especially in the case of complex disorders. However, when a GIM is overlapping such a locus, then, due to its generally much stronger effect size and its more direct link to the genetic variant, this GIM can provide intermediate and functionally relevant readouts (5) that allow for the identification of multiple causal variants in order to satisfy the criteria lain out by Plenge et al. (57).
Conclusion and Outlook
With the era of GWAS with single clinical end points reaching maturation in meta-analyses that basically include all cohorts available worldwide for any given disease, what will the future bring for GWAS with metabolic traits? Meta-analyses of mGWAS are certainly the next big step. However, merging data from different metabolomics platforms may require additional efforts in developing statistical methods that allow to combine phenotype information that match only partially (e.g. some platforms can differentiate between isoleucine and leucine, others only report their sum; some platforms resolve lipid traits to a high degree of detail, while other methods provide access to aggregated traits; MS or NMR peaks may be machine specific and hard to match between studies). Larger cohorts shall be phenotyped by multiple platforms in samples from the same donors. Moreover, samples from multiple biofluids are being collected in current population studies, allowing to study metabolic correlations between them, including possible genotype-dependent interactions with the human gut or saliva microbiome. A number of GWAS with other disease-relevant -omics phenotypes have also been conducted, including genome-wide gene expression (58), proteomics (59) and protein glycosylation (60), and further epigenome-wide association studies between DNA methylation and metabolomics (61) and studies on transcriptome–metabolome associations (62). We thus expect to see an exciting new series of GWAS in deeply omics-phenotyped cohorts, where the combination of multiple disease-relevant quantitative traits may allow the identification of functionally relevant genotype–pathway associations. In order to leverage the full potential of the multi-omics GWAS, new computational approaches for systems biology and network-based association tests need to be developed. We hope that the resulting growing number of GIMs will lead to a significant increase in our functional understanding of genetic variation in human metabolism and its pathologies, knowing that every single newly discovered GIM holds to potential to reveal an exciting and potentially health-relevant story.
Conflict of Interest statement. None declared.
Funding
K.S. is supported by ‘Biomedical Research Program’ funds at Weill Cornell Medical College in Qatar, a program funded by the Qatar Foundation. The statements made herein are solely the responsibility of the author. C.G. is supported by a grant from the Helmholtz Association (Helmholtz-Russia Joint Research Group 310), the European Union's Seventh Framework Programme (FP7-Health-F5-2012) under Grant Agreement No. 305280 (MIMOmics) and BMBF e:Med project: e:AtheroSysMed—Systems medicine of myocardial infarction and stroke. Funding to pay the Open Access publication charges for this article was provided by Weill Cornell Medical College in Qatar.
References
- 1.Nicholson J.K., Lindon J.C. (2008) Systems biology: metabonomics. Nature, 455, 1054–1056. [DOI] [PubMed] [Google Scholar]
- 2.Suhre K., Gieger C. (2012) Genetic variation in metabolic phenotypes: study designs and applications. Nat. Rev. Genet., 13, 759–769. [DOI] [PubMed] [Google Scholar]
- 3.Gieger C., Geistlinger L., Altmaier E., Hrabe de Angelis M., Kronenberg F., Meitinger T., Mewes H.W., Wichmann H.E., Weinberger K.M., Adamski J. et al. (2008) Genetics meets metabolomics: a genome-wide association study of metabolite profiles in human serum. PLoS. Genet., 4, e1000282. [DOI] [PMC free article] [PubMed] [Google Scholar]
- 4.Petersen A.K., Krumsiek J., Wagele B., Theis F.J., Wichmann H.E., Gieger C., Suhre K. (2012) On the hypothesis-free testing of metabolite ratios in genome-wide and metabolome-wide association studies. BMC Bioinformatics, 13, 120. [DOI] [PMC free article] [PubMed] [Google Scholar]
- 5.Kronenberg F. (2012) Metabolic traits as intermediate phenotypes. In Suhre K. (ed), Genetics Meets Metabolomics. Springer, New York, pp. 255–264. [Google Scholar]
- 6.Ried J.S., Baurecht H., Stuckler F., Krumsiek J., Gieger C., Heinrich J., Kabesch M., Prehn C., Peters A., Rodriguez E. et al. (2013) Integrative genetic and metabolite profiling analysis suggests altered phosphatidylcholine metabolism in asthma. Allergy, 68, 629–636. [DOI] [PubMed] [Google Scholar]
- 7.Hicks A.A., Pramstaller P.P., Johansson A., Vitart V., Rudan I., Ugocsai P., Aulchenko Y., Franklin C.S., Liebisch G., Erdmann J. et al. (2009) Genetic determinants of circulating sphingolipid concentrations in European populations. PLoS Genet., 5, e1000672. [DOI] [PMC free article] [PubMed] [Google Scholar]
- 8.Illig T., Gieger C., Zhai G., Romisch-Margl W., Wang-Sattler R., Prehn C., Altmaier E., Kastenmuller G., Kato B.S., Mewes H.W. et al. (2010) A genome-wide perspective of genetic variation in human metabolism. Nat. Genet., 42, 137–141. [DOI] [PMC free article] [PubMed] [Google Scholar]
- 9.Suhre K., Wallaschofski H., Raffler J., Friedrich N., Haring R., Michael K., Wasner C., Krebs A., Kronenberg F., Chang D. et al. (2011) A genome-wide association study of metabolic traits in human urine. Nat. Genet., 43, 565–569. [DOI] [PubMed] [Google Scholar]
- 10.Suhre K., Shin S.Y., Petersen A.K., Mohney R.P., Meredith D., Wägele B., Altmaier E., Deloukas P., Erdmann J. et al. , CARDIoGRAM; (2011) Human metabolic individuality in biomedical and pharmaceutical research. Nature, 477, 54–60. [DOI] [PMC free article] [PubMed] [Google Scholar]
- 11.Nicholson G., Rantalainen M., Li J.V., Maher A.D., Malmodin D., Ahmadi K.R., Faber J.H., Barrett A., Min J.L., Rayner N.W. et al. (2011) A genome-wide metabolic QTL analysis in Europeans implicates two loci shaped by recent positive selection. PLoS Genet., 7, e1002270. [DOI] [PMC free article] [PubMed] [Google Scholar]
- 12.Kettunen J., Tukiainen T., Sarin A.P., Ortega-Alonso A., Tikkanen E., Lyytikainen L.P., Kangas A.J., Soininen P., Wurtz P., Silander K. et al. (2012) Genome-wide association study identifies multiple loci influencing human serum metabolite levels. Nat. Genet., 44, 269–276. [DOI] [PMC free article] [PubMed] [Google Scholar]
- 13.Demirkan A., van Duijn C.M., Ugocsai P., Isaacs A., Pramstaller P.P., Liebisch G., Wilson J.F., Johansson A., Rudan I., Aulchenko Y.S. et al. (2012) Genome-wide association study identifies novel loci associated with circulating phospho- and sphingolipid concentrations. PLoS Genet., 8, e1002490. [DOI] [PMC free article] [PubMed] [Google Scholar]
- 14.Tukiainen T., Kettunen J., Kangas A.J., Lyytikainen L.P., Soininen P., Sarin A.P., Tikkanen E., O'Reilly P.F., Savolainen M.J., Kaski K. et al. (2012) Detailed metabolic and genetic characterization reveals new associations for 30 known lipid loci. Hum. Mol. Genet., 21, 1444–1455. [DOI] [PubMed] [Google Scholar]
- 15.Inouye M., Ripatti S., Kettunen J., Lyytikainen L.P., Oksala N., Laurila P.P., Kangas A.J., Soininen P., Savolainen M.J., Viikari J. et al. (2012) Novel loci for metabolic networks and multi-tissue expression studies reveal genes for atherosclerosis. PLoS Genet., 8, e1002907. [DOI] [PMC free article] [PubMed] [Google Scholar]
- 16.Krumsiek J., Suhre K., Evans A.M., Mitchell M.W., Mohney R.P., Milburn M.V., Wagele B., Romisch-Margl W., Illig T., Adamski J. et al. (2012) Mining the unknown: a systems approach to metabolite identification combining genetic and metabolic information. PLoS Genet., 8, e1003005. [DOI] [PMC free article] [PubMed] [Google Scholar]
- 17.Montoliu I., Genick U., Ledda M., Collino S., Martin F.P., le Coutre J., Rezzi S. (2013) Current status on genome-metabolome-wide associations: an opportunity in nutrition research. Genes Nutr., 8, 19–27. [DOI] [PMC free article] [PubMed] [Google Scholar]
- 18.Raffler J., Romisch-Margl W., Petersen A.K., Pagel P., Blochl F., Hengstenberg C., Illig T., Meisinger C., Stark K., Wichmann H.E. et al. (2013) Identification and MS-assisted interpretation of genetically influenced NMR signals in human plasma. Genome. Med., 5, 13. [DOI] [PMC free article] [PubMed] [Google Scholar]
- 19.Hong M.G., Karlsson R., Magnusson P.K., Lewis M.R., Isaacs W., Zheng L.S., Xu J., Gronberg H., Ingelsson E., Pawitan Y. et al. (2013) A genome-wide assessment of variability in human serum metabolism. Hum. Mutat., 34, 515–524. [DOI] [PubMed] [Google Scholar]
- 20.Rhee E.P., Ho J.E., Chen M.H., Shen D., Cheng S., Larson M.G., Ghorbani A., Shi X., Helenius I.T., O'Donnell C.J. et al. (2013) A genome-wide association study of the human metabolome in a community-based cohort. Cell Metab., 18, 130–143. [DOI] [PMC free article] [PubMed] [Google Scholar]
- 21.Rueedi R., Ledda M., Nicholls A.W., Salek R.M., Marques-Vidal P., Morya E., Sameshima K., Montoliu I., Da Silva L., Collino S. et al. (2014) Genome-wide association study of metabolic traits reveals novel gene-metabolite-disease links. PLoS Genet., 10, e1004132. [DOI] [PMC free article] [PubMed] [Google Scholar]
- 22.Yu B., Zheng Y., Alexander D., Morrison A.C., Coresh J., Boerwinkle E. (2014) Genetic determinants influencing human serum metabolome among African Americans. PLoS Genet., 10, e1004212. [DOI] [PMC free article] [PubMed] [Google Scholar]
- 23.Shin S.-Y., Fauman E.B., Petersen A.-K., Krumsiek J., Santos R., Huang J., Arnold M., Erte I., Forgetta V., Yang T.-P. et al. (2014) An atlas of genetic influences on human blood metabolites. Nat. Genet., 46, 543–550. [DOI] [PMC free article] [PubMed] [Google Scholar]
- 24.Ried J.S., Shin S.Y., Krumsiek J., Illig T., Theis F.J., Spector T.D., Adamski J., Wichmann H.E., Strauch K., Soranzo N. et al. (2014) Novel genetic associations with serum level metabolites identified by phenotype set enrichment analyses. Hum. Mol. Genet., 23, 5847–5857. [DOI] [PMC free article] [PubMed] [Google Scholar]
- 25.Demirkan A., Henneman P., Verhoeven A., Dharuri H., Amin N., van Klinken J.B., Karssen L.C., de Vries B., Meissner A., Goraler S. et al. (2015) Insight in genome-wide association of metabolite quantitative traits by exome sequence analyses. PLoS Genet., 11, e1004835. [DOI] [PMC free article] [PubMed] [Google Scholar]
- 26.Draisma H.H., Pool R., Kobl M., Jansen R., Petersen A.K., Vaarhorst A.A., Yet I., Haller T., Demirkan A., Esko T. et al. (2015) Genome wide association study identifies novel genetic variants contributing to variation in blood metabolite levels. Nat. Commun., 6, 7208. [DOI] [PMC free article] [PubMed] [Google Scholar]
- 27.Stiles A.R., Kozlitina J., Thompson B.M., McDonald J.G., King K.S., Russell D.W. (2014) Genetic, anatomic, and clinical determinants of human serum sterol and vitamin D levels. Proc. Natl. Acad. Sci. USA, 111, E4006–E4014. [DOI] [PMC free article] [PubMed] [Google Scholar]
- 28.Ng E., Salihovic S., Monica Lind P., Mahajan A., Syvanen A.C., Axelsson T., Ingelsson E., Lindgren C.M., van Bavel B., Morris A.P. et al. (2015) Genome-wide association study of plasma levels of polychlorinated biphenyls disclose an association with the CYP2B6 gene in a population-based sample. Environ. Res., 140, 95–101. [DOI] [PMC free article] [PubMed] [Google Scholar]
- 29.Xie W., Wood A.R., Lyssenko V., Weedon M.N., Knowles J.W., Alkayyali S., Assimes T.L., Quertermous T., Abbasi F., Paananen J. et al. (2013) Genetic variants associated with glycine metabolism and their role in insulin sensitivity and type 2 diabetes. Diabetes, 62, 2141–2150. [DOI] [PMC free article] [PubMed] [Google Scholar]
- 30.Wu J.H., Lemaitre R.N., Manichaikul A., Guan W., Tanaka T., Foy M., Kabagambe E.K., Djousse L., Siscovick D., Fretts A.M. et al. (2013) Genome-wide association study identifies novel loci associated with concentrations of four plasma phospholipid fatty acids in the de novo lipogenesis pathway: results from the Cohorts for Heart and Aging Research in Genomic Epidemiology (CHARGE) consortium. Circ. Cardiovasc. Genet., 6, 171–183. [DOI] [PMC free article] [PubMed] [Google Scholar]
- 31.ilton J.N., Sebastiani P., Solovieff N., Hartley S.W., Bhatnagar P., Arking D.E., Dworkis D.A., Casella J.F., Barron-Casella E., Bean C.J. et al. (2012) A genome-wide association study of total bilirubin and cholelithiasis risk in sickle cell anemia. PLoS One, 7, e34741. [DOI] [PMC free article] [PubMed] [Google Scholar]
- 32.Chen G., Ramos E., Adeyemo A., Shriner D., Zhou J., Doumatey A.P., Huang H., Erdos M.R., Gerry N.P., Herbert A. et al. (2012) UGT1A1 is a major locus influencing bilirubin levels in African Americans. Eur. J. Hum. Genet., 20, 463–468. [DOI] [PMC free article] [PubMed] [Google Scholar]
- 33.Kang T.W., Kim H.J., Ju H., Kim J.H., Jeon Y.J., Lee H.C., Kim K.K., Kim J.W., Lee S., Kim J.Y. et al. (2010) Genome-wide association of serum bilirubin levels in Korean population. Hum. Mol. Genet., 19, 3672–3678. [DOI] [PMC free article] [PubMed] [Google Scholar]
- 34.Johnson A.D., Kavousi M., Smith A.V., Chen M.H., Dehghan A., Aspelund T., Lin J.P., van Duijn C.M., Harris T.B., Cupples L.A. et al. (2009) Genome-wide association meta-analysis for total serum bilirubin levels. Hum. Mol. Genet., 18, 2700–2710. [DOI] [PMC free article] [PubMed] [Google Scholar]
- 35.Kolz M., Johnson T., Sanna S., Teumer A., Vitart V., Perola M., Mangino M., Albrecht E., Wallace C., Farrall M. et al. (2009) Meta-analysis of 28,141 individuals identifies common variants within five new loci that influence uric acid concentrations. PLoS Genet., 5, e1000504. [DOI] [PMC free article] [PubMed] [Google Scholar]
- 36.Doring A., Gieger C., Mehta D., Gohlke H., Prokisch H., Coassin S., Fischer G., Henke K., Klopp N., Kronenberg F. et al. (2008) SLC2A9 influences uric acid concentrations with pronounced sex-specific effects. Nat. Genet., 40, 430–436. [DOI] [PubMed] [Google Scholar]
- 37.Dehghan A., Kottgen A., Yang Q., Hwang S.J., Kao W.L., Rivadeneira F., Boerwinkle E., Levy D., Hofman A., Astor B.C. et al. (2008) Association of three genetic loci with uric acid concentration and risk of gout: a genome-wide association study. Lancet, 372, 1953–1961. [DOI] [PMC free article] [PubMed] [Google Scholar]
- 38.Kottgen A., Albrecht E., Teumer A., Vitart V., Krumsiek J., Hundertmark C., Pistis G., Ruggiero D., O'Seaghdha C.M., Haller T. et al. (2013) Genome-wide association analyses identify 18 new loci associated with serum urate concentrations. Nat. Genet., 45, 145–154. [DOI] [PMC free article] [PubMed] [Google Scholar]
- 39.Seppala I., Kleber M.E., Lyytikainen L.P., Hernesniemi J.A., Makela K.M., Oksala N., Laaksonen R., Pilz S., Tomaschitz A., Silbernagel G. et al. (2014) Genome-wide association study on dimethylarginines reveals novel AGXT2 variants associated with heart rate variability but not with overall mortality. Eur. Heart J., 35, 524–531. [DOI] [PubMed] [Google Scholar]
- 40.Kleber M.E., Seppala I., Pilz S., Hoffmann M.M., Tomaschitz A., Oksala N., Raitoharju E., Lyytikainen L.P., Makela K.M., Laaksonen R. et al. (2013) Genome-wide association study identifies 3 genomic loci significantly associated with serum levels of homoarginine: the AtheroRemo Consortium. Circ. Cardiovasc. Genet., 6, 505–513. [DOI] [PubMed] [Google Scholar]
- 41.Chambers J.C., Zhang W., Lord G.M., van der Harst P., Lawlor D.A., Sehmi J.S., Gale D.P., Wass M.N., Ahmadi K.R., Bakker S.J. et al. (2010) Genetic loci influencing kidney function and chronic kidney disease. Nat. Genet., 42, 373–375. [DOI] [PMC free article] [PubMed] [Google Scholar]
- 42.Ghazalpour A., Bennett B.J., Shih D., Che N., Orozco L., Pan C., Hagopian R., He A., Kayne P., Yang W.P. et al. (2014) Genetic regulation of mouse liver metabolite levels. Mol. Syst. Biol., 10, 730. [DOI] [PMC free article] [PubMed] [Google Scholar]
- 43.Chen W., Gao Y., Xie W., Gong L., Lu K., Wang W., Li Y., Liu X., Zhang H., Dong H. et al. (2014) Genome-wide association analyses provide genetic and biochemical insights into natural variation in rice metabolism. Nat. Genet., 46, 714–721. [DOI] [PubMed] [Google Scholar]
- 44.Wishart D.S., Jewison T., Guo A.C., Wilson M., Knox C., Liu Y., Djoumbou Y., Mandal R., Aziat F., Dong E. et al. (2013) HMDB 3.0--The Human Metabolome Database in 2013. Nucleic Acids Res., 41, D801–D807. [DOI] [PMC free article] [PubMed] [Google Scholar]
- 45.Tsepilov Y.A., Shin S.Y., Soranzo N., Spector T.D., Prehn C., Adamski J., Kastenmuller G., Wang-Sattler R., Strauch K., Gieger C. et al. (2015) Non-additive effects of genes in human metabolomics. Genetics, 200, 707–718. [DOI] [PMC free article] [PubMed] [Google Scholar]
- 46.Krumsiek J., Suhre K., Illig T., Adamski J., Theis F.J. (2011) Gaussian graphical modeling reconstructs pathway reactions from high-throughput metabolomics data. BMC Syst. Biol., 5, 21. [DOI] [PMC free article] [PubMed] [Google Scholar]
- 47.Sainz I.M., Pixley R.A., Colman R.W. (2007) Fifty years of research on the plasma kallikrein-kinin system: from protein structure and function to cell biology and in-vivo pathophysiology. Thromb. Haemost., 98, 77–83. [PubMed] [Google Scholar]
- 48.Arnold M., Raffler J., Pfeufer A., Suhre K., Kastenmuller G. (2015) SNiPA: an interactive, genetic variant-centered annotation browser. Bioinformatics, 31, 1334–1336. [DOI] [PMC free article] [PubMed] [Google Scholar]
- 49.Ho Y.Y., Baechler E.C., Ortmann W., Behrens T.W., Graham R.R., Bhangale T.R., Pan W. (2014) Using gene expression to improve the power of genome-wide association analysis. Hum. Hered., 78, 94–103. [DOI] [PMC free article] [PubMed] [Google Scholar]
- 50.Rodionov R.N., Jarzebska N., Weiss N., Lentz S.R. (2014) AGXT2: a promiscuous aminotransferase. Trends Pharmacol. Sci., 35, 575–582. [DOI] [PMC free article] [PubMed] [Google Scholar]
- 51.Kontani Y., Kaneko M., Kikugawa M., Fujimoto S., Tamaki N. (1993) Identity of d-3-aminoisobutyrate-pyruvate aminotransferase with alanine-glyoxylate aminotransferase 2. Biochim. Biophys. Acta., 1156, 161–166. [DOI] [PubMed] [Google Scholar]
- 52.Harris H. (1953) Family studies on the urinary excretion of beta-aminoisobutyric acid. Ann. Eugen., 18, 43–49. [DOI] [PubMed] [Google Scholar]
- 53.Crumpler H.R., Dent C.E., Harris H., Westall R.G. (1951) beta-Aminoisobutyric acid (alpha-methyl-beta-alanine); a new amino-acid obtained from human urine. Nature, 167, 307–308. [DOI] [PubMed] [Google Scholar]
- 54.Kittel A., Muller F., Konig J., Mieth M., Sticht H., Zolk O., Kralj A., Heinrich M.R., Fromm M.F., Maas R. (2014) Alanine-glyoxylate aminotransferase 2 (AGXT2) polymorphisms have considerable impact on methylarginine and beta-aminoisobutyrate metabolism in healthy volunteers. PLoS One, 9, e88544. [DOI] [PMC free article] [PubMed] [Google Scholar]
- 55.Nguyen L.N., Ma D., Shui G., Wong P., Cazenave-Gassiot A., Zhang X., Wenk M.R., Goh E.L., Silver D.L. (2014) Mfsd2a is a transporter for the essential omega-3 fatty acid docosahexaenoic acid. Nature, 509, 503–506. [DOI] [PubMed] [Google Scholar]
- 56.Owens P.K., Raddad E., Miller J.W., Stille J.R., Olovich K.G., Smith N.V., Jones R.S., Scherer J.C. (2015) A decade of innovation in pharmaceutical R&D: the Chorus model. Nat. Rev. Drug Discov., 14, 17–28. [DOI] [PubMed] [Google Scholar]
- 57.Plenge R.M., Scolnick E.M., Altshuler D. (2013) Validating therapeutic targets through human genetics. Nat. Rev. Drug Discov., 12, 581–594. [DOI] [PubMed] [Google Scholar]
- 58.Westra H.J., Peters M.J., Esko T., Yaghootkar H., Schurmann C., Kettunen J., Christiansen M.W., Fairfax B.P., Schramm K., Powell J.E. et al. (2013) Systematic identification of trans eQTLs as putative drivers of known disease associations. Nat. Genet., 45, 1238–1243. [DOI] [PMC free article] [PubMed] [Google Scholar]
- 59.Melzer D., Perry J.R., Hernandez D., Corsi A.M., Stevens K., Rafferty I., Lauretani F., Murray A., Gibbs J.R., Paolisso G. et al. (2008) A genome-wide association study identifies protein quantitative trait loci (pQTLs). PLoS Genet., 4, e1000072. [DOI] [PMC free article] [PubMed] [Google Scholar]
- 60.Lauc G., Essafi A., Huffman J.E., Hayward C., Knezevic A., Kattla J.J., Polasek O., Gornik O., Vitart V., Abrahams J.L. et al. (2010) Genomics meets glycomics-the first GWAS study of human N-glycome identifies HNF1alpha as a master regulator of plasma protein fucosylation. PLoS Genet., 6, e1001256. [DOI] [PMC free article] [PubMed] [Google Scholar]
- 61.Petersen A.K., Zeilinger S., Kastenmuller G., Romisch-Margl W., Brugger M., Peters A., Meisinger C., Strauch K., Hengstenberg C., Pagel P. et al. (2014) Epigenetics meets metabolomics: an epigenome-wide association study with blood serum metabolic traits. Hum. Mol. Genet., 23, 534–545. [DOI] [PMC free article] [PubMed] [Google Scholar]
- 62.Bartel J., Krumsiek J., Schramm K., Adamski J., Gieger C., Herder C., Carstensen M., Peters A., Rathmann W., Roden M. et al. (2015) The human blood metabolome-transcriptome interface. PLoS Genet., 11, e1005274. [DOI] [PMC free article] [PubMed] [Google Scholar]