

Abstract
Genome-wide association (GWAS) and sequencing studies are providing new insights into the genetic basis of type 2 diabetes (T2D) and the inter-individual variation in glycemic traits, including levels of glucose, insulin, proinsulin and hemoglobin A1c (HbA1c). At the end of 2011, established loci (P < 5 × 10⁻⁸) totaled 55 for T2D and 32 for glycemic traits. Since then, most new loci have been detected by analyzing common [minor allele frequency (MAF)>0.05] variants in increasingly large sample sizes from populations around the world, and in trans-ancestry studies that successfully combine data from diverse populations. Most recently, advances in sequencing have led to the discovery of four loci for T2D or glycemic traits based on low-frequency (0.005 < MAF ≤ 0.05) variants, and additional low-frequency, potentially functional variants have been identified at GWAS loci. Established published loci now total ∼88 for T2D and 83 for one or more glycemic traits, and many additional loci likely remain to be discovered. Future studies will build on these successes by identifying additional loci and by determining the pathogenic effects of the underlying variants and genes.
Introduction
Type 2 diabetes (T2D) is a common disease with substantial and rapidly increasing global impact. While prevalence varies with age, sex and population, the global age-standardized adult diabetes prevalence is >9.2%, and an estimated >347 million adults have diabetes (1). Diabetes can be diagnosed based on the level of blood glucose after fasting or 2 h after an oral glucose challenge (2hGlu), or based on hemoglobin A1c (HbA1c), which provides a 3-month average of blood glucose (2). In many individuals with T2D, insulin resistance coexists with obesity, adverse lipid profiles, high blood pressure and a proinflammatory state, each likely influenced by genetic and environmental factors (3). Progression to T2D is characterized by abnormalities in pancreatic islet β-cell function in the presence of insulin resistance (4), although these biological processes are only partially defined. Strong evidence for a genetic component exists for T2D risk, insulin secretion and insulin action (5,6).
In the past decade, genome-wide association (GWAS) and sequencing studies have identified genetic loci that help explain the inherited basis of T2D and glycemic traits. These studies are providing insights into the genetic architecture of T2D, including the number, frequency and effect sizes of risk variants in populations around the world. The polygenic nature of T2D is now well established, and multiple risk variants are being identified at some loci, suggesting allelic heterogeneity. Concurrently, increasing numbers of genes and variants have been implicated in monogenic forms of diabetes, including maturity onset diabetes of the young (MODY) and neonatal diabetes (7), and at least five genes have been implicated in both monogenic and polygenic diabetes (8). A recent simulation study evaluated genetic architectures for consistency with results from T2D genetic studies and found that many different disease models were still possible with respect to the number of loci, allele frequencies and level of selective pressure (9). Ongoing studies should more substantially narrow the bounds on feasible architectures (9).
In this review, we describe recent genetic findings from association and sequencing studies for T2D and the related glycemic traits of glucose, HbA1c, insulin and proinsulin. We generally use P < 5 × 10⁻⁸ as a threshold to define significant results, noting in places where less stringent, study-wide thresholds are used. We count distinct loci by considering multiple signals within 500 kb to be part of the same locus and consider traits with and without adjustment for body mass index (BMI) to be the same trait. Finally, we refer to loci by the name of a nearby gene, recognizing that these genes are signposts of a locus and not necessarily the genes affected by the underlying variants.
Common Variants
The development of GWAS spurred considerable progress identifying common variants [minor allele frequency (MAF)>0.05] associated with T2D (Table 1) and glycemic traits (Table 2). After early candidate gene and linkage studies identified common variants associated with T2D in PPARG, KCNJ11-ABCC8 and TCF7L2, the first five GWAS for T2D detected six additional loci, and by early 2008, GWAS and meta-analyses had identified 15 loci for T2D and G6PC2 as a locus for fasting glucose (10). Also in 2008, reports of the first non-European-based GWAS for T2D established KCNQ1 as a T2D locus with variants common in East Asians (MAF = 0.33) but low frequency in Europeans (MAF ∼0.01) (11,12). KCNQ1 risk variants showed similar effect sizes in both populations, demonstrating the role of allele frequency in power to detect loci (13). In 2010, a meta-analysis of European-ancestry individuals identified a second signal of T2D-associated variants near KCNQ1 that are not in marked linkage disequilibrium (LD) with the initial variants (r2 < 0.05) and independent from them based on conditional analyses (14). By the end of 2011, further GWAS and meta-analyses in several populations had identified 55 loci for T2D (15,16). Also by 2011, GWAS had identified 32 total loci for one or more glycemic traits, including 17 for fasting glucose (15,17), 2 for fasting insulin (18), 5 for 2hGlu (19), 11 for HbA1c (20–22) and 9 for proinsulin, including 1 identified only in women (23). Incomplete overlap of loci between T2D and glycemic traits showed that not all effects on glucose levels in healthy individuals translate to the risk of T2D and vice versa. Based on the overlap between traits and the biological function of nearby genes, most identified T2D loci appeared to have a primary role in pancreatic islet β-cell function, with far fewer impacting insulin resistance.
Table 1.
Eighty-eight established loci for T2D (P < 5 × 10⁻⁸)
| Variant | Chr | Nearby gene | Variant | Chr | Nearby gene | Variant | Chr | Nearby gene |
|---|---|---|---|---|---|---|---|---|
| rs2296172 | 1 | MACF1 | rs9470794 | 6 | ZFAND3 | rs10842994 | 12 | KLHDC5 |
| rs17106184 | 1 | FAF1 | rs1535500 | 6 | KCNK16 | rs1531343 | 12 | HMGA2 |
| rs10923931 | 1 | NOTCH2 | rs2191349 | 7 | DGKB | rs7961581 | 12 | TSPAN8, LGR5 |
| rs340874 | 1 | PROX1 | rs864745 | 7 | JAZF1 | rs11065756 | 12 | CCDC63 |
| rs780094 | 2 | GCKR | rs4607517 | 7 | GCK | rs2074356 | 12 | C12orf51 |
| rs7578597 | 2 | THADA | rs6467136 | 7 | GCC1, PAX4 | rs7957197 | 12 | HNF1A |
| rs243021 | 2 | BCL11A | rs791595 | 7 | MIR129, LEP | rs1727313 | 12 | MPHOSPH9 |
| rs6723108 | 2 | TMEM163 | rs972283 | 7 | KLF14 | rs9552911 | 13 | SGCG |
| rs7560163 | 2 | RBM43, RND3 | rs515071 | 8 | ANK1 | rs61736969 | 13 | TBC1D4 |
| rs7593730 | 2 | RBMS1 | rs896854 | 8 | TP53INP1 | rs1359790 | 13 | SPRY2 |
| rs3923113 | 2 | GRB14 | rs13266634 | 8 | SLC30A8 | rs7403531 | 15 | RASGRP1 |
| rs2943641 | 2 | IRS1 | rs7041847 | 9 | GLIS3 | rs7172432 | 15 | C2CD4A/B |
| rs1801282 | 3 | PPARG | rs17584499 | 9 | PTPRD | rs7178572 | 15 | HMG20A |
| rs7612463 | 3 | UBE2E2 | rs10811661 | 9 | CDKN2A/2B | rs11634397 | 15 | ZFAND6 |
| rs831571 | 3 | PSMD6 | rs13292136 | 9 | TLE4 | rs2028299 | 15 | AP3S2 |
| rs4607103 | 3 | ADAMTS9 | rs2796441 | 9 | TLE1 | rs8042680 | 15 | PRC1 |
| rs11708067 | 3 | ADCY5 | rs11787792 | 9 | GPSM1 | rs9936385 | 16 | FTO |
| rs6769511 | 3 | IGF2BP2 | rs12779790 | 10 | CAMK1D | rs7202877 | 16 | BCAR1 |
| rs16861329 | 3 | ST6GAL1 | rs1802295 | 10 | VPS26A | rs391300 | 17 | SRR |
| rs6808574 | 3 | LPP | rs12571751 | 10 | ZMIZ1 | rs312457 | 17 | SLC16A11/A13 |
| rs6815464 | 4 | MAEA | rs1111875 | 10 | HHEX, IDE | rs11651052 | 17 | HNF1B |
| rs1801214 | 4 | WFS1 | rs7903146 | 10 | TCF7L2 | rs8090011 | 18 | LAMA1 |
| rs6813195 | 4 | TMEM154 | rs10886471 | 10 | GRK5 | rs12970134 | 18 | MC4R |
| rs702634 | 5 | ARL15 | rs2334499 | 11 | DUSP8 | rs12454712 | 18 | BCL2 |
| rs459193 | 5 | ANKRD55 | rs2237892 | 11 | KCNQ1 | rs10401969 | 19 | CILP2 |
| rs4457053 | 5 | ZBED3 | rs5215 | 11 | KCNJ11 | rs3786897 | 19 | PEPD |
| rs35658696 | 5 | PAM, PPIP5K2 | rs1552224 | 11 | CENTD2 | rs8108269 | 19 | GIPR |
| rs9502570 | 6 | SSR1, RREB1 | rs10830963 | 11 | MTNR1B | rs4812829 | 20 | HNF4A |
| rs10440833 | 6 | CDKAL1 | rs11063069 | 12 | CCND2 | rs5945326 | X | DUSP9 |
| rs3132524 | 6 | POU5F1, TCF19 |
One representative variant and one or two genes are shown for each locus. Loci are defined as association signals located within 500 kb of each other regardless of LD. The only locus identified first by a low-frequency variant (MAF < 0.05) is shown in bold font.
Chr, chromosome.
Table 2.
Eighty-three established loci for one or more glycemic traits (P < 5 × 10⁻⁸)
| Variant | Chr | Nearby gene | Traits | Variant | Chr | Nearby gene | Traits |
|---|---|---|---|---|---|---|---|
| rs6684514 | 1 | TMEM79 | H | rs7034200 | 9 | GLIS3 | G |
| rs2779116 | 1 | SPTA1 | H | rs10811661 | 9 | CDKN2A/2B | G |
| rs340874 | 1 | PROX1 | G | rs16913693 | 9 | IKBKAP | G |
| rs2820436 | 1 | LYPLAL1 | I | rs306549 | 9 | DDX31 | P |
| rs1371614 | 2 | DPYSL5 | G | rs651007 | 9 | ABO | G |
| rs780094 | 2 | GCKR | G, I | rs3829109 | 9 | DNLZ | G |
| rs895636 | 2 | SIX3, SIX2 | G | rs16926246 | 10 | HK1 | H |
| rs1530559 | 2 | YSK4 | I | rs10885122 | 10 | ADRA2A | G |
| rs10195252 | 2 | GRB14 | I | rs7903146 | 10 | TCF7L2 | G, I, P |
| rs560887 | 2 | G6PC2 | G, H | rs7077836 | 10 | TCERG1L | I |
| rs733331 | 2 | PDK1 | G | rs11605924 | 11 | CRY2 | G |
| rs2943645 | 2 | IRS1 | I | rs7944584 | 11 | MADD | G, P |
| rs17036328 | 3 | PPARG | I | rs1483121 | 11 | OR4S1 | G |
| rs11715915 | 3 | AMT | G | rs174550 | 11 | FADS1 | G |
| rs11708067 | 3 | ADCY5 | G | rs11603334 | 11 | ARAP1 | G, P |
| rs11920090 | 3 | SLC2A2 | G | rs10830963 | 11 | MTNR1B | G, H |
| rs7651090 | 3 | IGF2BP2 | G | rs2657879 | 12 | GLS2 | G |
| rs3822072 | 4 | FAM13A | I | rs150781447 | 12 | TBC1D30 | P |
| rs9884482 | 4 | TET2 | I | rs35767 | 12 | IGF1 | I |
| rs6822892 | 4 | PDGFC | I | rs12229654 | 12 | MYL2 | G |
| rs17046216 | 4 | SC4MOL | I | rs2074356 | 12 | C12orf51 | G |
| rs4865796 | 5 | ARL15 | I | rs11066453 | 12 | OAS1 | G |
| rs459193 | 5 | ANKRD55 | I | rs10747083 | 12 | P2RX2 | G |
| rs7708285 | 5 | ZBED3 | G | rs11619319 | 13 | PDX1 | G |
| rs6235 | 5 | PCSK1 | G, P | rs576674 | 13 | KL | G |
| rs1019503 | 5 | ERAP2 | G | rs61736969 | 13 | TBC1D4 | G, I |
| rs35658696 | 5 | PAM, PPIP5K2 | I | rs7998202 | 13 | ATP11A | H |
| rs17762454 | 6 | RREB1 | G | rs3783347 | 14 | WARS | G |
| rs9368222 | 6 | CDKAL1 | G, H | rs4502156 | 15 | C2CD4A/B | G, P |
| rs1800562 | 6 | HFE | H | rs1549318 | 15 | LARP6 | P |
| rs6912327 | 6 | UHRF1BP1 | I | rs2018860 | 15 | IGF1R | G |
| rs10305492 | 6 | GLP1R | G | rs1421085 | 16 | FTO | I |
| rs2745353 | 6 | RSPO3 | I | rs9933309 | 16 | CYBA | H |
| rs9399137 | 6 | HBS1L, MYB | H | rs4790333 | 17 | SGSM2 | P |
| rs2191349 | 7 | TMEM195 | G | rs1046896 | 17 | FN3K | H |
| rs4607517 | 7 | GCK | G, H | rs11667918 | 19 | MYO9B | H |
| rs6943153 | 7 | GRB10 | G | rs731839 | 19 | PEPD | I |
| rs1167800 | 7 | HIP1 | I | rs10423928 | 19 | GIPR | G |
| rs983309 | 8 | PPP1R3B | G, I | rs6113722 | 20 | FOXA2 | G |
| rs4737009 | 8 | ANK1 | H | rs6072275 | 20 | TOP1 | G |
| rs11558471 | 8 | SLC30A8 | G, P | rs855791 | 22 | TMPRSS6 | H |
| rs3824420 | 9 | KANK1 | G, P |
One representative variant, one or two genes and one-letter abbreviations for the glycemic traits analyzed in the discovery association studies are shown for each locus. Not all traits are shown. Loci are defined as association signals located within 500 kb of each other regardless of LD. Loci identified first by a low-frequency variant (approximate MAF <0.05) are shown in bold font.
Chr, chromosome; G, glucose (fasting, 1hGlu, 2hGlu or these traits adjusted for BMI); I, insulin (fasting or fasting and adjusted for BMI) or insulinogenic index; H, hemoglobin A1c; P, proinsulin (fasting and adjusted for BMI and insulin).
Building on this success, an additional round of GWAS meta-analysis made use of the Metabochip, a custom genotyping array designed to examine ∼1000–5000 variants nominally associated with each of 23 cardiometabolic traits/diseases and to fine-map 257 established disease- and trait-associated loci (24). This cost-effective array allowed investigators to genotype many additional samples, increasing the power of meta-analyses. The DIAbetes Genetics Replication and Meta-analysis (DIAGRAM) Consortium meta-analyzed Metabochip data from 22 669 T2D cases and 58 119 controls with earlier GWAS data from 12 171 T2D cases and 56 862 controls and identified 10 additional loci (25). These loci showed further evidence of overlap with other metabolic traits including obesity (e.g. MC4R) and lipid levels (e.g. CILP2). CILP2 was also identified in a contemporaneous gene-based study (26). Network analysis of genes located near new and established T2D signals were enriched for transcription factors, especially those that interact with transcriptional co-activator CREBBP, involved in chromatin remodeling (25). Analysis of directional consistency in allelic effects between stages of the meta-analysis supported a genetic architecture consisting of many common causal variants, most of very modest effect.
The Meta-Analyses of Glucose and Insulin-Related Traits Consortium (MAGIC) also incorporated Metabochip data to identify new loci (27). A meta-analysis of as many as 133 010 non-diabetic individuals identified 41 new loci for glycemic traits: 20 for fasting glucose, 17 for fasting insulin and 4 for 2hGlu. Analyses with and without adjustment for BMI allowed additional loci to be detected, especially for fasting insulin. Of 53 total glycemic loci, 34 showed at least nominal association (false discovery rate q < 0.05) with other metabolic traits, including insulin loci for T2D, lipid traits and waist–hip ratio, consistent with insulin resistance and potentially implicating pleiotropic effects. Of 36 fasting glucose loci, 22 showed at least nominal association with T2D (q < 0.05), but many other glucose loci had no apparent effect on T2D.
Genetic studies performed since 2012 have identified many additional T2D loci based on risk alleles common in one population but less common in others. Studies in African Americans identified RND3-RBM43 (28), HLA-B and INS-IGF2 (29). Studies in South Asians identified TMEM163 (30) and SGCG (31). One locus, SLC16A11-SLC16A13, was simultaneously identified in Japanese and Mexican Americans (32,33), and studies in East Asians identified ANK1 (34), GRK5 and RASGRP1 (35), LEP and GPSM1 (32), and CCDC63 and C12orf51 (36). A study of individuals from Greenland identified TBC1D4 (37), and a sequencing-based study of Danes with follow-up in other Europeans identified MACF1 (38). Finally, the largest GWAS to date in American Indians identified DNER at near genome-wide significance (P = 6.6 × 10⁻⁸) (39). Three of these studies imputed GWAS data using the 1000 Genomes Project sequence-based reference panels, providing better genome coverage (29,32,33,40). Taken together, these studies highlight the value of diverse populations, including founder and historically isolated populations, to detect risk loci.
Novel glycemic trait loci have also been identified since 2012 in selected populations or by analyzing additional glycemic traits. Studies in African Americans identified SC4MOL and TCERG1L for fasting insulin (41), and the TBC1D4 locus identified in Greenland was also strongly associated with 2hGlu and 2hIns (37). Studies in East Asians identified C12orf51, KANK1, IGF1R and PDK1-RAPGEF4 for fasting glucose; MYL2, C12orf51 and OAS1 for 1-2hGlu and HBS1L-MYB, CYBA and MYO9B for HbA1c (42–44). Additional loci were identified for measures of islet β-cell function derived from glycemic traits: insulinogenic index (HNF1A) and disposition index (ABO) (45). ABO encodes a well-known blood group, was previously implicated in blood cell and lipid traits and was subsequently reported as a locus for fasting insulin (46).
MAGIC also used association evidence from fasting traits and dynamic tests of insulin secretion after glucose challenge to characterize T2D loci (47). Clusters of loci appear to have primary effects on insulin sensitivity (PPARG, KLF14, IRS1, GCKR), reduced insulin secretion and fasting hyperglycemia (MTNR1B, GCK), insulin processing (ARAP1), and insulin processing and secretion without a detectable change in fasting glucose levels (TCF7L2, SLC30A8, HHEX-IDE, CDKAL1, CDKN2A); another 20 loci evaluated did not clearly fit any of these clusters (47). Future studies are needed to better understand pathogenetic effects on physiology.
Meta-analyses across populations provide further opportunities to detect loci with shared risk alleles. Meta-analysis of 17 418 T2D cases and 70 298 controls from European, African-American, Hispanic-Latino, and Asian studies using a gene-based CardioChip array was first to identify the BCL2 locus for T2D (26). A recent genome-wide trans-ancestry meta-analysis of 26 488 T2D cases and 83 964 controls from European, East Asian, South Asian and Mexican ancestry, with follow-up in an additional 21 491 T2D cases and 55 647 controls of European ancestry, identified seven new T2D loci (48). The trans-ancestry part of this latter study was performed using variants imputed based on genotype data from the International HapMap Project (49), and follow-up was limited to variants available in Metabochip-typed datasets, suggesting that future trans-ancestry meta-analyses incorporating data imputed to denser reference panels will identify additional loci.
Another strategy that identified loci for T2D and glycemic traits considered the relationship between these traits and BMI. Analysis of T2D in lean (BMI < 25 kg/m2) compared with obese (BMI ≥ 30 kg/m2) individuals identified LAMA1 as a T2D locus with larger effect in lean (odds ratio 1.13, 95% confidence interval 1.09–1.18) than obese (odds ratio 1.03, 95% confidence interval 1.00–1.06) cases (50). Another study of fasting glucose and insulin applied a joint meta-analysis approach to simultaneously test both a main genetic effect, adjusted for BMI, and potential interaction between each genetic variant and BMI (51). Many of the significant associations in that study also were detected in the concurrent MAGIC Metabochip study; additional loci detected included a fasting glucose locus at DPYSL5 and a locus >1 Mb from MADD, yet still in moderate (r2 ∼0.2) LD with a MADD signal. A full understanding of the genetic architecture of T2D and glycemic traits will involve teasing apart genetic contributions that depend on correlated traits.
Low-Frequency and Rare Variants
Technological advances and lower costs of high-throughput sequencing have driven new discoveries of low-frequency (0.005 < MAF ≤ 0.05) and rare (MAF ≤ 0.005) variants associated with T2D or related glycemic traits. Novel signals include both new loci and new low-frequency variants at established loci. Approaches to discover these variants include exome or genome sequencing, genotyping arrays and imputation reference panels that include variants identified by sequencing, and gene-based tests that aggregate variants. The threshold of significance used in current studies varies; while the large number of rare variants suggests the need for thresholds more stringent than P < 5 × 10⁻⁸, some studies use study-wide significance based on the number of variants analyzed or the number of genes analyzed in gene-based tests.
Four new loci for T2D or glycemic traits were recently identified using low-frequency or rare variants (45,46,52,53) (Tables 1 and 2). The first exome array-based study to identify novel loci reported low-frequency missense variants (MAF = 0.020–0.029) associated with proinsulin levels at TBC1D30 (Arg279Cys, P = 5.5 × 10⁻¹¹) and KANK1 (Arg667His, P = 1.3 × 10⁻⁸) (Fig. 1), and borderline low-frequency missense variants (MAF = 0.053) in the PAM (Asp563Gly, P = 1.9 × 10⁻⁸) and PPIP5K2 (Ser1228Gly, P = 2.3 × 10⁻⁸) genes, located ∼100 kb apart, associated with insulinogenic index (45). A whole-genome sequencing and imputation study showed that the missense variants in PAM and PPIP5K2 were also associated with T2D (P = 3.9 × 10⁻¹⁰) (52). That study reported an additional rare (MAF = 0.006) missense variant in PAM with independent evidence of T2D association (Ser539Trp, P = 1.7 × 10⁻⁵), implicating PAM as the more likely T2D gene at this locus. Most recently, an exome array-based study identified missense variant GLP1R Ala316Thr (MAF = 0.014) associated with fasting glucose levels (P = 3.4 × 10⁻¹²) (46). A concurrent exome array study using partly overlapping samples supports this association (P = 4.6 × 10⁻⁷) (53). The latter study also identified a novel fasting insulin locus at study-wide significance (URB2 Glu594Val, MAF = 0.001, P = 3.1 × 10⁻⁷) (53). These association signals represent the first of potentially many novel loci that will be identified based on low-frequency variants.
Figure 1.
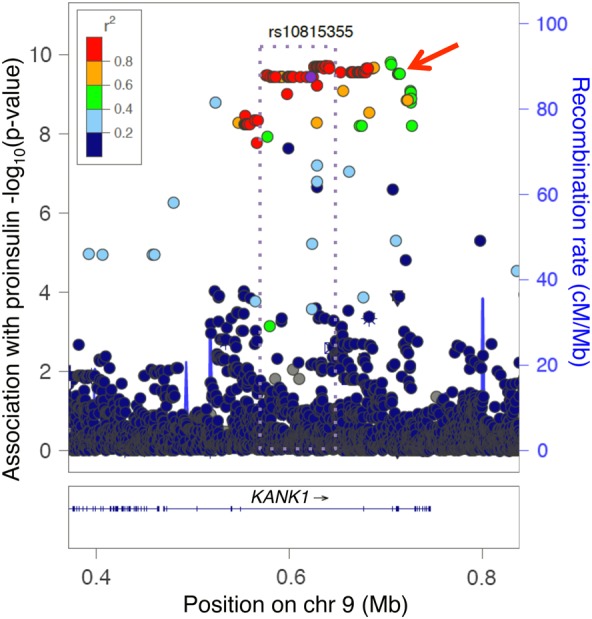
A low-frequency Finnish missense variant and a common non-coding East Asian variant may tag the same signal at KANK1. The KANK1 locus was originally identified in an exome array study in Finns by a low-frequency missense variant associated with fasting proinsulin (rs3824420, red arrow) (45). Many additional non-coding variants analyzed subsequently, shown here, are also associated with proinsulin in Finns (LD coloring, 1000 Genomes EUR). Also at KANK1, an East Asian GWAS meta-analysis detected a common variant (rs10815355) associated with fasting glucose (43). The East Asian signal (r2 > 0.8, purple dotted rectangle) does not include the missense variant (43).
Recent studies have also identified low-frequency variants associated with T2D at established GWAS loci but distinct from the common GWAS variants based on LD and conditional analysis. At CCND2, Steinthorsdottir described an intronic variant (rs76895963, MAF = 0.015) that reduces T2D risk (P = 5.0 × 10⁻²¹) and is correlated with increased CCND2 expression (54). Two studies identified low-frequency variants in MODY genes associated with T2D in the general population, frameshift variant PDX1 Gly218Alafs*12 associated with the increased risk of T2D at study-wide significance (MAF = 0.002, P = 7.3 × 10⁻⁷) (52) and HNF1A Glu508Lys associated with reduced T2D risk (MAF = 0.021, P = 2.4 × 10⁻⁹) (55).
Low-frequency variants distinct from GWAS loci have also been described for glycemic traits. An exome array study in Finns identified variants in SGSM2 (Val996Ile, MAF = 0.014) and MADD (Arg776X, MAF = 0.037) associated with proinsulin and distinct from the GWAS variants (45). At the MADD locus, another study identified a rare (MAF = 0.00068) variant associated with fasting glucose within NR1H3 intron 2 that shows evidence of a functional regulatory effect (56). Also, an exome array study of Europeans identified missense variant G6PC2 His177Tyr (MAF = 0.008) associated with fasting glucose (P = 3.1 × 10⁻⁸) (53). Evidence of allelic heterogeneity may help identify the underlying genes and facilitate biological studies.
A productive approach to analyzing exonic variants is to aggregate them into gene-based tests. Aggregating SLC30A8 variants identified by sequencing or genotyping ∼150 000 individuals, Flannick showed that carriers of 12 rare protein-truncating variants had a 3-fold reduced risk of T2D (P = 1.7 × 10⁻⁶) (54). Another study used gene-based tests of up to 15 variants as evidence that three coding variants in G6PC2 (Val219Leu, His177Tyr, Tyr207Ser) are associated with fasting glucose levels independent of each other and the non-coding GWAS signal. Wessel also reported a significant gene-based association at G6PC2 (P = 6.8 × 10⁻⁶) (46). Gene-based tests are most powerful when they combine only variants that have a functional effect, without neutral variants, as elegantly demonstrated by two studies that tested the function of multiple missense variants in MTNR1B or PPARG using cell-based assays (57,58). Compared with aggregating all known missense variants in those genes, aggregating only the variants that showed functional effects strengthened evidence of T2D association (57,58).
Other Aspects of Genetic Architecture
The genetic architecture of T2D and glycemic traits is also influenced by parent-of-origin effects and sex differences. An Icelandic study was first to report that variants located near KCNQ1, MOB2 and KLF14 showed stronger evidence of association when maternally inherited than when paternally inherited (59). The parent-of-origin effect at these three variants and others was subsequently confirmed in Pima Indians (60). A GWAS meta-analysis for proinsulin reported a locus at DDX31 more significant in women (P = 2.0 × 10⁻⁸) than men (P = 0.17)(23), and the DIAGRAM consortium reported the CCND2 signal was more significant in men (Pmen = 1.1 × 10⁻⁹, Pwomen P = 0.036; Phet = 0.013) and the GIPR signal was more significant in women (Pwomen = 2.2 × 10⁻⁷, Pmen = 0.0037; Phet = 0.057); the sex difference at CCND2 was not replicated in a study of individuals from Iceland, Denmark and Iran (52). Among low-frequency variants, loci with stronger evidence observed in one sex include a missense variant in PAM (rs35658696) associated with T2D (Pmen = 5.2 × 10⁻¹⁰, Pwomen = 0.0044; Phet = 0.033) (52); the association of this variant with insulinogenic index was observed in an all-male study (45). More extensive study of these and other influences may improve understanding of the mechanisms by which variants in or near these genes influence traits or confer susceptibility to disease.
Conclusion and Future Directions
Together, published loci identified at P < 5 × 10⁻⁸ total ∼88 for T2D and 83 for one or more of glucose, HbA1c, insulin and proinsulin. Counts are slightly more or less depending on whether variants hundreds of kilobases apart represent the same or different loci. Combining T2D and these glycemic traits, ∼137 loci have been identified. Of these, only four were identified based on low-frequency variants, and none based on rare variants alone. Loci were discovered in many different populations and typically share direction of effect across populations when they are observed.
New loci will continue to be observed as sample sizes increase and as more variants are analyzed. Imputation panels built using larger numbers of individuals, such as the >39 million variants in ∼65 000 haplotypes from the first release of the Haplotype Reference Consortium (www.haplotype-reference-consortium.org/ last accessed on 6 July 2015), will improve the genome coverage of meta-analyses and help identify signals with previously untested variants. New loci will be identified with lower-frequency variants based on large numbers of sequenced exomes from the T2D-GENES, PROMIS, CHARGE, UK10K and other consortia. Additional loci will be detected based on gene-based tests, especially as annotation for both coding and non-coding regions improves. Results of these studies will more narrowly define the feasible models of genetic architecture for T2D and glycemic traits. Ultimately, the greatest value from these studies will come with the discovery of the underlying genes and biological mechanisms responsible for disease.
Conflict of Interest statement: None declared.
Funding
This work was supported by the National Institutes of Health (DK072193, DK093757 and DK105561 to K.L.M., and DK062370, DK085584 and DK098032 to M.B.).
References
- 1.Danaei G., Finucane M.M., Lu Y., Singh G.M., Cowan M.J., Paciorek C.J., Lin J.K., Farzadfar F., Khang Y.H., Stevens G.A. et al. (2011) National, regional, and global trends in fasting plasma glucose and diabetes prevalence since 1980: systematic analysis of health examination surveys and epidemiological studies with 370 country-years and 2.7 million participants. Lancet, 378, 31–40. [DOI] [PubMed] [Google Scholar]
- 2.International Expert Committee. (2009) International Expert Committee report on the role of the A1C assay in the diagnosis of diabetes. Diabetes Care, 32, 1327–1334. [DOI] [PMC free article] [PubMed] [Google Scholar]
- 3.NCEP Expert Panel. (2002) Third Report of the National Cholesterol Education Program (NCEP) Expert Panel on Detection, Evaluation, and Treatment of High Blood Cholesterol in Adults (Adult Treatment Panel III) final report. Circulation, 106, 3143–3421. [PubMed] [Google Scholar]
- 4.Fonseca V.A. (2009) Defining and characterizing the progression of type 2 diabetes. Diabetes Care, 32 Suppl 2, S151–S156. [DOI] [PMC free article] [PubMed] [Google Scholar]
- 5.Poulsen P., Kyvik K.O., Vaag A., Beck-Nielsen H. (1999) Heritability of type II (non-insulin-dependent) diabetes mellitus and abnormal glucose tolerance—a population-based twin study. Diabetologia, 42, 139–145. [DOI] [PubMed] [Google Scholar]
- 6.Poulsen P., Levin K., Petersen I., Christensen K., Beck-Nielsen H., Vaag A. (2005) Heritability of insulin secretion, peripheral and hepatic insulin action, and intracellular glucose partitioning in young and old Danish twins. Diabetes, 54, 275–283. [DOI] [PubMed] [Google Scholar]
- 7.Schwitzgebel V.M. (2014) Many faces of monogenic diabetes. J. Diabetes Invest., 5, 121–133. [DOI] [PMC free article] [PubMed] [Google Scholar]
- 8.Vaxillaire M., Bonnefond A., Froguel P. (2012) The lessons of early-onset monogenic diabetes for the understanding of diabetes pathogenesis. Best Pract. Res. Clin. Endocrinol. Metab., 26, 171–187. [DOI] [PubMed] [Google Scholar]
- 9.Agarwala V., Flannick J.,, Sunyaev S., GoT2D Consortium and Altshuler, D. (2013) Evaluating empirical bounds on complex disease genetic architecture. Nat. Genet., 45, 1418–1427. [DOI] [PMC free article] [PubMed] [Google Scholar]
- 10.Mohlke K.L., Boehnke M., Abecasis G.R. (2008) Metabolic and cardiovascular traits: an abundance of recently identified common genetic variants. Hum. Mol. Genet., 17, R102–R108. [DOI] [PMC free article] [PubMed] [Google Scholar]
- 11.Unoki H., Takahashi A., Kawaguchi T., Hara K., Horikoshi M., Andersen G., Ng D.P., Holmkvist J., Borch-Johnsen K., Jorgensen T. et al. (2008) SNPs in KCNQ1 are associated with susceptibility to type 2 diabetes in East Asian and European populations. Nat. Genet., 40, 1098–1102. [DOI] [PubMed] [Google Scholar]
- 12.Yasuda K., Miyake K., Horikawa Y., Hara K., Osawa H., Furuta H., Hirota Y., Mori H., Jonsson A., Sato Y. et al. (2008) Variants in KCNQ1 are associated with susceptibility to type 2 diabetes mellitus. Nat. Genet., 40, 1092–1097. [DOI] [PubMed] [Google Scholar]
- 13.McCarthy M.I. (2008) Casting a wider net for diabetes susceptibility genes. Nat. Genet., 40, 1039–1040. [DOI] [PubMed] [Google Scholar]
- 14.Voight B.F., Scott L.J., Steinthorsdottir V., Morris A.P., Dina C., Welch R.P., Zeggini E., Huth C., Aulchenko Y.S., Thorleifsson G. et al. (2010) Twelve type 2 diabetes susceptibility loci identified through large-scale association analysis. Nat. Genet., 42, 579–589. [DOI] [PMC free article] [PubMed] [Google Scholar]
- 15.Visscher P.M., Brown M.A., McCarthy M.I., Yang J. (2012) Five years of GWAS discovery. Am. J. Hum. Genet., 90, 7–24. [DOI] [PMC free article] [PubMed] [Google Scholar]
- 16.Cho Y.S., Chen C.H., Hu C., Long J., Ong R.T., Sim X., Takeuchi F., Wu Y., Go M.J., Yamauchi T. et al. (2012) Meta-analysis of genome-wide association studies identifies eight new loci for type 2 diabetes in east Asians. Nat. Genet., 44, 67–72. [DOI] [PMC free article] [PubMed] [Google Scholar]
- 17.Kim Y.J., Go M.J., Hu C., Hong C.B., Kim Y.K., Lee J.Y., Hwang J.Y., Oh J.H., Kim D.J., Kim N.H. et al. (2011) Large-scale genome-wide association studies in East Asians identify new genetic loci influencing metabolic traits. Nat. Genet., 43, 990–995. [DOI] [PubMed] [Google Scholar]
- 18.Dupuis J., Langenberg C., Prokopenko I., Saxena R., Soranzo N., Jackson A.U., Wheeler E., Glazer N.L., Bouatia-Naji N., Gloyn A.L. et al. (2010) New genetic loci implicated in fasting glucose homeostasis and their impact on type 2 diabetes risk. Nat. Genet., 42, 105–116. [DOI] [PMC free article] [PubMed] [Google Scholar]
- 19.Saxena R., Hivert M.F., Langenberg C., Tanaka T., Pankow J.S., Vollenweider P., Lyssenko V., Bouatia-Naji N., Dupuis J., Jackson A.U. et al. (2010) Genetic variation in GIPR influences the glucose and insulin responses to an oral glucose challenge. Nat. Genet., 42, 142–148. [DOI] [PMC free article] [PubMed] [Google Scholar]
- 20.Pare G., Chasman D.I., Parker A.N., Nathan D.M., Miletich J.P., Zee R.Y., Ridker P.M. (2008) Novel association of HK1 with glycated hemoglobin in a non-diabetic population: a genome-wide evaluation of 14, 618 participants in the Women's Genome Health Study. PLoS Genet., 4, e1000312. [DOI] [PMC free article] [PubMed] [Google Scholar]
- 21.Soranzo N., Sanna S., Wheeler E., Gieger C., Radke D., Dupuis J., Bouatia-Naji N., Langenberg C., Prokopenko I., Stolerman E. et al. (2010) Common variants at ten genomic loci influence hemoglobin A1C levels via glycemic and non-glycemic pathways. Diabetes, 59, 3229–3239. [DOI] [PMC free article] [PubMed] [Google Scholar]
- 22.Kamatani Y., Matsuda K., Okada Y., Kubo M., Hosono N., Daigo Y., Nakamura Y., Kamatani N. (2010) Genome-wide association study of hematological and biochemical traits in a Japanese population. Nat. Genet., 42, 210–215. [DOI] [PubMed] [Google Scholar]
- 23.Strawbridge R.J., Dupuis J., Prokopenko I., Barker A., Ahlqvist E., Rybin D., Petrie J.R., Travers M.E., Bouatia-Naji N., Dimas A.S. et al. (2011) Genome-wide association identifies nine common variants associated with fasting proinsulin levels and provides new insights into the pathophysiology of type 2 diabetes. Diabetes, 60, 2624–2634. [DOI] [PMC free article] [PubMed] [Google Scholar]
- 24.Voight B.F., Kang H.M., Ding J., Palmer C.D., Sidore C., Chines P.S., Burtt N.P., Fuchsberger C., Li Y., Erdmann J. et al. (2012) The metabochip, a custom genotyping array for genetic studies of metabolic, cardiovascular, and anthropometric traits. PLoS Genet., 8, e1002793. [DOI] [PMC free article] [PubMed] [Google Scholar]
- 25.Morris A.P., Voight B.F., Teslovich T.M., Ferreira T., Segre A.V., Steinthorsdottir V., Strawbridge R.J., Khan H., Grallert H., Mahajan A. et al. (2012) Large-scale association analysis provides insights into the genetic architecture and pathophysiology of type 2 diabetes. Nat. Genet., 44, 981–990. [DOI] [PMC free article] [PubMed] [Google Scholar]
- 26.Saxena R., Elbers C.C., Guo Y., Peter I., Gaunt T.R., Mega J.L., Lanktree M.B., Tare A., Castillo B.A., Li Y.R. et al. (2012) Large-scale gene-centric meta-analysis across 39 studies identifies type 2 diabetes loci. Am. J. Hum. Genet., 90, 410–425. [DOI] [PMC free article] [PubMed] [Google Scholar]
- 27.Scott R.A., Lagou V., Welch R.P., Wheeler E., Montasser M.E., Luan J., Magi R., Strawbridge R.J., Rehnberg E., Gustafsson S. et al. (2012) Large-scale association analyses identify new loci influencing glycemic traits and provide insight into the underlying biological pathways. Nat. Genet., 44, 991–1005. [DOI] [PMC free article] [PubMed] [Google Scholar]
- 28.Palmer N.D., McDonough C.W., Hicks P.J., Roh B.H., Wing M.R., An S.S., Hester J.M., Cooke J.N., Bostrom M.A., Rudock M.E. et al. (2012) A genome-wide association search for type 2 diabetes genes in African Americans. PLoS ONE, 7, e29202. [DOI] [PMC free article] [PubMed] [Google Scholar]
- 29.Ng M.C., Shriner D., Chen B.H., Li J., Chen W.M., Guo X., Liu J., Bielinski S.J., Yanek L.R., Nalls M.A. et al. (2014) Meta-analysis of genome-wide association studies in African Americans provides insights into the genetic architecture of type 2 diabetes. PLoS Genet., 10, e1004517. [DOI] [PMC free article] [PubMed] [Google Scholar]
- 30.Tabassum R., Chauhan G., Dwivedi O.P., Mahajan A., Jaiswal A., Kaur I., Bandesh K., Singh T., Mathai B.J., Pandey Y. et al. (2013) Genome-wide association study for type 2 diabetes in Indians identifies a new susceptibility locus at 2q21. Diabetes, 62, 977–986. [DOI] [PMC free article] [PubMed] [Google Scholar]
- 31.Saxena R., Saleheen D., Been L.F., Garavito M.L., Braun T., Bjonnes A., Young R., Ho W.K., Rasheed A., Frossard P. et al. (2013) Genome-wide association study identifies a novel locus contributing to type 2 diabetes susceptibility in Sikhs of Punjabi origin from India. Diabetes, 62, 1746–1755. [DOI] [PMC free article] [PubMed] [Google Scholar]
- 32.Hara K., Fujita H., Johnson T.A., Yamauchi T., Yasuda K., Horikoshi M., Peng C., Hu C., Ma R.C., Imamura M. et al. (2014) Genome-wide association study identifies three novel loci for type 2 diabetes. Hum. Mol. Genet., 23, 239–246. [DOI] [PubMed] [Google Scholar]
- 33.SIGMA Type 2 Diabetes Consortium. (2014) Sequence variants in SLC16A11 are a common risk factor for type 2 diabetes in Mexico. Nature, 506, 97–101. [DOI] [PMC free article] [PubMed] [Google Scholar]
- 34.Imamura M., Maeda S., Yamauchi T., Hara K., Yasuda K., Morizono T., Takahashi A., Horikoshi M., Nakamura M., Fujita H. et al. (2012) A single-nucleotide polymorphism in ANK1 is associated with susceptibility to type 2 diabetes in Japanese populations. Hum. Mol. Genet., 21, 3042–3049. [DOI] [PubMed] [Google Scholar]
- 35.Li H., Gan W., Lu L., Dong X., Han X., Hu C., Yang Z., Sun L., Bao W., Li P. et al. (2013) A genome-wide association study identifies GRK5 and RASGRP1 as type 2 diabetes loci in Chinese Hans. Diabetes, 62, 291–298. [DOI] [PMC free article] [PubMed] [Google Scholar]
- 36.Go M.J., Hwang J.Y., Park T.J., Kim Y.J., Oh J.H., Kim Y.J., Han B.G., Kim B.J. (2014) Genome-wide association study identifies two novel loci with sex-specific effects for type 2 diabetes mellitus and glycemic traits in a Korean population. Diabetes Metab. J., 38, 375–387. [DOI] [PMC free article] [PubMed] [Google Scholar]
- 37.Moltke I., Grarup N., Jorgensen M.E., Bjerregaard P., Treebak J.T., Fumagalli M., Korneliussen T.S., Andersen M.A., Nielsen T.S., Krarup N.T. et al. (2014) A common Greenlandic TBC1D4 variant confers muscle insulin resistance and type 2 diabetes. Nature, 512, 190–193. [DOI] [PubMed] [Google Scholar]
- 38.Albrechtsen A., Grarup N., Li Y., Sparso T., Tian G., Cao H., Jiang T., Kim S.Y., Korneliussen T., Li Q. et al. (2013) Exome sequencing-driven discovery of coding polymorphisms associated with common metabolic phenotypes. Diabetologia, 56, 298–310. [DOI] [PMC free article] [PubMed] [Google Scholar]
- 39.Hanson R.L., Muller Y.L., Kobes S., Guo T., Bian L., Ossowski V., Wiedrich K., Sutherland J., Wiedrich C., Mahkee D. et al. (2014) A genome-wide association study in American Indians implicates DNER as a susceptibility locus for type 2 diabetes. Diabetes, 63, 369–376. [DOI] [PMC free article] [PubMed] [Google Scholar]
- 40.1000 Genomes Project Consortium. (2012) An integrated map of genetic variation from 1092 human genomes. Nature, 491, 56–65. [DOI] [PMC free article] [PubMed] [Google Scholar]
- 41.Chen G., Bentley A., Adeyemo A., Shriner D., Zhou J., Doumatey A., Huang H., Ramos E., Erdos M., Gerry N. et al. (2012) Genome-wide association study identifies novel loci association with fasting insulin and insulin resistance in African Americans. Hum. Mol. Genet., 21, 4530–4536. [DOI] [PMC free article] [PubMed] [Google Scholar]
- 42.Go M.J., Hwang J.Y., Kim Y.J., Hee Oh J., Kim Y.J., Heon Kwak S., Soo Park K., Lee J., Kim B.J., Han B.G. et al. (2013) New susceptibility loci in MYL2, C12orf51 and OAS1 associated with 1-h plasma glucose as predisposing risk factors for type 2 diabetes in the Korean population. J. Hum. Genet., 58, 362–365. [DOI] [PubMed] [Google Scholar]
- 43.Hwang J.Y., Sim X., Wu Y., Liang J., Tabara Y., Hu C., Hara K., Tam C.H., Cai Q., Zhao Q. et al. (2015) Genome-wide association meta-analysis identifies novel variants associated with fasting plasma glucose in East Asians. Diabetes, 64, 291–298. [DOI] [PMC free article] [PubMed] [Google Scholar]
- 44.Chen P., Takeuchi F., Lee J.Y., Li H., Wu J.Y., Liang J., Long J., Tabara Y., Goodarzi M.O., Pereira M.A. et al. (2014) Multiple nonglycemic genomic loci are newly associated with blood level of glycated hemoglobin in East Asians. Diabetes, 63, 2551–2562. [DOI] [PMC free article] [PubMed] [Google Scholar]
- 45.Huyghe J.R., Jackson A.U., Fogarty M.P., Buchkovich M.L., Stancakova A., Stringham H.M., Sim X., Yang L., Fuchsberger C., Cederberg H. et al. (2013) Exome array analysis identifies new loci and low-frequency variants influencing insulin processing and secretion. Nat. Genet., 45, 197–201. [DOI] [PMC free article] [PubMed] [Google Scholar]
- 46.Wessel J., Chu A.Y., Willems S.M., Wang S., Yaghootkar H., Brody J.A., Dauriz M., Hivert M.F., Raghavan S., Lipovich L. et al. (2015) Low-frequency and rare exome chip variants associate with fasting glucose and type 2 diabetes susceptibility. Nat. Commun., 6, 5897. [DOI] [PMC free article] [PubMed] [Google Scholar]
- 47.Dimas A.S., Lagou V., Barker A., Knowles J.W., Magi R., Hivert M.F., Benazzo A., Rybin D., Jackson A.U., Stringham H.M. et al. (2014) Impact of type 2 diabetes susceptibility variants on quantitative glycemic traits reveals mechanistic heterogeneity. Diabetes, 63, 2158–2171. [DOI] [PMC free article] [PubMed] [Google Scholar]
- 48.DIAbetes Genetics Replication Meta-analysis Consortium, Asian Genetic Epidemiology Network Type 2 Diabetes (AGEN-T2D) Consortium, South Asian Type 2 Diabetes (SAT2D) Consortium, Mexican American Type 2 Diabetes (MAT2D) Consortium and Type 2 Diabetes Genetic Exploration by Next-generation sequencing in multi-Ethnic Samples (T2D-GENES) Consortium. (2014) Genome-wide trans-ancestry meta-analysis provides insight into the genetic architecture of type 2 diabetes susceptibility. Nat. Genet., 46, 234–244. [DOI] [PMC free article] [PubMed] [Google Scholar]
- 49.The International HapMap Consortium. (2007) A second generation human haplotype map of over 3.1 million SNPs. Nature, 449, 851–861. [DOI] [PMC free article] [PubMed] [Google Scholar]
- 50.Perry J.R., Voight B.F., Yengo L., Amin N., Dupuis J., Ganser M., Grallert H., Navarro P., Li M., Qi L. et al. (2012) Stratifying type 2 diabetes cases by BMI identifies genetic risk variants in LAMA1 and enrichment for risk variants in lean compared to obese cases. PLoS Genet., 8, e1002741. [DOI] [PMC free article] [PubMed] [Google Scholar]
- 51.Manning A.K., Hivert M.F., Scott R.A., Grimsby J.L., Bouatia-Naji N., Chen H., Rybin D., Liu C.T., Bielak L.F., Prokopenko I. et al. (2012) A genome-wide approach accounting for body mass index identifies genetic variants influencing fasting glycemic traits and insulin resistance. Nat. Genet., 44, 659–669. [DOI] [PMC free article] [PubMed] [Google Scholar]
- 52.Steinthorsdottir V., Thorleifsson G., Sulem P., Helgason H., Grarup N., Sigurdsson A., Helgadottir H.T., Johannsdottir H., Magnusson O.T., Gudjonsson S.A. et al. (2014) Identification of low-frequency and rare sequence variants associated with elevated or reduced risk of type 2 diabetes. Nat. Genet., 46, 294–298. [DOI] [PubMed] [Google Scholar]
- 53.Mahajan A., Sim X., Ng H.J., Manning A., Rivas M.A., Highland H.M., Locke A.E., Grarup N., Im H.K., Cingolani P. et al. (2015) Identification and functional characterization of G6PC2 coding variants influencing glycemic traits define an effector transcript at the G6PC2-ABCB11 locus. PLoS Genet., 11, e1004876. [DOI] [PMC free article] [PubMed] [Google Scholar]
- 54.Flannick J., Thorleifsson G., Beer N.L., Jacobs S.B., Grarup N., Burtt N.P., Mahajan A., Fuchsberger C., Atzmon G., Benediktsson R. et al. (2014) Loss-of-function mutations in SLC30A8 protect against type 2 diabetes. Nat. Genet., 46, 357–363. [DOI] [PMC free article] [PubMed] [Google Scholar]
- 55.Sigma Type 2 Diabetes Consortium. (2014) Association of a low-frequency variant in HNF1A with type 2 diabetes in a Latino population. JAMA, 311, 2305–2314. [DOI] [PMC free article] [PubMed] [Google Scholar]
- 56.Cornes B.K., Brody J.A., Nikpoor N., Morrison A.C., Dang H.C., Ahn B.S., Wang S., Dauriz M., Barzilay J.I., Dupuis J. et al. (2014) Association of levels of fasting glucose and insulin with rare variants at the chromosome 11p11.2-MADD locus: Cohorts for Heart and Aging Research in Genomic Epidemiology (CHARGE) Consortium Targeted Sequencing Study. Circ. Cardiovasc. Genet., 7, 374–382. [DOI] [PMC free article] [PubMed] [Google Scholar]
- 57.Bonnefond A., Clement N., Fawcett K., Yengo L., Vaillant E., Guillaume J.L., Dechaume A., Payne F., Roussel R., Czernichow S. et al. (2012) Rare MTNR1B variants impairing melatonin receptor 1B function contribute to type 2 diabetes. Nat. Genet., 44, 297–301. [DOI] [PMC free article] [PubMed] [Google Scholar]
- 58.Majithia A.R., Flannick J., Shahinian P., Guo M., Bray M.A., Fontanillas P.,, Gabriel S.B., GoT2D Consortium, NHGRI JHS/FHS Allelic Spectrum Project, SIGMA Type 2 Diabetes Consortium et al. (2014) Rare variants in PPARG with decreased activity in adipocyte differentiation are associated with increased risk of type 2 diabetes. Proc. Natl. Acad. Sci. U. S. A., 111, 13127–13132. [DOI] [PMC free article] [PubMed] [Google Scholar]
- 59.Kong A., Steinthorsdottir V., Masson G., Thorleifsson G., Sulem P., Besenbacher S., Jonasdottir A., Sigurdsson A., Kristinsson K.T., Jonasdottir A. et al. (2009) Parental origin of sequence variants associated with complex diseases. Nature, 462, 868–874. [DOI] [PMC free article] [PubMed] [Google Scholar]
- 60.Hanson R.L., Guo T., Muller Y.L., Fleming J., Knowler W.C., Kobes S., Bogardus C., Baier L.J. (2013) Strong parent-of-origin effects in the association of KCNQ1 variants with type 2 diabetes in American Indians. Diabetes, 62, 2984–2991. [DOI] [PMC free article] [PubMed] [Google Scholar]