Abstract
AIM: To study oval cells pathological characteristics and relationship with the occurrence of hepatocellular carcinoma (HCC); to observe the form and structural characteristics of oval cells; to explore the expression characteristics of C-kit, PCNA mRNA and c-myc gene during the occurrence and development of HCC and the effect of ulinastatin (UTI) on C-kit and PCNA expression.
METHODS: One hundred and twenty-five SD rats fed on 3,3'-diaminobenzidine (DAB) to construct HCC models were divided into control group, cancer-inducing group and UTI intervention group. In each group, rat liver samples were collected at weeks 2, 4, 6, 8, 10, 12, 14, 16, 18, 20, 22 and 24 respectively to study pathological distribution characteristics of oval cells in the process of carcinogenesis under optical microscope. Oval cells were separated by the methods of improved density gradient centrifugation and their structural characteristics were observed under optical microscope and electronic microscope respectively; the oval cells expressing C-kit and PCNA in the collected samples were observed by the methods of immunohistochemistry and image analysis and the expression of c-myc mRNA was also detected by reverse transcription polymerase chain reaction (RT-PCR).
RESULTS: Oval cells proliferated firstly in the portal area then gradually migrated into hepatic parenchyma in the inducing group and intervention group. The oval cells distributed inside and outside the carcinoma nodes. The oval cells presented the characteristics of undifferentiated cells: a high ratio of nucleolus and cellular plasm and obvious nucleoli, rare organelle in plasm. Only a few mitochondria and endoplasmic reticulum and some villus-like apophysis on surface of cells could be seen. Cells stained with C-kit and PCNA antibody were mainly oval cells distributed in the portal area. The expression of c-myc mRNA increased with the progression of HCC. However, in the intervention group, UTI could retard its increase.
CONCLUSION: Oval cells work throughout the development of HCC, and might play important roles in this process. c-myc gene may be a kind of promoter gene of HCC, and play a key role in hepatic injury and development of HCC. UTI could retard the occurrence of HCC.
INTRODUCTION
HCC is one of the most common malignant carcinomas in China. Because of its high rate of metastasis and recurrence and lack of typical symptoms in early stage, HCC has the second mortality rate among all the malignant carcinomas[1,2]. Up to now, obvious progress has been made in the study of cell origin of HCC. One is that HCC is originated from abnormally differentiated oval cells, the other is that it results from dedifferentiation of mature liver cells. In order to probe the relationship between oval cells and HCC, we explored the pathologic distribution characteristics, structural features of oval cells in the pathogenesis of HCC in experimental SD rats and the expression characteristics of C-kit, PCNA and c-myc genes in oval cells.
MATERIALS AND METHODS
Materials
One hundred and twenty-five clearing SD rats (100 ± 20 g) (Experimental Center of Zhongshan University) were fed in the environment of 18-28 °C and 40%-70% humidity in Animal Feeding Unit, Zhujiang Hospital, First Military Medical University. DAB (Dako, Japan) was used as inducing drug for HCC in rat; proline, asparagic acid, serine phenylalanine, tyrosine pyruvate sodium, transferring, epidermal growth factor (EGF) (Sigma, USA) and F12, F12/DMEM (1:1) (Gibco, USA), and fetal bovine serum (Sijiqing Co, Hangzhou, China) were used for culture medium for oval cells. Collagenase VI and density gradient centrifugation (percoll) (Sigma) were used for separating oval cells. C-kit polyclonal antibody (Sigma), immunohistochemical kits (SABC methods) and poly-lysine for adhibiting section, neutral resin for envelop section (Boshide Co, Wuhan); PCNA immunohistochemical kits (SP methods), DAB dyeing reagent (Zhongshan Co, Beijing); c-myc mRNA kit, total RNA extraction kits, DNA marker (100 bp), primers for polymerase chain reaction (PCR) and RNAsin (Huamei Bioengineering Co), M-MLV reverse transcriptase (Promega USA), Taq DNA polymerase (Gibco), 4 × dNTP (Sigma), amplification primer for reverse transcription polymerase chain reaction (RT-PCR) were synthesized by Shanghai Biotech Co. according to the GenBank database.
Methods
HCC model The method of constructing HCC model in the cancer-inducing group and inter group was according to the references[3,4]. After fed on DAB for 14 wk, rats were given normal drinking water, but in control group, the rats were fed on standard food. In the interference group, as soon as the DAB was administrated, UTI (2-104 U/kg) was injected into abdominal cavity, twice a week until wk14[5,6]. One hundred and twenty-five clearing SD rats were divided into control group (24 rats), cancer-inducing group (48 rats) and UTI interference group (48 rats), the other 5 rats were used to construct the model of oval cells proliferation. Each group was divided into 12 sub-groups, and there were 2 rats in sub-group of the control group and the cancer-inducing group, 4 rats in sub-group of interference group. Two pieces of 1 cm × 1 cm × 1 cm tissue taken from the right liver lobe of each rat in sub-group were fixed in 40 g/L formaldehyde and 2-4 pieces of soybean-sized tissue taken from the left liver lobe of each rat in sub-group were placed respectively in the 0.5 mL centrifuge tube and preserved in a refrigerator at -80 °C at wk 2, 4, 6, 8, 10, 12, 14, 16, 18, 20, 22 and 24 respectively during construction of HCC model. The samples of right liver lobes were sliced serially to count cancerous nodes under low power microscope. Nodes more than 0.05 mm2 were measured by the gridding ocular micrometer.
Separation of oval cells When the rats have been fed DAB for 4 wk, a large number of oval cells proliferated from the hepatic portal area, which could be identified by HE dyeing section analysis. Firstly, D-Hanks’ solution was perfused through portal vein until the liver color turned yellow, then 1 g/L collagenase IV was affused to digest liver. The digested liver was put in a beaker, washed 3 times with Hank’s solution, and minced thoroughly at the same time, then 0.6 g/L collagenase IV was added to further digest liver for 30 min at 37 °C. The cell suspension was filtrated through 100 holes/cm2 sieve, then centrifuged at 300 r/min at 4 °C for 5 min, the cell suspension was extracted and centrifuged again at 2000 r/min at 4 °C for 10 min. The upper layer solution abandoned, then cells were suspended again with 10 mL F12 solution. The density gradient centrifugation solution (percoll) was blended with 100 g/L NaCl at a ratio of 9:1 and diluted with F12 into the solution of 90%, 70% and 50%, respectively. Ten mL of each solution was put in a high-speed centrifugation tube of 50 mL, according to the concentration gradient of 90%, 70% and 50%. A 10 mL cell suspension was placed on the top of each tube, then centrifuged for 30 min at 4 °C, 12000 g so that the oval cells were located between the centrifugation solution of 70% and 50%, then the oval cell suspension was extracted carefully to another tube, Hanks’ solution was added with 5 kU/L benzylpenicillin and streptomycin A, then centrifuged at 1000 r/min for 5 min, the precipitate was retained. Culture medium F12/DMEM (1:1) solution was added to suspend cells. Then the suspension was inoculated into 25 cm3 plastic culture bottles, according to the density of 2 × 10⁸/L, placed into incubating cabin with 5 mL/L CO2 at 37 °C. After 24 h the culture solution was replaced and oval cells could be seen adhering to the bottle wall.
Culture of oval cells The culture medium consisted of 200 mL/L fetal bovine serum which was diluted with the solution of DMEM/F12 (1:1) containing epidermal growth factor (20 μg/L), transferring (20 μg/L) and some kinds of amino acid. The culture medium was replaced every 2 or 3 d. When cells overgrew in the bottles, some parts of cells were transferred into another culture bottle. The culture medium in the bottles was extracted; F12 solution was added to clean the cells three times, then mixed with 2.5 g/L pancreatin to digest. The cells were observed under the microscope for about 1 min, then oval cells could be seen floating and then the culture medium was added to terminate digestion. After the cells were separated completely, they were inoculated into another bottle.
C-kit immunohistochemistry Carry sheet glasses were treated by polylysine. Paraffin sections (5 μm thick) were dewaxed by dimethylbenzene and alcohol respectively. After washed by 0.01 mol/L PBS for 2 min 3 times, the sections were incubated in 3 mL/L H2O2 solution for 10 min to inactivate endogenous peroxides, heated in citric acid sodium solution in microwave oven at 100 °C to retrieve antigen for 10 min and then cooled for 25 min. After washed with 0.1 mol/L PBS for 2 min 3 times, they were incubated with normal goat serum to block nonspecific binding of antibodies for 10 min at room temperature. The sections were then incubated with IgG of rabbit antiserum against mouse at 37 °C for 24 h or at 4 °C overnight, washed with 0.01 mol/L PBS for 3 times for 2 min each, then incubated with goat IgG anti-rabbit at 37 °Cfor 20 min, washed with 0.01 mol/L PBS for 2 min 3 times, Reagent SABC was added and incubated at 37 °C for 20 min, section were washed again with 0.01 mol/L PBS for 3 times. The immunoreacted cells were then visualized by using DAB kits as follows: a drop of reagent A, B and C was added into 1 mL distilled water, then they were blended completely and dripped on the sections. The sections were counterstained with hematoxylin for 50 s, then dehydrated and observed with light microscope.
PCNA immunohistochemistry (SP methods) The SABC reagent was replaced by the solution of streptoavidin marked with horse-radish peroxidase in the first steps and the other steps were the same as C-kit immunohistochemistry. C-kit protein was stained brown yellow. The localization of C-kit protein and its change in quantity were observed when the rats livers were injured. PCNA protein was stained as brown yellow. The localization of PCNA positive cells in the hepatic lobule was observed and PCNA labeling index (proliferating index) was calculated by randomly observing 5 fields under high microscope in each section. The positive cells among 100 cells were counted in each field and mean values were taken.
RNA extraction and assessment The preserved 50-100 mg liver tissues were mixed and grinded evenly with 1 mL cold denaturant. A 1mL lysis liquid was added into a 2.0 mL centrifuge tube and then mixed with 0.1 mL sodium acetate (pH4.0). A 100 mL phenol/chloroform mixture was mixed with the above mentioned liquid and intensely vibrated for 10 s, then placed on ice for 10 min. The liquid was centrifuged at 4 °C. The top layer liquid was transferred into a 1.5-mL centrifuge tube and kept at -20 °C for 15 min after mixed with isopropanol of identical volume. White jelly-like precipitate after centrifugation at 10000 g for 15 min at 4 °C was the total RNA. RNA was resolved completely by 1 mL lysis and RNA precipitate and wall of the tube liquid were washed with 250 mol/L alcohol. Resolved RNA in RNase-free water and preserved it at -20 °C. The absorbance (A) of total RNA was measured by ultraviolet spectrophotometer and the RNA concentration (g/L) was A260 × nucleic acid dilution times × 40/1000 (A260/A280) (if A of RNA > 1.8, the RNA is pure enough to be used in the following experiment).
Agarose electrophoresis RNA solution 1 μL mixed with 2 μL bromphenol blue buffer was electrophored in the level electrophoresis chamber treated by RNase-free water at 100 V for 20 min then the gelatum was taken to be observed. Three RNA straps of 28 s, 18 s, and 5 s could be seen through gel electrophoresis.
cDNA synthesis and PCR reaction A 2 μL (1 mg) total RNA, 4 μL (20 pmoL) of c-myc downstream primer and 8 μL of RNA-free water were mixed well at the room temperature, put in water bath at 70 °C to degenerate for 5 min. Then they were put on ice for 1 min, centrifuged at 200 g for 30 s. A 5 μL M-MLV reverse transcriptase 5 × Buffer, 5 μL dNTP (2.5 mmol/L), 5 μL rRNasin (20 U) and 5 μL M-MLV RT were added and the total reaction volume was 34 μL. The mixture was treated at 42 °C for 60 min and at 95 °C for 5 min to inactivate reverse transcriptase, then maintained at -30 °C. Sixteen μL of cDNA , 5 μL 10 × Buffer (no MgCl2), 3 μL solutions MgCl2 (25 mmol/L), 4 μL (2.5 mmol/L) dNTP, 3 μL (15pmoL) of sense including target gene and mark gene repectively, 3 μL (15 pmoL) antisense including target gene and mark gene respectively, 1 μL (3U) Taq DNA enzyme and 9 μL RNA-free water were mixed totally at the room temperature, and the above total reactive volume was 50 μL. Then a drop of paraffin oil treated at high temperature was added onto the surface of mixture , and degenerated at 94 °C for 5 min. PCR cycle was at 94 °C, 50 °C and 72 °C respectively, for 1 min each. After 35 cycles, an extension at 72 °C was performed for 5 min.
Agarose electrophoresis A 8 μL product of c-myc DNA was taken for caraphoresis in 20 g/L sepharose (containing small quantity EB), and two straps of 228-bp and 120-bp (the product of mark gene) were found under light. The caraphoresis strap of PCR was scanned and quantitatively analyzed with gel image analysis system.
Statistical analysis
Experiment results were analyzed with SPSS10.0 software. Data were analyzed with single-side analysis of variance and with LSD methods for inter-group analysis. Chi-squared test was used to compare rates between two groups. P < 0.05 indicates significant difference.
RESULTS
Pathological characteristics
The rats, liver cells in the early period of cancer-inducing group showed balloon-like degeneration under light microscope (1-8 wk). Since the 2nd wk in the cancer-inducing group, the oval cells started to proliferate in portal area and gradually migrated into liver parenchyma (Figure 1). The pseudo-lobules formed in the liver and oval cells migrated into lobules in the middle period from the 15th to 24th wk. The cancer cell nucleus presented in different sizes and karyokinesis often occurred. Cancer cells infiltrated toward the periphery of liver tissue, and at the same time, focal bleeding and necrosis obviously occurred. Huge amounts of leucocytes infiltration could be seen in the peripheral area of nodes and portal area, and lots of oval cell proliferations were shown in portal area and in cancer nodes (Figure 2). Beginning from the 2nd wk of cancer induction, the proliferation of oval cells could be seen in portal area. Firstly oval cells appeared in the epithelial lining of bile duct of portal area and then gradually proliferated and migrated into liver parenchyma. In the fibrosis formation period, the proliferation of oval cells could be seen in portal area and in its peripheral area. The volume of oval cells was about as big as one third of normal liver cells, round or oval-shaped and its margin was unclear with scant cytoplasm and basophils. The cell nucleus was round or oval shaped, with slight stain, vague membrane and obvious nucleolus. Oval cells proliferated first in portal area and then in liver limiting plate, migrated along liver sinusoids and to the middle part of lobules. These cells often presented as two lines or branches, destroying the neighboring liver cord. The left lobe liver cells were scattered among the proliferated oval cells that distributed inside and mainly outside of the cancer nodes. Oval cells showed the characteristics of undifferentiated cells: a big ratio of nucleus and plasm and obvious nucleoi, rare organele in plasm, only a few mitochondria, endoplasmic reticulum and some villus-like apophysis on surface of cells could be seen under the electronic microscope (Figure 3).
Figure 1.
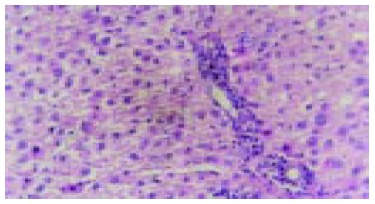
Early inflammatory liver tissues in cancer inducing group at the 2nd wk and the differentiation of oval cells in the portal area (HE staining, original magnification: × 200).
Figure 2.
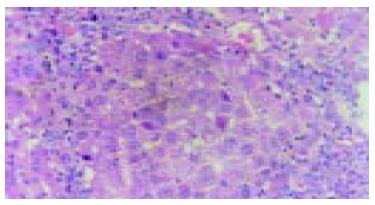
A large quantity of oval cells gathered around the cancer nodes in cancer inducing group at 20th wk (HE staining, original magnification: × 200).
Figure 3.
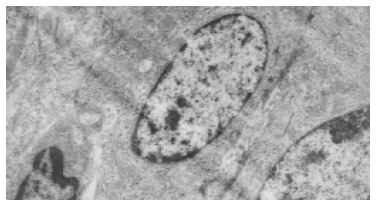
Electron microscopic observation showed: the volume of oval cell was about as big as one third of normal liver cell, round or oval shaped, scant cytoplasm with unclear cell margin.
The effect of UTI on cancer induction: in the early period, the balloon-like degeneration of liver cells was much milder than that of the liver cells in cancer-inducing group. The balloon-like degeneration of liver cells was obvious in the middle period and local liver cells became necrosis, liver lobes were destroyed and the liver fiber proliferated and the pseudo-lobues formed in the local area with a large amount of oval cell aggregating in the portal area and liver parenchyma could be seen. In the period of carcinoma formation, pseudo-lobues were seen apparently in large parts of liver parenchyma and a large number of oval cells aggregated to an extreme extent. Some liver cancer cells with column-like or glandular-like structure appeared in part of liver parenchyma and oval cells scattered among the cancer cells. The neoplasia nodes were counted as in Table 1.
Table 1.
Number of cancerous nodes and cancer nodes area in rat liver (mean ± SD, n = 8)
| t/wk |
Cases of hepatic cancer |
Number of cancerous |
Area of cancer nodes (mm2) |
|||
| A | B | A | B | A | B | |
| 2-4 | 0 | 0 | 0 | 0 | 0 | 0 |
| 6-8 | 0 | 0 | 0 | 0 | 0 | 0 |
| 10-12 | 2 | 0 | 4 | 0 | 9.5 ± 8.2 | 0 |
| 14-16 | 6 | 2 | 15 | 5 | 10.7 ± 8.7 | 5.8 ± 4.5a |
| 18-20 | 8 | 4 | 17 | 9 | 11.4 ± 8.9 | 8.5 ± 7.6 |
| 22-24 | 8 | 4 | 16 | 10 | 11.2 ± 9.3 | 8.6 ± 7.3 |
P < 0.05 vs group A; A: cancer- induction group; B: intervention group.
Characteristics of c-kit positive stain cells
C-kit positive stain localized in cell plasm in normal liver showed brown-yellow and was mainly in the mitotic and proliferating liver cells. At the 2nd wk in the cancer-inducing group, some c-kit positive stain cells, mainly oval cells, appeared in the portal area and punctated positive pigmentations could be seen in liver lobules as well. At the 8th wk, oval cells in the portal area in the cancer-inducing group were obviously positively stained, with some positive pigmentation forming patches and some punctating in the rim of portal area (Figure 4). At the 14th wk, the normal liver structure was replaced by a lot of pseudo-lobule and still a large number of c-kit positive stain cells could be seen which mainly gathered in portal area. In the 22nd wk in the cancer-inducing group, a large number of cancerous nodes formed and some positive cells scattered among them (Figure 5). The characteristics of c-kit positive staining cells in the samples of intervention group was almost identical with that in cancer-inducing group.
Figure 4.
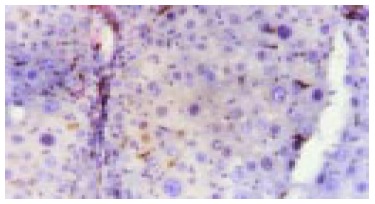
Expression of c-kit in liver tissue in cancer inducing group at the 8th wk. The oval cells were mainly stained in portal areas (Immunohistochemistry, × 200).
Figure 5.
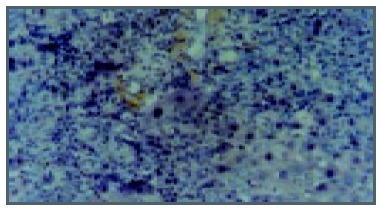
Expression of c-kit in the HCC tissue in cancer inducing group in the 24th wk (Immunohistochemistry, × 200).
Characteristics of PCNA positive cells
PCNA positive staining located in the nucleus, as granules or diffusively. Occasionally positive stains were seen in normal liver tissue. At the 2nd wk of the cancer-induction, the PCNA positive cells firstly appeared among the oval cells in the portal area. At the 4th wk, a lot of hepatic cells were positively stained, especially in central vein area. At the 6th wk, also the middle stage of inflammatory process, PCNA positive cells were seen all over the lobules of liver. At the 8th wk, the number of PCNA cells was comparatively decreased and nuclei of positive cells around the portal area tended to become larger gradually. From the 10th to 14th wk, some of the proliferating hepatic fibers were lightly stained and the oval cells in portal area still over expressed PCNA. From the 16th to 24th wk, a large number of cancerous nodes formed and PCNA over expressed in some cancerous nodes (Figure 6), while the number of positive cells was relatively fewer in necrotic cancerous nodes than in other areas and the number of dotted positive stain cells adjacent to the carcinoma tissue was apparently fewer than inside the carcinoma tissue. In the intervention group, PCNA positive stain cells firstly appeared among the oval cells in portal area, and then their number increased with the aggravation of hepatic intoxication by DAB. The PCNA positive stain rate and expression level reached the peak at the 10th wk in rat liver. The distribution characteristics of PCNA positive cells were similar to those in the cancer inducing group when HCC formed. The labeling index of PCNA positive stain cells is shown in Table 2.
Figure 6.
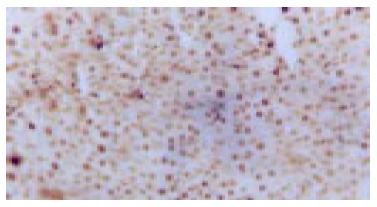
PCNA expression in HCC tissue in the cancer inducing group at the 24th wk (Immunohistochemistry, × 200).
Table 2.
PCNA positive index and c-myc relative gray value in liver (mean ± SD)
| t/wk |
Cancer induction (n = 8) |
Intervention (n = 8) |
Control (n = 4) RGV |
|||
| PCNA (%) | RGV | PCNA (%) | RGV | PCNA (%) | ||
| 2-4 | 14.1 ± 7.5a | 1.3 ± 1.0 | 7.6 ± 3.3 | 1.2 ± 0.6 | 3.0 ± 1.2 | 1.0 ± 0.3 |
| 6-8 | 48.2 ± 15.5b | 2.0 ± 07 | 24.3 ± 7.4a | 1.5 ± 0.7 | 2.9 ± 1.5 | 1.1 ± 0.4 |
| 10-12 | 23.7 ± 9.6a | 3.6 ± 1.2a | 35.1 ± 6.5b | 2.2 ± 0.9 | 3.3 ± 0.9 | 1.1 ± 0.5 |
| 14-16 | 25.9 ± 5.1a | 5.7 ± 1.4a | 21.5 ± 4.2a | 3.5 ± 1.0a | 3.7 ± 2.1 | 1.3 ± 0.4 |
| 18-20 | 36.8 ± 6.3b | 7.8 ± 1.4a | 29.6 ± 7.6a | 6.5 ± 1.1a | 3.6 ± 1.3 | 1.3 ± 0.6 |
| 22-24 | 41.2 ± 8.2b | 8.2 ± 2.2b | 30.2 ± 8.7a | 8.0 ± 1.3b | 3.5 ± 2.2 | 1.3 ± 0.4 |
P < 0.05,
P < 0.01 vs group C; RGV: Relative gray value.
c-myc gene expression
Expression of c-myc gene existed in normal rat liver tissue, but the expression quantity is relatively small. The expression of c-myc mRNA increased as soon as liver was intoxicated with DAB and its expression quantity tended to gradually increase with the aggravation of liver injury. In the period of carcinoma formation, c-myc mRNA expression level also gradually rose with the development of HCC (Table 2, Figures 7, Figures 8). The intervention of UTI could not stop but could retard the increase of expression level of c-myc mRNA.
Figure 7.
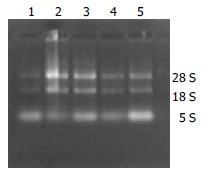
Electrophoresis image of total RNA in rat liver tissue.
Figure 8.
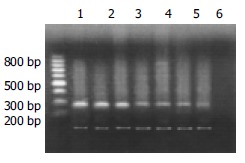
Products of RT-PCR of c-myc mRNA (up-strap: 228-bp c-myc; low-strap: 120-bp β-actin; Lanes1 and 2: Hepatocarcinoma tissue; Lane 3: Hepatocirrhosis tissue; Lanes 4-6: Inflammation tissue; Lane 7: Normal tissue).
DISCUSSION
Oval cells are round or oval shaped with scant and basophilic cytoplasm, and round or oval shaped nucleus, small and clear light stained nucleolus and clear nuclear membrane. Because they can differentiate towards hepatic cells or bile duct epithelial cells when hepatic cells are severely injured or the proliferation is inhibited, oval cells are considered as a kind of progenitor cells with potential bilateral differentiation[7]. It is reported that the activation of Ito cells was probably a precondition for the activation of oval cells and stimulates oval cells in the portal areas to migrate towards the hepatic fibrosis area. Consequently, oval cells may participate in the formation of HCC[8-11].
There is no doubt that there are hepatic stem cells in hepatic tissues, but where do the hepatic stem cells come from Some researchers thought that they were originated from the terminal biliary duct of portal area[12,13], but some insisted that they were from the canal of Hering[14-16], and some even found authentic evidence that the oval cells came from bone marrow stem cells[17-20]. In order to identify the origin of hepatic stem cells and the relationship between hepatic stem cells and the development of HCC, we carried out the study on the surface marker antigen c-kit with immunohistochemical methods, and found that: (1) In the early stage of hepatic injury, the c-kit positive stain cells firstly appeared among the oval cells in the portal area. (2) In the late stage of inflammatory lesion, c-kit was over expressed in the oval cells in the portal area and positive pigmentation presented as patches. (3) During the period of hepatic proliferation and fibrosis, positive expression of c-kit in portal area decreased compared with that in the late stage of inflammatory lesion. (4) In period of the formation of HCC, heteromorphisms of cancer cells were obvious and c-kit was still expressed in portal area. (5) At the beginning of inflammatory lesion, there were small quantities of c-kit positive cells in hepatic lobules with smaller nuclei and more were found near portal area. During the period of hepatic fibrosis, c-kit positive cells were rarely seen in hepatic lobules, but during the formation of HCC, c-kit positive cells appeared both inside and around the cancerous nodes. (6) In the normal hepatic tissues, c-kit-positive stain cells could be occasionally observed in the mitotic and proliferating hepatic cells. From these results, we can conclud that: (1) Oval cells had the highest expression level of c-kit in the portal area from hepatic injury to the occurrence and development of HCC. As it has been proved that the oval cells originate from bile duct epithelial cells in the portal area, we suggest that the terminal bile ducts are an important source of hepatic stem cells. (2) In the course of hepatic injury, c-kit positive cells could be found in hepatic lobules as well, especially near the portal area, which may be related to migration of oval cells along hepatic fibrosis into hepatic lobules. (3) C-kit was not only expressed in hepatic stem cells, but in the mitotic and proliferating hepatic cells, which indicated that c-kit might be a specific mark antigen for a type of juvenile cells, express only in a certain stage of mitotic and proliferation of hepatic cells. (4) C-kit positive stain cells played a role in the whole process of occurrence and development of HCC and appeared in cancerous nodes, so we thought that hepatic stem cells, just as was reported in literature, were involved in the occurrence and development of HCC.
PCNA is a type of Mr 36000 nuclear protein which is only synthesized and expressed in proliferating cells. Cyto-dynamics shows that PCNA begins to increase in the late G1 phase in the cell cycle, reaches the peak in the S phase and begins to decrease in the G2-M phase, in this way it regulates the replication of DNA[21-23]. Therefore, PCNA can effectively reflect the proliferation ability of cells. In this experiment we found that the high level expression of PCNA appeared firstly in the oval cells in portal area at the early stage of inflammation, significantly higher than adjacent tissue. When the mitosis and proliferation of hepatic cells were inhibited, oval cells presented firstly with active proliferation and DNA was synthesized in a large amount in nucleus. The farther they were away from the portal area, the more mature the oval cells differentiated and the larger the size of nucleus tended to be. Thus the expression of PCNA distributed radiatively and regionally around the portal area and the regional predominance was kept for a long time in the process of carcinoma induction. Oval cells took part in the whole process of development of HCC, we could speculate that there might be close relationship between the development of HCC and the PCNA overexpressing oval cells.
c-myc gene is a maintaining gene for malignant tissue, coding for a protein located in nucleolus, a type of DNA conjugated protein with the function of transcription regulation[24-27]. This experiment suggested that the expression of c-myc gene increased slightly at the beginning of hepatic injury and the expression of c-myc mRNA increased progressively with the aggravation of hepatic injury. The expression of c-myc mRNA also tended to increase with the development of HCC. The above results indicated that: (1) As an oncogene, c-myc might be a promoter gene for HCC and played an important role in maintaining hepatic injury and hepatocyte carcinomatous change. (2) During the development of HCC, the expression level of c-myc continued to increase, indicating that c-myc was not only a maintaining gene for malignant carcinoma, but the quantity of its expression was a symbol for the degree of malignancy and progression of HCC.
UTI is a kind of broad-spectrum trypsin inhibitor extracted from human beings urine. It has been found that UTI plays a prominent role in preventing cancer cells from spread. Some researchers pointed out that there were combination spots with UTI on the surface of nearly all kinds of cancer cells membrane and UTI could inhibit cancer cells to secrete granulocyte protein lyase, fibrinoclase, matrix metalloproteinase and collagenase[28,29], which can degrade peripheral matrix and lead tumor cells to spread, by combining with their receptors on the surface of cancer cell membrane. Some clinical reports showed that UTI could inhibit the cancer cells to combine with other anti-cancer drugs[30]. In this experiment, the interference of UTI throughout development of HCC and its effect on HCC were observed. It was found that from the 14th to 16th wk, the occurrence rate of HCC in the interference group was 25% (2/8), which was significantly different (P < 0.05) from that of cancer induction group at the same time. During the 18th to 20th wk and the 22nd to 24th wk, the occurrence rate of HCC was both 50% (4/8), which was lower than that in the cancer inducing group at the same time. UTI’s effect on inhibiting the occurrence of cancer was related to the following factors: (1) The occurrence of HCC needed certain micro-environment and UTI could inhibit some local cells from releasing inflammatory mediators by stabilizing lysosome membrane, then the inflammatory cells’ chemotaxis was inhibited and local inflammation was relieved, thus it could inhibit the occurrence of tumor by stabilizing micro-environment. (2) Researches proved that UTI had fairly strong function to inhibit and clear away oxygen-derived free radicals, while a lot of oxygen-derived free radical receptors existed on the surfaces of liver cells and oval cells, so possibly UTI could protect liver tissue from being damaged by oxygen-derived free radicals. Furthermore, during the whole process of cancer induction, the average cancer node area of liver rats in interference group was smaller than that of cancer inducing group at the same time points (P < 0.05), especially at the early stage of carcinogenesis, which indicated that UTI could partly inhibit the growth and local spreading of tumor cells.
The results that interference of UTI could not stop but could retard the increase of the expression of c-myc mRNA indicate two points: (1) UTI can prevent the occurrence of hepatic injury and HCC to some extent, but can not inhibit the expression of c-myc gene, which might be related with inhibitory effect on hepatic tissue inflammation and protective effect on hepatocytes of UTI. (2) The expression of c-myc gene closely relates to the severity of hepatic injury.
Footnotes
Supported by the Natural Science Foundation of Guangdong Province, No. 2001.010593, 2002.020097 and Key Science and Technology Research Project of Guangzhou, No. B012000-X-005-01-05
Edited by Zhu LH Proofread by Chen WW and Xu FM
References
- 1.Dominguez-Malagón H, Gaytan-Graham S. Hepatocellular carcinoma: an update. Ultrastruct Pathol. 2001;25:497–516. doi: 10.1080/019131201753343539. [DOI] [PubMed] [Google Scholar]
- 2.Hou L, Li Y, Jia YH, Wang B, Xin Y, Ling MY, Lü S. Molecular mechanism about lymphogenous metastasis of hepatocarcinoma cells in mice. World J Gastroenterol. 2001;7:532–536. doi: 10.3748/wjg.v7.i4.532. [DOI] [PMC free article] [PubMed] [Google Scholar]
- 3.Liu H, Nobumoto K, Yamada Y, Higashi K, Hiai H. Modulation of genetic resistance to hepatocarcinogenesis in DRH rats by partial hepatectomy. Cancer Lett. 2003;196:13–16. doi: 10.1016/s0304-3835(03)00187-3. [DOI] [PubMed] [Google Scholar]
- 4.Karmakar R, Banik S, Chatterjee M. Inhibitory effect of vitamin D3 on 3'methyl-4-dimethyl-amino-azobenzene-induced rat hepatocarcinogenesis: a study on antioxidant defense enzymes. J Exp Ther Oncol. 2002;2:193–199. doi: 10.1046/j.1359-4117.2002.01032.x. [DOI] [PubMed] [Google Scholar]
- 5.Biswas SJ, Khuda-Bukhsh AR. Effect of a homeopathic drug, Chelidonium, in amelioration of p-DAB induced hepatocarcinogenesis in mice. BMC Complement Altern Med. 2002;2:4. doi: 10.1186/1472-6882-2-4. [DOI] [PMC free article] [PubMed] [Google Scholar]
- 6.Koizumi R, Kanai H, Maezawa A, Kanda T, Nojima Y, Naruse T. Therapeutic effects of ulinastatin on experimental crescentic glomerulonephritis in rats. Nephron. 2000;84:347–353. doi: 10.1159/000045610. [DOI] [PubMed] [Google Scholar]
- 7.Freitas I, Fracchiolla S, Baronzio G, Griffini P, Bertone R, Sitar GM, Barni S, Gerzeli G, Sacco MG. Stem cell recruitment and liver de-differentiation in MMTV-neu (ErbB-2) transgenic mice. Anticancer Res. 2003;23:3783–3794. [PubMed] [Google Scholar]
- 8.Benedetti A, Di Sario A, Casini A, Ridolfi F, Bendia E, Pigini P, Tonnini C, D'Ambrosio L, Feliciangeli G, Macarri G, et al. Inhibition of the NA (+)/H (+) exchanger reduces rat hepatic stellate cell activity and liver fibrosis: an in vitro and in vivo study. Gastroenterology. 2001;120:545–556. doi: 10.1053/gast.2001.21203. [DOI] [PubMed] [Google Scholar]
- 9.Nakamura Y, Trosko JE, Chang CC, Upham BL. Psyllium extracts decreased neoplastic phenotypes induced by the Ha-Ras oncogene transfected into a rat liver oval cell line. Cancer Lett. 2004;203:13–24. doi: 10.1016/j.canlet.2003.08.022. [DOI] [PubMed] [Google Scholar]
- 10.Martel M, Sarli D, Colecchia M, Coppa J, Romito R, Schiavo M, Mazzaferro V, Rosai J. Fibroblastic reticular cell tumor of the spleen: report of a case and review of the entity. Hum Pathol. 2003;34:954–957. doi: 10.1016/s0046-8177(03)00399-x. [DOI] [PubMed] [Google Scholar]
- 11.Shan CM, Li J. Study of apoptosis in human liver cancers. World J Gastroenterol. 2002;8:247–252. doi: 10.3748/wjg.v8.i2.247. [DOI] [PMC free article] [PubMed] [Google Scholar]
- 12.Paku S, Schnur J, Nagy P, Thorgeirsson SS. Origin and structural evolution of the early proliferating oval cells in rat liver. Am J Pathol. 2001;158:1313–1323. doi: 10.1016/S0002-9440(10)64082-5. [DOI] [PMC free article] [PubMed] [Google Scholar]
- 13.Mitaka T. Hepatic stem cells: from bone marrow cells to hepatocytes. Biochem Biophys Res Commun. 2001;281:1–5. doi: 10.1006/bbrc.2001.4270. [DOI] [PubMed] [Google Scholar]
- 14.Vessey CJ, de la Hall PM. Hepatic stem cells: a review. Pathology. 2001;33:130–141. [PubMed] [Google Scholar]
- 15.Badve S, Logdberg L, Lal A, de Davila MT, Greco MA, Mitsudo S, Saxena R. Small cells in hepatoblastoma lack "oval" cell phenotype. Mod Pathol. 2003;16:930–936. doi: 10.1097/01.MP.0000086486.52370.81. [DOI] [PubMed] [Google Scholar]
- 16.Okano J, Shiota G, Matsumoto K, Yasui S, Kurimasa A, Hisatome I, Steinberg P, Murawaki Y. Hepatocyte growth factor exerts a proliferative effect on oval cells through the PI3K/AKT signaling pathway. Biochem Biophys Res Commun. 2003;309:298–304. doi: 10.1016/j.bbrc.2003.04.002. [DOI] [PubMed] [Google Scholar]
- 17.Laperche Y. [Oval cells and liver regeneration] Med Sci (Paris) 2003;19:697–698. [PubMed] [Google Scholar]
- 18.Hsu HC, Ema H, Osawa M, Nakamura Y, Suda T, Nakauchi H. Hematopoietic stem cells express Tie-2 receptor in the murine fetal liver. Blood. 2000;96:3757–3762. [PubMed] [Google Scholar]
- 19.Crosbie OM, Reynolds M, McEntee G, Traynor O, Hegarty JE, O'Farrelly C. In vitro evidence for the presence of hematopoietic stem cells in the adult human liver. Hepatology. 1999;29:1193–1198. doi: 10.1002/hep.510290402. [DOI] [PubMed] [Google Scholar]
- 20.Petersen BE, Bowen WC, Patrene KD, Mars WM, Sullivan AK, Murase N, Boggs SS, Greenberger JS, Goff JP. Bone marrow as a potential source of hepatic oval cells. Science. 1999;284:1168–1170. doi: 10.1126/science.284.5417.1168. [DOI] [PubMed] [Google Scholar]
- 21.Arroyo MP, Wang TS. Schizosaccharomyces pombe replication and repair proteins: proliferating cell nuclear antigen (PCNA) Methods. 1999;18:335–348, 324. doi: 10.1006/meth.1999.0795. [DOI] [PubMed] [Google Scholar]
- 22.Miura M. Detection of chromatin-bound PCNA in mammalian cells and its use to study DNA excision repair. J Radiat Res. 1999;40:1–12. doi: 10.1269/jrr.40.1. [DOI] [PubMed] [Google Scholar]
- 23.Gong Y, Deng S, Zhang M, Wang G, Minuk GY, Burczynski F. A cyclin-dependent kinase inhibitor (p21 (WAF1/CIP1)) affects thymidine incorporation in human liver cancer cells. Br J Cancer. 2002;86:625–629. doi: 10.1038/sj.bjc.6600099. [DOI] [PMC free article] [PubMed] [Google Scholar]
- 24.Jonas JC, Laybutt DR, Steil GM, Trivedi N, Pertusa JG, Van de Casteele M, Weir GC, Henquin JC. High glucose stimulates early response gene c-Myc expression in rat pancreatic beta cells. J Biol Chem. 2001;276:35375–35381. doi: 10.1074/jbc.M105020200. [DOI] [PubMed] [Google Scholar]
- 25.Deng CX, Brodie SG. Roles of BRCA1 and its interacting proteins. Bioessays. 2000;22:728–737. doi: 10.1002/1521-1878(200008)22:8<728::AID-BIES6>3.0.CO;2-B. [DOI] [PubMed] [Google Scholar]
- 26.Fields WR, Desiderio JG, Putnam KP, Bombick DW, Doolittle DJ. Quantification of changes in c-myc mRNA levels in normal human bronchial epithelial (NHBE) and lung adenocarcinoma (A549) cells following chemical treatment. Toxicol Sci. 2001;63:107–114. doi: 10.1093/toxsci/63.1.107. [DOI] [PubMed] [Google Scholar]
- 27.Langa F, Lafon I, Vandormael-Pournin S, Vidaud M, Babinet C, Morello D. Healthy mice with an altered c-myc gene: role of the 3' untranslated region revisited. Oncogene. 2001;20:4344–4353. doi: 10.1038/sj.onc.1204482. [DOI] [PubMed] [Google Scholar]
- 28.Kobayashi H. Suppression of urokinase expression and tumor metastasis by bikunin overexpression [mini-review] Hum Cell. 2001;14:233–236. [PubMed] [Google Scholar]
- 29.Kobayashi H, Suzuki M, Tanaka Y, Hirashima Y, Terao T. Suppression of urokinase expression and invasiveness by urinary trypsin inhibitor is mediated through inhibition of protein kinase C- and MEK/ERK/c-Jun-dependent signaling pathways. J Biol Chem. 2001;276:2015–2022. doi: 10.1074/jbc.M007650200. [DOI] [PubMed] [Google Scholar]
- 30.Noie T, Sugawara Y, Harihara Y, Takayama T, Kubota K, Ohashi Y, Makuuchi M. Kinetics of urinary trypsin inhibitor in patients undergoing partial hepatectomy. Scand J Gastroenterol. 2001;36:410–416. doi: 10.1080/003655201300051270. [DOI] [PubMed] [Google Scholar]


