Abstract
AIM: To investigate the effects of platelet-derived growth factor (PDGF) and interleukin-10 (IL-10) on Fas/Fas-ligand and Bcl-2/Bax mRNA expressions in rat hepatic stellate cells.
METHODS: Rat hepatic stellate cells (HSCs) were isolated and purified from rat liver by in situ digestion of collagenase and pronase and single-step density Nycodenz gradient. After activated by culture in vitro, HSCs were divided into 4 groups and treated with nothing (group N), PDGF (group P), IL-10 (group I) and PDGF in combination with IL-10 (group C), respectively. Semi-quantitative reverse-transcriptase polymerase chain reaction (RT-PCR) analysis was employed to compare the mRNA expression levels of Fas/FasL and Bcl-2/Bax in HSCs of each group.
RESULTS: The expression levels of Fas between the 4 groups had no significant differences (P > 0.05). FasL mRNA level in normal culture-activated HSCs (group N) was very low. It increased obviously after HSCs were treated with IL-10 (group I) (0.091 ± 0.007 vs 0.385 ± 0.051, P < 0.01), but remained the low level after treated with PDGF alone (group P) or PDGF in combination with IL-10 (group C). Contrast to the control group, after treated with PDGF and IL-10, either alone or in combination, Bcl-2 mRNA expression was down-regulated and Bax mRNA expression was up-regulated, both following the turn from group P, group I to group C. Expression of Bcl-2 mRNA in group C was significantly lower than that in group P (0.126 ± 0.008 vs 0.210 ± 0.024, P < 0.01). But no significant difference was found between group C and group I, as well as between group I and group P (P > 0.05). Similarly, the expression of Bax in group C was higher than that in group P (0.513 ± 0.016 vs 0.400 ± 0.022, P < 0.01). No significant difference was found between group I and group P (P > 0.05). But compared with group C, Bax expressions in group I tended to decrease (0.449 ± 0.028 vs 0.513 ± 0.016, P < 0.05).
CONCLUSION: PDGF may promote proliferation of HSCs but is neutral with respect to HSC apoptosis. IL-10 may promote the apoptosis of HSCs by up-regulating the expressions of FasL and Bax and down-regulating the expression of Bcl-2, which may be involved in its antifibrosis mechanism.
INTRODUCTION
Liver fibrosis is a progressive pathological process involving multi-cellular and molecular events that ultimately lead to deposition of excess matrix proteins in the extracellular space. It is generally accepted that hepatic stellate cells (HSCs) are central to the process of fibrosis as the major source of extracellular matrix (ECM) components[1-10]. Following acute or chronic liver tissue injury, HSCs undergo a process of activation towards a phenotype characterized by increasing proliferation, motility, contractility and synthesis of ECM components. Cytokines play an important role in the formation, development and reversibility of fibrosis[9-14]. Activated HSCs secrete many important cytokines through autocrine and paracrine, of which platelet-derived growth factor (PDGF) can activate secretory cells and those quiescent HSCs around[15,16] and promote the proliferation of HSCs[17]. IL-10 is a potent anti-inflammatory cytokine that inhibits the synthesis of pro-inflammatory cytokines by T helper type 1 T cells and mono/macrophages. Previous studies have shown that endogenous IL-10 has the ability to inhibit the inflammation in injured liver and block the advance of fibrosis[18-21]. Previous works by our group have demonstrated that exogenous IL-10 has an anti-fibrogenic function[22]. But the underlying mechanism remains obscure. In this study, in order to investigate the effects of IL-10 and PDGF on the proliferation and apoptosis of rat HSCs, culture-activated HSCs were treated with IL-10 and PDGF. Fas/FasL and Bcl-2/Bax mRNA expressions in each group were assayed by semiquantitative reverse-transcriptase polymerase chain reaction (RT-PCR) analysis.
MATERIALS AND METHODS
Materials
Male Wistar rats, weighing 450-500 g, were provided by Shanghai Center for Laboratory Animals. Total RNA isolation kit was obtained from Jingmei Biotechnology Company of Shenzhen. Moloney murine leukemia virus (M-MLV) reverse transcriptase was purchased from Promega. PCR reagent and Dulbecco’s modified Eagle’s medium (DMEM) were respectively provided by Shanghai Biotechnology Company and GibcoB. PCR primers were synthesized by Shanghai Biotechnology Company.
Isolation, culture and evaluation of HSCs
HSCs were isolated from normal male Wistar rats by in situ digestion of collagenase and pronase and single-step density Nycodenz gradient as Ramm GA[23] and Friedman SL[24] previously described, and cultured in DMEM supplemented with 100 mL/L FBS. Desmin immunocytochemistry was employed to determine the isolated HSCs’ purity. HSCs were subcultured 4 d after primary culture. Alpha smooth muscle actin (α-SMA) immunocytochemistry and electron microscope were employed to confirm that HSCs were activated by culture in vitro and transformed into myofibroblasts.
Intervention and division of HSCs
The subcultured HSCs were diluted to a concentration of 5 × 10⁴/mL with DMEM containing 100 mL/L FBS and seeded onto the 24-well plastic tissue culture plates. When HSCs spread the plate fully, the culture medium was replaced with DMEM containing 10 mL/L FBS. After incubated for 24 h, HSCs were divided randomly into 4 groups: one as control group cultured in 1 mL DMEM containing 10 mL/L FBS, the other three were cultured in the same medium and treated with 20 ng PDGF or 20 ng IL-10, either alone or in combination, respectively. We named them group N, group P, group I and group C, respectively. Each group included 5 wells.
RNA extraction
Total RNA was extracted from the above treated HSCs after incubated for 24 h according to the RNA isolation kit instructions. The content and purity of total RNA were determined by spectrophotography. A260/A280 of total RNA was between 1.8-2.0.
RT-PCR for Fas/FasL and Bcl-2/Bax
For RT-PCR, total RNA was reverse-transcripted using M-MLV reverse transcriptase and oligo (dT) at 37 °C for 60 min, followed by at 70 °C for 10 min. Approximately 2 µg total RNA was used in each reverse transcription reaction and the final volume was 25 µL. β-actin was used as internal control. The PCR reaction volume was 50 ul, including 5 µL 10 × PCR buffer, 2 mmol/L MgCl2, 1 µL 10 mmol/L dNTP, 1 µL 20 pmol/µL target gene sense and anti-sense primers, 1 µL 20 pmol/µL β-actin primer pair, 2 µL RT product, 1.5 U Tag DNA polymerase. The specific sets of primers and the target gene amplification conditions are shown in Table 1.
Table 1.
Primer sequences for PCR and amplification conditions for each target gene
| Primer (base) | Sequence | Amplification conditions |
| Fas 414 | 5’-GAATGCAAGGGACTGATAGC-3’ | Denaturation at 94 °C for 45 s, |
| 5’-TGGTTCGTGTGCAAGGCTC-3’ | Annealing at 55 °C for 30 s and synthesizing | |
| at 72 °C for 1 min for 25 cycles | ||
| FasL 239 | 5’-GGAATGGGAAGACACATATGGAACTGC-3’ | Denaturation at 94 °C for 45 s, |
| 5’-CATATCTGGCCAGTAGTGCAGTAATTC-3’ | Annealing at 55 °C for 30 s and synthesizing | |
| at 72 °C for 1 min for 33 cycles | ||
| Bcl-2525 | 5’-TATGATAACCGGGAGATCGTGATC-3’ | Denaturation at 94 °C for 45 s, |
| 5’-GTGCAGATGCCGGTTCAGGTACTC-3’ | Annealing at 60 °C for 30 s and synthesizing | |
| at 72 °C for 1 min for 33 cycles | ||
| Bax 310 | 5’-GACACCTGAGCTGACCTTGG-3’ | Denaturation at 94 °C for 45 s, |
| 5’-GAGGAAGTCCAGTGTCCAGC-3’ | Annealing at 60 °C for 30 s and synthesizing | |
| at 72 °C for 1 min for 30 cycles | ||
| β-actin 660 | 5’-CCAACCGTGAAAAGATGACC-3’ | Changed according to different target genes |
| 5’-CAGGAGGAGCAATGATCTTG-3’ |
All initial denaturations were at 94 °C for 5 min. Finally an additional extension step at 72 °C for 7 min was done.
Result determination
PCR products were run on 20 g/L agarose gel eletrophoresis and visualized with ethidium bromide staining. Bio imagine system was used to detect the densities of bands of the PCR products. The ratio of target gene density to β-actin density was used to represent the relative levels of Fas/FasL and Bcl-2/Bax mRNA expressions. The semi-quantitative detection was analyzed 5 times repeatedly.
Statistical analysis
All data were expressed as mean ± SE. The significance for the difference between the groups was assessed with SPSS 10.0 by one-way ANOVA. P < 0.05 was considered statistically significant.
RESULTS
Evaluation of HSCs
Freshly isolated HSCs were round-shaped with many yellow droplets in cytoplasm. After cultured for 5-6 d, the spread cells showed a typical ‘star’-like configuration. Desmin immunocytochemistry showed that the positive percentage was about 95% (Figure 1A), indicating that 95% of the isolated cells were HSCs. α-SMA immunocytochemistry showed that 98% of the cells were α-SMA positive (Figure 1B), indicating that most of the cells were activated. The myofilament could be seen in cytoplasm under the electron microscope, confirming that HSCs were activated and transformed into myofibroblasts after cultured in vitro (Figure 2).
Figure 1.
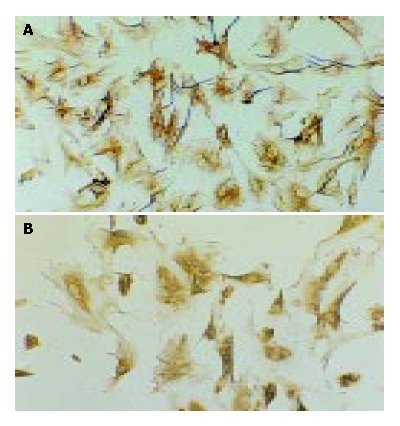
Desmin and α-SMA immunocytochemistry (SP, origi-nal magnification: × 100). A: Desmin immunocytochemistry of HSCs 7 d after isolation; B: α-SMA immunocytochemistry of HSCs 7 after isolation.
Figure 2.
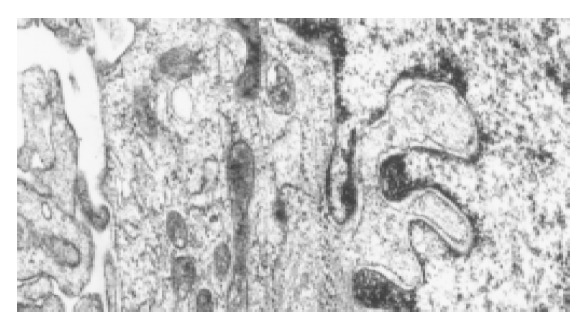
Activated HSCs under the electron microscope. The myofilament can be seen in the cytoplasm as the arrow point shows.
Effects of PDGF and IL-10 on Fas and FasL expressions in HSCs
Fas mRNA was expressed in HSCs of each group and the expression levels had no significant difference among the 4 groups, as shown in Figure 3A, Figure 4A, indicating that neither PDGF nor IL-10 had effect on Fas mRNA expression in HSCs. As it could be informed from Figure 3B, Figure 4B, FasL mRNA level in normal culture-activated HSCs (group N) was very low. It increased obviously after HSCs were treated with IL-10 (group I) (0.091 ± 0.007 vs 0.385 ± 0.051, P < 0.01), but remained the low level after treated with PDGF alone (group P) or PDGF in combination with IL-10 (group C) (0.085 ± 0.006, 0. 101 ± 0.008, respectively). The data suggested that IL-10 could improve FasL mRNA expression in culture-activated HSCs and PDGF could not. Furthermore, PDGF tended to abolish this effect of IL-10.
Figure 3.
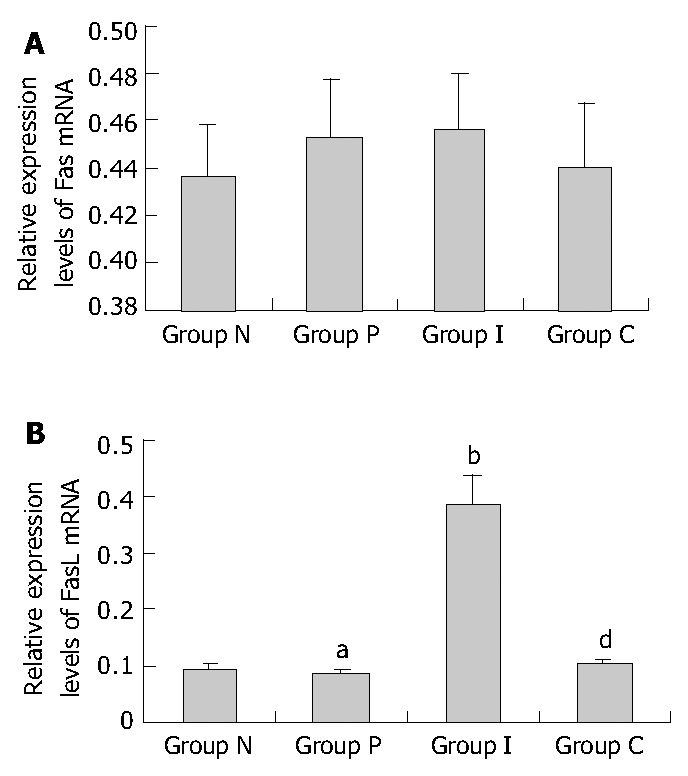
Relative Fas/FasL mRNA expression levels in HSCs of different groups assessed by RT-PCR. A: Relative Fas mRNA expression levels (P > 0.05 between random two groups.); B: Relative FasL mRNA expression levels (aP > 0.05 vs group N, bP < 0.01 vs group N, dP < 0.01 vs group I.); group N: Normal group as control; group P: PDGF treated group; group I: IL-10 treated group; group C: Combined PDGF and IL-10 treatment group.
Figure 4.
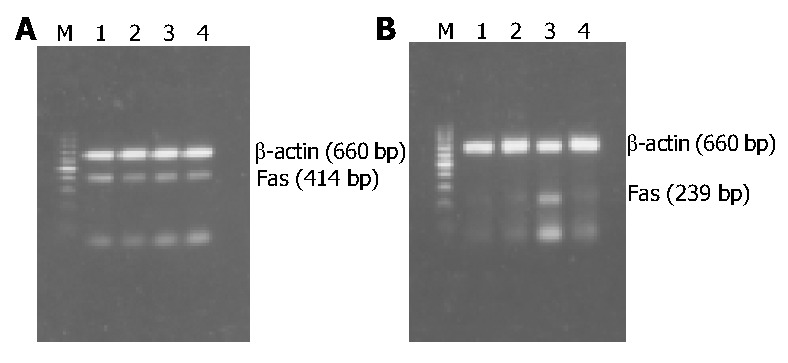
RT-PCR results of Fas/FasL mRNA expression in HSCs of different groups. A: RT-PCR results of Fas mRNA expression; B: RT-PCR results of FasL mRNA expression; M: 100 bp DNA ladder (upper to lower: 1000, 900, 800, 700, 600, 500, 400, 300, 200, and 100 bp); Lane 1: Normal group as control; Lane 2: PDGF treatment group; Lane 3: IL-10 treatment group; Lane 4: Combined PDGF and IL-10 treatment group.
Effects of PDGF and IL-10 on Bcl-2 and Bax expressions in HSCs
Bcl-2 and Bax mRNA were expressed in normal culture-activated HSCs. Both of their expression levels were significantly changed after treated with PDGF and IL-10, either alone or in combination. Bcl-2 mRNA expression was down-regulated and Bax mRNA expression was up-regulated, following the turn from group P, group I to group C. The expression of Bcl-2 in group C was significantly lower than that in group P (0.126 ± 0.008 vs 0.210 ± 0.024, P < 0.01). But no significant difference was found between group C and group I, as well as between group I and group P (0.210 ± 0.024 vs 0.166 ± 0.017, 0.166 ± 0.017 vs 0.126 ± 0.008, P > 0.05) (Figure 5A, Figure 6A). Similarly, the expression of Bax in group C was higher than that in group P (0.513 ± 0.016 vs 0.400 ± 0.022, P < 0.01). No significant difference was found between group I and group P (0.400 ± 0.022 vs 0.449 ± 0.028, P > 0.05). But compared with combined treatment group, Bax expressions in group I tended to decrease (0.449 ± 0.028 vs 0.513 ± 0.016, P = 0.045 < 0.05) (Figure 5B, Figure 6B). These results showed that both PDGF and IL-10 promoted the Bax mRNA expression in HSCs and inhibited the Bcl-2 expression, but the differences of their effects were not significant. Intervention with PDGF and IL-10 seemed to be able to manifest effects on Bax expression than intervention alone. IL-10 showed similar influences on culture-activated HSCs and reactivated HSCs by PDGF.
Figure 5.
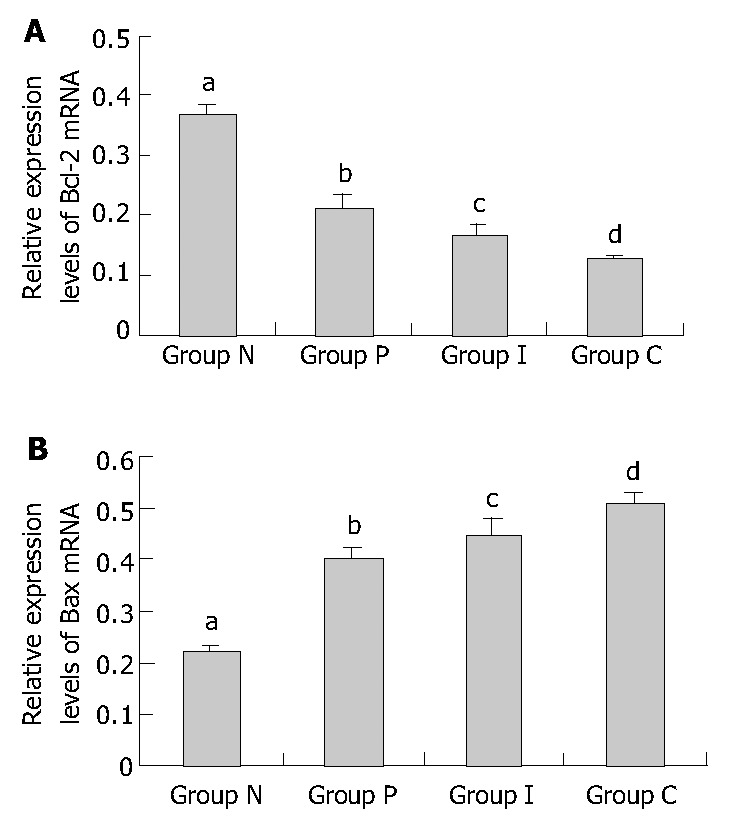
Relative Bcl-2/Bax mRNA expression levels in HSCs of different groups assessed by RT-PCR. A: Relative Bcl-2 mRNA expression levels (bP < 0.01 vs group P, group I and group C, respectively; aP > 0.05 vs group I, cP > 0.05 vs group C, dP < 0.01 vs group P.). B: Relative Bax mRNA expression levels (bP < 0.01 vs group P, group I and group C, respectively; aP > 0.05 vs group I, cP = 0.045 < 0.05 vs group C, dP < 0.01 vs group P.). Group N: Normal group as control; group P: PDGF treated group; group I: IL-10 treated group; group C: Combined PDGF and IL-10 treatment group.
Figure 6.
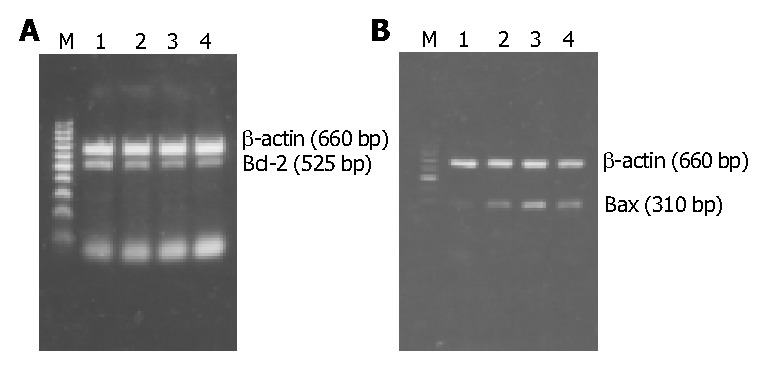
RT-PCR results of Bcl-2/Bax mRNA expression in HSCs of different groups. A: Bcl-2 mRNA expression. B: Bax mRNA expression. M: 100 bp DNA ladder (upper to lower: 1000, 900, 800, 700, 600, 500, 400, 300, 200, and 100 bp); Lane 1: Normal group as control; Lane 2: PDGF treatment group; Lane 3: IL-10 treatment group; Lane 4: Combined PDGF and IL-10 treatment group.
DISCUSSION
It is generally accepted that hepatic stellate cells (HSCs) are central to the process of hepatic fibrosis. They are the major source of extracellular matrix and during fibrogenesis undergo an activation process characterized by increased proliferation and collagen synthesis[1-10,24]. So the activation, proliferation and apoptosis of HSCs have close relationship with the formation and development of liver fibrosis. To inhibit the activation and proliferation of the HSCs and promote their apoptosis has become the most important therapeutic approach for liver fibrosis[7-10,14,25-28].
There is evidence that HSCs can be successfully isolated by in situ digestion of collagenase and pronase and single-step density Nycodenz gradient[23,24,29]. Desmin is a marker for muscle cells and expressed by all muscle lineages including HSCs (either quiescent or activated) in the liver. Alpha smooth muscle actin (α-SMA) is an intermediate filament protein that is expressed by activated HSCs and is widely accepted to be a marker of activation. Both of them were used to identify and quantify HSCs and their activation. The desmin immunocytochemistry result showed that the purity of the isolated HSCs by this method was satisfying (Figure 1A). The results of α-SMA immunocytochemistry (Figure 1B) and electron microscope (Figure 2) confirmed that HSCs were activated and transformed into myofibroblasts after cultured in vitro.
PDGF, which is produced by HSCs, Kuffer cells and platelets, is a major mitogen for connective tissues and certain other cells. It was viewed as one of the most important growth factors serving as the matrix-bound cytokines[11] and plays an important role in the pathogenesis of liver fibrosis via promoting the activation and proliferation of HSCs[12,15,25,30-32]. The best characterized chemotactic factor for HSCs identified so far is the PDGF-BB[33-35] which is also known as the most potent mitogen for HSCs over-expressed during active hepatic fibrosis[36]. But there is also evidence that PDGF is proapoptotic for fibroblasts in conditions of low serum[37]. Saile B[38] reported that resting HSCs displayed no sign of apoptosis and spontaneous apoptosis became detectable in parallel with HSCs activation, suggesting that apoptosis might represent an important mechanism terminating proliferation of activated HSCs. He also found that Fas and Fas-ligand in HSCs became increasingly expressed during the course of activation. But our data demonstrated that PDGF alone had no effect on the expression of Fas and FasL during further activating the culture-activated HSCs, which was supported by Issa R[39]. Bax and Bcl-2 are known as the representatives of proapoptotic factor and contra-apoptotic factor of Bcl-2 family, respectively[40,41]. In our study, evidences showed that PDGF could promote Bax mRNA expression in HSCs and inhibited Bcl-2 mRNA expression as well, resulting in the apoptosis of HSCs[41]. All the above data demonstrated that PDGF can accelerate the apoptosis of HSCs through Bcl-2/Bax pathway in parallel with their proliferation[42]. In other words, PDGF may promote proliferation but is neutral with respect to HSCs apoptosis. But the proportion of apoptosis-inducing forces and apoptosis-inhibiting forces would determine that PDGF-activated HSCs tend to proliferate and increase[22].
Cytokine interleukin-10 (IL-10), produced by lymphocytes and macrophages as well as cells within liver such as Kufffer cells, hepatocytes and HSCs, has profound inhibitory actions on macrophages and inflammation. The present studies showed that IL-10 had additional effects on connective tissue cells, such as HSCs and fibroblast. IL-10 could inhibit the activation of HSCs by inflammatory cells[43], relieve the inflammation of liver[18,19,44], suppress the function of NF-κ B[45] and affect the expression of collagen I and collagenase[20], thus exerting an antifibrogenesis effect[46]. Failure for HSCs to sustain IL-10 expression might underlie pathologic progression to liver cirrhosis[18,20] .Our previous studies also implied that IL-10 had an antagonism on CCL4-induced rat hepatic fibrosis[22]. But the underlying mechanism remains obscure. In this study, our results showed that IL-10 could promote the expression of FasL and Bax mRNA in culture-activated HSCs and meanwhile could inhibit Bcl-2 mRNA expression, implying that IL-10 may induce the apoptosis of HSCs through binding FasL to Fas on the cell membranes of HSCs and increasing the proportion of Bax and Bcl-2. Saile B[38] found that apoptosis could be fully blocked by Fas-blocking antibodies in normal cells and HSCs already entering the apoptotic cycle, implying that Fas/FasL system is the key pathway for the apoptosis of HSCs. Our data, however, showed that Bax/Bcl-2 system was another important pathway involving in HSCs’ apoptosis[40,41]. In short, IL-10 could promote the apoptosis of HSCs, which may be related to its mechanism of antifibrosis.
There is evidence that activated-HSCs could express IL-10 as well as its receptor[20,47]. In this study, PDGF had a similar effect to IL-10 on Bax/Bcl-2 mRNA expression in HSCs. This promotes us to hypothesize that PDGF may regulate the expression of Bax and Bcl-2 mRNA by affecting the expression of IL-10 in HSCs. But PDGF in combination with IL-10 did not show a satisfying synergistic action, thus we can not exclude the possibility that PDGF and IL-10 affect in different ways, and further works are demanded.
Footnotes
Supported by the Science and Technology Fundation of Fujian Province, No. 2003D05
Edited by Wang XL Proofread by Chen WW and Xu FM
References
- 1.Gressner AM. Transdifferentiation of hepatic stellate cells (Ito cells) to myofibroblasts: a key event in hepatic fibrogenesis. Kidney Int Suppl. 1996;54:S39–S45. [PubMed] [Google Scholar]
- 2.Brenner DA, Waterboer T, Choi SK, Lindquist JN, Stefanovic B, Burchardt E, Yamauchi M, Gillan A, Rippe RA. New aspects of hepatic fibrosis. J Hepatol. 2000;32:32–38. doi: 10.1016/s0168-8278(00)80413-4. [DOI] [PubMed] [Google Scholar]
- 3.Benyon RC, Iredale JP. Is liver fibrosis reversible? Gut. 2000;46:443–446. doi: 10.1136/gut.46.4.443. [DOI] [PMC free article] [PubMed] [Google Scholar]
- 4.Murphy FR, Issa R, Zhou X, Ratnarajah S, Nagase H, Arthur MJ, Benyon C, Iredale JP. Inhibition of apoptosis of activated hepatic stellate cells by tissue inhibitor of metalloproteinase-1 is mediated via effects on matrix metalloproteinase inhibition: implications for reversibility of liver fibrosis. J Biol Chem. 2002;277:11069–11076. doi: 10.1074/jbc.M111490200. [DOI] [PubMed] [Google Scholar]
- 5.Rockey DC. The cell and molecular biology of hepatic fibrogenesis. Clinical and therapeutic implications. Clin Liver Dis. 2000;4:319–355. doi: 10.1016/s1089-3261(05)70113-6. [DOI] [PubMed] [Google Scholar]
- 6.Du WD, Zhang YE, Zhai WR, Zhou XM. Dynamic changes of type I,III and IV collagen synthesis and distribution of collagen-producing cells in carbon tetrachloride-induced rat liver fibrosis. World J Gastroenterol. 1999;5:397–403. doi: 10.3748/wjg.v5.i5.397. [DOI] [PMC free article] [PubMed] [Google Scholar]
- 7.Bataller R, Brenner DA. Hepatic stellate cells as a target for the treatment of liver fibrosis. Semin Liver Dis. 2001;21:437–451. doi: 10.1055/s-2001-17558. [DOI] [PubMed] [Google Scholar]
- 8.Reeves HL, Friedman SL. Activation of hepatic stellate cells--a key issue in liver fibrosis. Front Biosci. 2002;7:d808–d826. doi: 10.2741/reeves. [DOI] [PubMed] [Google Scholar]
- 9.Albanis E, Friedman SL. Hepatic fibrosis. Pathogenesis and principles of therapy. Clin Liver Dis. 2001;5:315–334, v-vi. doi: 10.1016/s1089-3261(05)70168-9. [DOI] [PubMed] [Google Scholar]
- 10.Li D, Friedman SL. Liver fibrogenesis and the role of hepatic stellate cells: new insights and prospects for therapy. J Gastroenterol Hepatol. 1999;14:618–633. doi: 10.1046/j.1440-1746.1999.01928.x. [DOI] [PubMed] [Google Scholar]
- 11.Friedman SL. Cytokines and fibrogenesis. Semin Liver Dis. 1999;19:129–140. doi: 10.1055/s-2007-1007105. [DOI] [PubMed] [Google Scholar]
- 12.Pinzani M, Marra F. Cytokine receptors and signaling in hepatic stellate cells. Semin Liver Dis. 2001;21:397–416. doi: 10.1055/s-2001-17554. [DOI] [PubMed] [Google Scholar]
- 13.Gressner AM. The up-and-down of hepatic stellate cells in tissue injury: apoptosis restores cellular homeostasis. Gastroenterology. 2001;120:1285–1288. doi: 10.1053/gast.2001.23439. [DOI] [PubMed] [Google Scholar]
- 14.Gressner AM. The cell biology of liver fibrogenesis - an imbalance of proliferation, growth arrest and apoptosis of myofibroblasts. Cell Tissue Res. 1998;292:447–452. doi: 10.1007/s004410051073. [DOI] [PubMed] [Google Scholar]
- 15.Kinnman N, Francoz C, Barbu V, Wendum D, Rey C, Hultcrantz R, Poupon R, Housset C. The myofibroblastic conversion of peribiliary fibrogenic cells distinct from hepatic stellate cells is stimulated by platelet-derived growth factor during liver fibrogenesis. Lab Invest. 2003;83:163–173. doi: 10.1097/01.lab.0000054178.01162.e4. [DOI] [PubMed] [Google Scholar]
- 16.Oh SJ, Kurz H, Christ B, Wilting J. Platelet-derived growth factor-B induces transformation of fibrocytes into spindle-shaped myofibroblasts in vivo. Histochem Cell Biol. 1998;109:349–357. doi: 10.1007/s004180050235. [DOI] [PubMed] [Google Scholar]
- 17.Chen A, Zhang L. The antioxidant (-)-epigallocatechin-3-gallate inhibits rat hepatic stellate cell proliferation in vitro by blocking the tyrosine phosphorylation and reducing the gene expression of platelet-derived growth factor-beta receptor. J Biol Chem. 2003;278:23381–23389. doi: 10.1074/jbc.M212042200. [DOI] [PubMed] [Google Scholar]
- 18.Thompson K, Maltby J, Fallowfield J, McAulay M, Millward-Sadler H, Sheron N. Interleukin-10 expression and function in experimental murine liver inflammation and fibrosis. Hepatology. 1998;28:1597–1606. doi: 10.1002/hep.510280620. [DOI] [PubMed] [Google Scholar]
- 19.Louis H, Van Laethem JL, Wu W, Quertinmont E, Degraef C, Van den Berg K, Demols A, Goldman M, Le Moine O, Geerts A, et al. Interleukin-10 controls neutrophilic infiltration, hepatocyte proliferation, and liver fibrosis induced by carbon tetrachloride in mice. Hepatology. 1998;28:1607–1615. doi: 10.1002/hep.510280621. [DOI] [PubMed] [Google Scholar]
- 20.Wang SC, Ohata M, Schrum L, Rippe RA, Tsukamoto H. Expression of interleukin-10 by in vitro and in vivo activated hepatic stellate cells. J Biol Chem. 1998;273:302–308. doi: 10.1074/jbc.273.1.302. [DOI] [PubMed] [Google Scholar]
- 21.Demols A, Van Laethem JL, Quertinmont E, Degraef C, Delhaye M, Geerts A, Deviere J. Endogenous interleukin-10 modulates fibrosis and regeneration in experimental chronic pancreatitis. Am J Physiol Gastrointest Liver Physiol. 2002;282:G1105–G1112. doi: 10.1152/ajpgi.00431.2001. [DOI] [PubMed] [Google Scholar]
- 22.Chen YX, Wang XZ, Weng SG, Chen ZX, Huang YH, Zhang LJ. [Effects of Interleukin-10 on the proliferation and Fas/Fas ligand expression of hepatic stellate cells] Zhonghua Gan Zang Bing Za Zhi. 2003;11:637, 640. [PubMed] [Google Scholar]
- 23.Ramm GA. Isolation and culture of rat hepatic stellate cells. J Gastroenterol Hepatol. 1998;13:846–851. doi: 10.1111/j.1440-1746.1998.tb00747.x. [DOI] [PubMed] [Google Scholar]
- 24.Friedman SL, Rockey DC, McGuire RF, Maher JJ, Boyles JK, Yamasaki G. Isolated hepatic lipocytes and Kupffer cells from normal human liver: morphological and functional characteristics in primary culture. Hepatology. 1992;15:234–243. doi: 10.1002/hep.1840150211. [DOI] [PubMed] [Google Scholar]
- 25.Friedman SL. Molecular regulation of hepatic fibrosis, an integrated cellular response to tissue injury. J Biol Chem. 2000;275:2247–2250. doi: 10.1074/jbc.275.4.2247. [DOI] [PubMed] [Google Scholar]
- 26.Safadi R, Friedman SL. Hepatic fibrosis--role of hepatic stellate cell activation. MedGenMed. 2002;4:27. [PubMed] [Google Scholar]
- 27.Arthur MJ, Mann DA, Iredale JP. Tissue inhibitors of metalloproteinases, hepatic stellate cells and liver fibrosis. J Gastroenterol Hepatol. 1998;13 Suppl:S33–S38. [PubMed] [Google Scholar]
- 28.Iredale JP, Benyon RC, Pickering J, McCullen M, Northrop M, Pawley S, Hovell C, Arthur MJ. Mechanisms of spontaneous resolution of rat liver fibrosis. Hepatic stellate cell apoptosis and reduced hepatic expression of metalloproteinase inhibitors. J Clin Invest. 1998;102:538–549. doi: 10.1172/JCI1018. [DOI] [PMC free article] [PubMed] [Google Scholar]
- 29.Riccalton-Banks L, Bhandari R, Fry J, Shakesheff KM. A simple method for the simultaneous isolation of stellate cells and hepatocytes from rat liver tissue. Mol Cell Biochem. 2003;248:97–102. doi: 10.1023/a:1024184826728. [DOI] [PubMed] [Google Scholar]
- 30.Marra F, Choudhury GG, Pinzani M, Abboud HE. Regulation of platelet-derived growth factor secretion and gene expression in human liver fat-storing cells. Gastroenterology. 1994;107:1110–1117. doi: 10.1016/0016-5085(94)90236-4. [DOI] [PubMed] [Google Scholar]
- 31.Kinnman N, Goria O, Wendum D, Gendron MC, Rey C, Poupon R, Housset C. Hepatic stellate cell proliferation is an early platelet-derived growth factor-mediated cellular event in rat cholestatic liver injury. Lab Invest. 2001;81:1709–1716. doi: 10.1038/labinvest.3780384. [DOI] [PubMed] [Google Scholar]
- 32.Liu X, Zhang J, Zhang Y. [Effects of platelet-derived growth factor on the proliferation of hepatic stellate cells and their expressions of genes of collagens and platelet-derived growth factor] Zhonghua Binglixue Zazhi. 2000;29:27–29. [PubMed] [Google Scholar]
- 33.Ikeda K, Wakahara T, Wang YQ, Kadoya H, Kawada N, Kaneda K. In vitro migratory potential of rat quiescent hepatic stellate cells and its augmentation by cell activation. Hepatology. 1999;29:1760–1767. doi: 10.1002/hep.510290640. [DOI] [PubMed] [Google Scholar]
- 34.Marra F, Gentilini A, Pinzani M, Choudhury GG, Parola M, Herbst H, Dianzani MU, Laffi G, Abboud HE, Gentilini P. Phosphatidylinositol 3-kinase is required for platelet-derived growth factor's actions on hepatic stellate cells. Gastroenterology. 1997;112:1297–1306. doi: 10.1016/s0016-5085(97)70144-6. [DOI] [PubMed] [Google Scholar]
- 35.Carloni V, Romanelli RG, Pinzani M, Laffi G, Gentilini P. Focal adhesion kinase and phospholipase C gamma involvement in adhesion and migration of human hepatic stellate cells. Gastroenterology. 1997;112:522–531. doi: 10.1053/gast.1997.v112.pm9024306. [DOI] [PubMed] [Google Scholar]
- 36.Pinzani M. PDGF and signal transduction in hepatic stellate cells. Front Biosci. 2002;7:d1720–d1726. doi: 10.2741/A875. [DOI] [PubMed] [Google Scholar]
- 37.Kim HR, Upadhyay S, Li G, Palmer KC, Deuel TF. Platelet-derived growth factor induces apoptosis in growth-arrested murine fibroblasts. Proc Natl Acad Sci USA. 1995;92:9500–9504. doi: 10.1073/pnas.92.21.9500. [DOI] [PMC free article] [PubMed] [Google Scholar]
- 38.Saile B, Knittel T, Matthes N, Schott P, Ramadori G. CD95/CD95L-mediated apoptosis of the hepatic stellate cell. A mechanism terminating uncontrolled hepatic stellate cell proliferation during hepatic tissue repair. Am J Pathol. 1997;151:1265–1272. [PMC free article] [PubMed] [Google Scholar]
- 39.Issa R, Williams E, Trim N, Kendall T, Arthur MJ, Reichen J, Benyon RC, Iredale JP. Apoptosis of hepatic stellate cells: involvement in resolution of biliary fibrosis and regulation by soluble growth factors. Gut. 2001;48:548–557. doi: 10.1136/gut.48.4.548. [DOI] [PMC free article] [PubMed] [Google Scholar]
- 40.Saile B, Matthes N, El Armouche H, Neubauer K, Ramadori G. The bcl, NFkappaB and p53/p21WAF1 systems are involved in spontaneous apoptosis and in the anti-apoptotic effect of TGF-beta or TNF-alpha on activated hepatic stellate cells. Eur J Cell Biol. 2001;80:554–561. doi: 10.1078/0171-9335-00182. [DOI] [PubMed] [Google Scholar]
- 41.Gong W, Pecci A, Roth S, Lahme B, Beato M, Gressner AM. Transformation-dependent susceptibility of rat hepatic stellate cells to apoptosis induced by soluble Fas ligand. Hepatology. 1998;28:492–502. doi: 10.1002/hep.510280229. [DOI] [PubMed] [Google Scholar]
- 42.Eng FJ, Friedman SL. Fibrogenesis I. New insights into hepatic stellate cell activation: the simple becomes complex. Am J Physiol Gastrointest Liver Physiol. 2000;279:G7–G11. doi: 10.1152/ajpgi.2000.279.1.G7. [DOI] [PubMed] [Google Scholar]
- 43.Weng S, Leng X, Wei Y. [Interleukin-10 inhibits the activation of cultured rat hepatic stellate cells induced by Kupffer cells] Zhonghua Yixue Zazhi. 2002;82:104–107. [PubMed] [Google Scholar]
- 44.Leifeld L, Cheng S, Ramakers J, Dumoulin FL, Trautwein C, Sauerbruch T, Spengler U. Imbalanced intrahepatic expression of interleukin 12, interferon gamma, and interleukin 10 in fulminant hepatitis B. Hepatology. 2002;36:1001–1008. doi: 10.1053/jhep.2002.35532. [DOI] [PubMed] [Google Scholar]
- 45.Yoshidome H, Kato A, Edwards MJ, Lentsch AB. Interleukin-10 inhibits pulmonary NF-kappaB activation and lung injury induced by hepatic ischemia-reperfusion. Am J Physiol. 1999;277:L919–L923. doi: 10.1152/ajplung.1999.277.5.L919. [DOI] [PubMed] [Google Scholar]
- 46.Nelson DR, Lauwers GY, Lau JY, Davis GL. Interleukin 10 treatment reduces fibrosis in patients with chronic hepatitis C: a pilot trial of interferon nonresponders. Gastroenterology. 2000;118:655–660. doi: 10.1016/s0016-5085(00)70134-x. [DOI] [PubMed] [Google Scholar]
- 47.Thompson KC, Trowern A, Fowell A, Marathe M, Haycock C, Arthur MJ, Sheron N. Primary rat and mouse hepatic stellate cells express the macrophage inhibitor cytokine interleukin-10 during the course of activation In vitro. Hepatology. 1998;28:1518–1524. doi: 10.1002/hep.510280611. [DOI] [PubMed] [Google Scholar]


