

Abstract
In many circumstances, the pathogenesis of distal renal tubular acidosis (dRTA) is not understood. In the present study, we report that a mouse model lacking the electrogenic Na+-HCO3− cotransporter [NBCe2/Slc4a5; NBCe2 knockout (KO) mice] developed dRTA after an oral acid challenge. NBCe2 expression was identified in the connecting tubule (CNT) of wild-type mice, and its expression was significantly increased after acid loading. NBCe2 KO mice did not have dRTA when on a standard mouse diet. However, after acid loading, NBCe2 KO mice exhibited complete features of dRTA, characterized by insufficient urinary acidification, hyperchloremic hypokalemic metabolic acidosis, and hypercalciuria. Additional experiments showed that NBCe2 KO mice had decreased luminal transepithelial potential in the CNT, as revealed by micropuncture. Further immunofluorescence and Western blot experiments found that NBCe2 KO mice had increased expression of H+-ATPase B1 in the plasma membrane. These results showed that NBCe2 KO mice with acid loading developed increased urinary K+ and Ca2+ wasting due to decreased luminal transepithelial potential in the CNT. NBCe2 KO mice compensated to maintain systemic pH by increasing H+-ATPase in the plasma membrane. Therefore, defects in NBCe2 can cause dRTA, and NBCe2 has an important role to regulate urinary acidification and the transport of K+ and Ca2+ in the distal nephron.
Keywords: electrogenic Na+-HCO3− cotransporter, distal renal tubular acidosis, connecting tubule
a typical western diet generates an acid load, which must be excreted by the kidney. To maintain acid/base homeostasis, the kidney tubules reabsorb HCO3− and secrete H+ to generate acidic urine (pH < 6). Excretion of the ingested acid load and reabsorption of filtered HCO3− are accomplished by complex processes requiring coordinated actions of transporters and enzymes in the kidney tubules. Deficiency in these transporters or enzymes may cause renal tubular acidosis (RTA).
Distal RTA (dRTA) is the classical form of RTA and was the first described. Classical features of dRTA include an inability to acidify urine, hyperchloremic metabolic acidosis, hypokalemia, and hypercalciuria. To date, mutations in three genes affecting two transporters of type A intercalated cells in the collecting duct have been identified in patients with dRTA: solute carrier (SLC)4A1, encoding Cl−/HCO3− exchanger 1 (22), ATP6V1B1, encoding the B1 subunit of H+-ATPase (21), and ATP6V0A4, encoding the a4 subunit of H+-ATPase (36). Genetic ablation of the above three proteins in mice also produce phenotypes that resemble some of the features in human dRTA (12, 17, 29, 30, 36). Other studies have shown that mice lacking K+-Cl− cotransporter 4 (encoded by Slc4a7) and forkhead box protein I1 (encoded by Foxi1) have similar features of dRTA (3, 4), suggesting that other distal tubule transporters also play important roles in acid/base regulation. Although hypokalemia has been reported in mice disrupted for the B1 subunit of H+-ATPase (16), none of these mouse models of dRTA reported demonstrate both hypokalemia and hypercalciuria, which are typically observed in patients.
The proximal tubule is responsible for recapturing the majority of filtered HCO3− (6, 27). However, the acid/base transporters of the distal nephron, including the connecting tubule (CNT), cortical collecting ducts (CCDs), and medullary collecting ducts (MCDs), respond to variations in acid intake to maintain plasma pH within the normal range of 7.3–7.4 (13). H+-ATPase, which resides in intercalated cells of the CCD and MCD, has been the most studied and predominant transporter responsible for extruding an acid load in these distal segments (28). However, there is less information on the acid/base regulation of the CNT, which plays an important role in acid/base regulation (26, 38) and is the most important site for regulated renal K+ secretion and Ca2+ reabsorption (5, 14). It is possible that deficiency of the transporter(s) in the CNT causes RTA, in association with increased urinary K+ and Ca2+ excretion.
The electrogenic Na+-HCO3− cotransporter (NBCe2, also referred as NBC4) is encoded by the SLC4A5 gene. It is notable that members of the SLC4 family, as recently reviewed (9, 10, 32, 34), are involved in dRTA. Recent studies have suggested that NBCe2 expresses in the distal nephron and is involved in acid/base regulation in the renal distal tubule (11, 15). In the present study, we identified NBCe2 in the CNT. After acid loading, mice without NBCe2 developed deficient urinary acidification, hyperchloremic metabolic acidosis, hypokalemia, hyperkaliuria, and hypercalciuria. Thus, a deficiency in NBCe2 results in all manifestations of dRTA.
MATERIALS AND METHODS
Animal experiments.
Wild-type (WT) mice (C57BL/6) were purchased from Charles River (Wilmington, MA). NBCe2 knockout (KO) mice (129) were generated as previously described (15). NBCe2 KO mice were backcrossed to C57Bl/6 mice for at least six generations using marker-assisted speed congenics. All mice were maintained in accordance with the Institutional Animal Care and Use Committee of the University of Nebraska Medical Center. For all experiments, mice (12–20 wk old) had full access to water and were fed with standard rodent diet (TD.7012, Harlan Laboratories, Indianapolis, IN). For acid loading experiments, 1.5% NH4Cl (280 mM) and 1% sucrose were added in the drinking water (12, 44) for 7–10 days. Urine was collected in metabolic cages (Tecniplast, Exton, PA) for 24 h. Urine Na+ and K+ concentrations were analyzed with a flame photometer (Jenway Clinical PFP7, Stone, Staffordshire, UK), and pH was determined with a model 215 pH meter (Denver Instruments, Bohemia, NY). Urine Ca2+ concentration was measured with a Zeeman 4110 ZL Atomic Absorption Spectrophotometer (Perkin-Elmer, Waltham, MA). At the time of euthanization, we extracted blood from the carotid artery. Arterial blood compositions were analyzed with the MN: 300 i-STAT system (Abbott Point of Care, Princeton, NJ). Plasma and urine osmolalities were measured using a model 3250 osmometer (Advanced Instruments, Norwood, MA). The kidney cortex was harvested for RT-PCR, immunohistochemical (IHC) staining, and Western blot analysis. The transtubular K+ gradient (TTKG) was calculated as follows: urine K+ concentration × plasma osmolality/plasma K+ concentration × urine osmolality, where both urine and plasma K+ concentrations were measured by flame photometry, as previously described (41). Urine titratable acid (TA) and net acid (NA) concentrations were determined as previously described (8). Briefly, equal volumes (0.1 ml) of urine and 0.1 N HCl were mixed and boiled for 2 min to drive out all CO2. After being cooled to 37°C for 10 min, the mix was titrated with 0.1 N NaOH to pH 7.4. The blank (distilled water) was treated in an identical fashion. The concentration of TA was calculated as the difference in volumes of NaOH required to titrate the sample and blank multiplied by the normality of NaOH times 1,000, yielding the concentration of TA (in mM). The above samples were then added to 0.1 ml of 8% formaldehyde and titrated back to pH 7.4 with 0.1 N NaOH. The concentration of NA was calculated as the difference in volumes of NaOH required to titrate the sample and blank multiplied by the normality of NaOH times 1,000, giving the concentration of NA (in mM).
CNT isolation and RT-PCR.
The CNT was isolated in mice kidneys as previously described (19, 41). Briefly, kidneys were cut into coronal slices of 2–3 mm thickness and then transferred rapidly into ice-cold standard solution [containing (in mM) 150 NaCl, 5 KCl, 1 CaCl2, 2 MgCl2, 5 glucose, and 10 HEPES]. CNT fragments were selected under a stereomicroscope for RT-PCR. RNA was isolated using the TRIzol method (Invitrogen, Grand Island, NY) as previously described (45). Reverse transcription was performed using the SuperScript III First-Strand Synthesis System for RT-PCR (Invitrogen). Conventional and real-time RT-PCR were performed using the Taq PCR Master Mix Kit (Qiagen, Valencia, CA) and iQ SYBR green supermix (Bio-Rad, Hercules, CA), respectively. The primers used were as follows: NBCe2, 5′-TCTGACTCCTCCATCAGTGG-3′ and 5′-CCGTGAGTAGCTGAAAGCAG-3′; and β-actin, 5′-GGCTGTATTCCCCTCCATCG-3′ and 5′-CCAGTTGGTAACAATGCCATGT-3′. Data were analyzed using the 2−ΔΔCt method (where Ct is threshold cycle).
Plasma membrane protein isolation and Western blot analysis.
The plasma membrane fraction of the kidney cortex was isolated using the Minute Plasma Membrane Protein Isolation Kit (Invent Biotechnologies, Eden Prairie, MN) according to the manufacturer's instructions. The quality of the plasma membrane isolation was verified as described in our previous study (44). Western blot analysis was performed as previously described by our laboratory (44). The primary antibodies were anti-NBCe2 antibody (custom rabbit polyclonal antibody targeted against the mouse COOH-terminus: MEGIPSDPQNGIHC, diluted 1:500, Bethyl Laboratories, Montgomery, TX), anti-H+-ATPase B1 (goat polyclonal, diluted 1:200, Santa Cruz Biotechnology, Dallas, TX), and anti-cadherin (goat polyclonal, diluted 1:500, Santa Cruz Biotechnology) with goat anti-rabbit IgG or donkey anti-goat IgG conjugated to horseradish peroxidase (diluted 1:10,000-1:20,000, Santa Cruz Biotechnology). Expression of proteins was quantified by densitometry using Quantity One (Bio-Rad).
Immunohistochemistry.
Fluorescent IHC analysis of kidney sections was performed as previously described (44). The antibody used was as follows: anti-H+-ATPase B1 (goat polyclonal, diluted 1:200, Santa Cruz Biotechnology). After being washed, the tissue was incubated for 1 h (23°C) in the dark with secondary antibody (donkey anti-goat IgG conjugated to Alexa fluor594, diluted 1:200, Invitrogen).
Micropuncture and transepithelial potential measurement.
Micropuncture of mouse kidney tubules was performed as previously described (39). Briefly, mice were anesthetized with ketamine-xylazine, and the left kidney was placed in a Lucite cup. After surgery, a modified saline solution (140 mM NaCl, 5 mM KHCO3, and 2% mannitol) was infused through the left jugular vein at a rate of 1.2 ml·h−1·100 g body wt−1. Proximal and distal tubules were identified by injection of 1% fast green. Fine tip microelectrodes were placed in the lumen of the tubule. A reference electrode was placed on the surface near the luminal microelectrode. Voltage was recorded using a high-impedance electrometer (model FD223, World Precision Instruments, Hamden, CT), and data were analyzed using Clampex software (Axon Instruments, Sunnyvale, CA).
Statistical analyses.
Data shown in figures represent means ± SE. Significant differences between each group were determined by Student's t-test or ANOVA. P values of <0.05 were considered significant.
RESULTS
Upregulation of NBCe2 in the CNT and kidney cortex with acid loading.
Figure 1 shows transcript and protein expression of NBCe2 in the CNT. Expression of NBCe2 mRNA was identified in the mouse kidney and, more specifically, in the CNT using conventional RT-PCR, as revealed by a product of 96 bp with DNA gel electrophoresis (Fig. 1A). Real-time RT-PCR further showed that expression of NBCe2 mRNA in the CNT was significantly increased in mice with acid loading (280 mM NH4Cl in drinking water) compared with those on a standard diet (Fig. 1B). Western blot analysis also identified NBCe2 protein expression (∼120 kDa) in plasma membranes of the kidney cortex of WT but not NBCe2 KO mice. These results are consistent with the previous description of NBCe2 KO mice, where mass spectrometry was used to demonstrate the loss of NBCe2 protein (15). However, we observed other nonspecific bands, demonstrating that the antibody used may not be completely specific under Western blot conditions (Fig. 1C). Additional experiments found that expression of NBCe2 protein was significantly increased in plasma membranes of the kidney cortex in acid-loaded WT mice (Fig. 1D).
Fig. 1.

Expression of the electrogenic Na+-HCO3− cotransporter (NBCe2) in the connecting tubule (CNT) and kidney cortex. A: identification of NBCe2 mRNA in the kidney and CNT of wild-type (WT) mice by RT-PCR and DNA gel electrophoresis. RT, reverse transcriptase. B: real-time RT-PCR showing increased expression of NBCe2 mRNA in the CNT of WT mice with acid loading (n = 5 mice/group). *P < 0.05 vs. the standard diet. C: identification of NBCe2 protein expression in plasma membranes (PMs) of the kidney cortex by Western blot. KO, knockout mice. D and E: Western blot analysis showing increased protein expression of NBCe2 in PMs of the kidney cortex in WT mice with acid loading (n = 4 mice/group). *P < 0.05 vs. the standard diet.
NBCe2 KO mice exhibit renal tubular hyperchloremic metabolic acidosis.
When WT and NBCe2 KO mice were given a standard diet (Table 1), arterial blood gas analysis revealed no significant differences in plasma pH, HCO3− concentration, total CO2, base excess, Cl− concentration, and urine pH. When both WT and NBCe2 KO mice were acid loaded, NBCe2 KO mice had significantly lower plasma pH, HCO3− concentration, total CO2, and base excess, whereas plasma Cl− concentration and urine pH were higher. Additional analysis found that urinary titratable acid excretion (WT mice on standard diet: 48.0 ± 7.2 μmol·day−1·g kidney wt−1, n = 3, vs. NBCe2 KO mice on standard diet: 13.1 ± 1.8 μmol·day−1·g kidney wt−1, n = 4, P < 0.001; WT mice with acid loading: 38.7 ± 3.8 μmol·day−1·g kidney wt−1, n = 11, vs. NBCe2 KO mice with acid loading: 20.3 ± 2.0 μmol·day−1·g kidney wt−1, n = 10, P < 0.001) and net acid excretion (WT mice on standard diet: 63.2 ± 5.6 μmol·day−1·g kidney wt−1, n = 3, vs. NBCe2 KO mice on standard diet: 22.9 ± 1.8 μmol·day−1·g kidney wt−1, n = 4, P < 0.001; WT mice with acid loading: 104.5 ± 4.3 μmol·day−1·g kidney wt−1, n = 11, vs. NBCe2 KO mice with acid loading: 54.2 ± 5.6 μmol·day−1·g kidney wt−1, n = 10, P < 0.001) were both significantly lower in NBCe2 KO mice compared with WT mice (Fig. 2). These results reveal that NBCe2 KO mice with acid loading had a urinary acidification impairment and developed renal tubular hyperchloremic metabolic acidosis.
Table 1.
Comparison of blood and urine analysis between WT and NBCe2 KO mice on standard diet and with acid loading
| WT Mice on Standard Diet |
NBCe2 KO Mice on Standard Diet |
WT Mice With Acid Loading |
NBCe2 KO Mice With Acid Loading |
|||||||||||
|---|---|---|---|---|---|---|---|---|---|---|---|---|---|---|
| Value | SE | n | Value | SE | n | P Value | Value | SE | n | Value | SE | n | P Value | |
| Blood | ||||||||||||||
| K+, mM | 3.88 | 0.09 | 4 | 3.68 | 0.09 | 4 | NS | 4.03 | 0.14 | 12 | 3.52 | 0.07 | 10 | 0.009 |
| Na+, mM | 150.5 | 1 | 4 | 151.3 | 1.3 | 4 | NS | 153.2 | 0.4 | 12 | 156 | 0.7 | 10 | 0.003 |
| pH | 7.34 | 0.02 | 4 | 7.34 | 0.01 | 4 | NS | 7.21 | 0.01 | 12 | 7.12 | 0.03 | 10 | 0.004 |
| Total CO2, mM | 21.3 | 0.9 | 4 | 21 | 1.1 | 4 | NS | 18.4 | 0.9 | 12 | 14.3 | 0.7 | 10 | 0.002 |
| HCO3−, mM | 20.1 | 0.8 | 4 | 19.9 | 1 | 4 | NS | 17.3 | 0.8 | 12 | 14.1 | 1 | 10 | 0.012 |
| Pco2, mmHg | 37.5 | 1.6 | 4 | 37.1 | 1.8 | 4 | NS | 42.3 | 1.7 | 12 | 42.3 | 2.1 | 10 | NS |
| Cl−, mM | 116.5 | 1.2 | 4 | 117 | 2.3 | 4 | NS | 121.5 | 1.1 | 12 | 125.8 | 1.2 | 10 | 0.013 |
| Base excess, mM | −5.8 | 1 | 4 | −6 | 1.1 | 4 | NS | −10 | 0.8 | 12 | −16.9 | 1.1 | 10 | <0.001 |
| Anion gap, mM | 17.8 | 0.6 | 4 | 18 | 0.4 | 4 | NS | 18.2 | 0.5 | 12 | 19.7 | 0.6 | 10 | NS |
| Blood urea nitrogen, mg/dl | 27.3 | 2.3 | 4 | 25.3 | 1.7 | 4 | NS | 31.1 | 0.9 | 12 | 28.5 | 1.1 | 10 | NS |
| Osmolality, mosm | 275 | 2.9 | 4 | 282.5 | 4.8 | 4 | NS | 284 | 3.3 | 12 | 281.9 | 3.1 | 10 | NS |
| Urine | ||||||||||||||
| pH | 6.44 | 0.07 | 4 | 6.34 | 0.22 | 4 | NS | 5.49 | 0.05 | 12 | 5.94 | 0.13 | 10 | 0.003 |
| Output, ml/day | 1.05 | 0.25 | 4 | 0,78 | 0.05 | 4 | NS | 0.47 | 0.05 | 12 | 0.66 | 0.11 | 10 | NS |
| K+, mM | 453.9 | 49.2 | 4 | 577.5 | 51.4 | 4 | NS | 476 | 53.5 | 11 | 496.7 | 131 | 9 | NS |
| Na+, mM | 282.1 | 38.2 | 4 | 341.7 | 21.5 | 4 | NS | 352.3 | 32.8 | 12 | 270.4 | 51 | 10 | NS |
| Ca2+, mM | 56.3 | 9.8 | 3 | 56.8 | 5.2 | 3 | NS | 40.6 | 7.6 | 10 | 50.3 | 6.3 | 8 | NS |
| Osmolality, mosm | 3055 | 397 | 4 | 3808 | 210 | 4 | NS | 5654 | 558 | 12 | 5620 | 1072 | 10 | NS |
| Body weight, g | 21.4 | 0.7 | 4 | 19.2 | 0.6 | 4 | NS | 21 | 0.3 | 12 | 20.9 | 0.6 | 10 | NS |
| Intake | ||||||||||||||
| Food, g | 2.45 | 0.38 | 12 | 2.66 | 0.38 | 9 | NS | 1.27 | 0.25 | 12 | 0.93 | 0.28 | 10 | NS |
| Water, g | 4.31 | 0.35 | 12 | 3.21 | 0.4 | 9 | NS | 1.93 | 0.36 | 12 | 1.89 | 0.33 | 10 | NS |
WT mice, wild-type mice; NBCe2 KO mice, electrogenic Na+-HCO3− cotransporter knockout mice; NS, not significant.
Fig. 2.
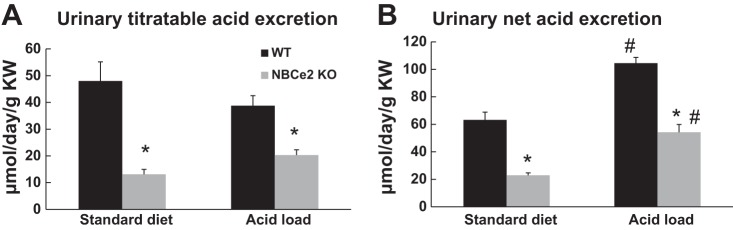
Urinary titratable and net acid excretion of WT and NBCe2 KO mice. A: urinary titratable acid excretion. B: urinary net acid excretion. KW, kidney weight. n = 3 WT mice on standard diet, 4 NBCe2 KO mice on standard diet, 11 WT mice with acid loading, and 10 NBCe2 KO mice with acid loading. *P < 0.05 vs. WT mice; #P < 0.05 vs. the standard diet.
NBCe2 KO mice exhibit hyperkaliuric hypokalemia and hypercalciuria with acid loading.
As shown in Fig. 3, A–D, and Table 1, arterial blood and urine analysis revealed no significant differences in plasma K+ concentration, urinary K+ excretion (WT mice: 1,658.1 ± 371.5 μmol·day−1·g kidney wt−1, n = 4, vs. NBCe2 KO mice: 1,850.4 ± 179.5 μmol·day−1·g kidney wt−1, n = 4, P = 0.44), TTKG (WT mice: 10.1 ± 0.5, n = 4, vs. NBCe2 KO mice: 9.9 ± 0.6, n = 4, P = 0.79), and urinary Ca2+ excretion (WT mice: 196.6 ± 55.7 μmol·day−1·g kidney wt−1, n = 3, vs. NBCe2 KO mice: 185.5 ± 16.7 μmol·day−1·g kidney wt−1, n = 3, P = 0.74) between WT and NBCe2 KO mice when they were on standard diet. However, when mice were acid loaded, NBCe2 KO mice had a significantly lower plasma K+ concentration and higher urinary K+ excretion (WT mice: 703.4 ± 55.9 μmol·day−1·g kidney wt−1, n = 11, vs. NBCe2 KO mice: 991.4 ± 82.3 μmol·day−1·g kidney wt−1, n = 9, P = 0.024), TTKG (WT mice: 5.2 ± 0.2, n = 11, vs. NBCe2 KO mice: 6.3 ± 0.3, n = 9, P = 0.009), and urinary Ca2+ excretion (WT mice: 59.8 ± 6.9 μmol·day−1·g kidney wt−1, n = 10, vs. NBCe2 KO mice: 102.9 ± 11.8 μmol·day−1·g kidney wt−1, n = 8, P = 0.03) compared with WT mice. These results reveal that acid-loaded NBCe2 KO mice developed hyperkaliuric hypokalemia and hypercalciuria. There was no significant Ca2+ deposition within the kidney (nephrocalcinosis) in both WT and NBCe2 KO mice with acid loading, as examined by Von Kossa staining (Fig. 3E).
Fig. 3.

K+ balance and Ca2+ excretion of standard diet-fed and acid-loaded NBCe2 KO mice compared with WT mice as revealed by plasma K+ concentration (A), the rate of urinary K+ excretion (B), and the transtubular K+ gradient (TTKG; C). n = 4 WT mice on standard diet, 4 NBCe2 KO mice on standard diet, 12/11 WT mice with acid loading, and 10/9 NBCe2 KO mice with acid loading. *P < 0.05 vs. WT mice; #P < 0.05 vs. the standard diet. D: urinary Ca2+ excretion in WT and NBCe2 KO mice. n = 3 WT mice on standard diet, 3 NBCe2 KO mice on Standard diet, 10 WT mice with acid loading, and 8 NBCe2 KO mice with acid loading. *P < 0.05 vs. WT mice; #P < 0.05 vs. the standard diet. E: von Kossa staining in the kidney cortex and medulla of WT and NBCe2 KO mice with acid loading.
Acid-loaded NBCe2 KO mice exhibit decreased luminal transepithelial potential in the CNT.
Micropuncture was used to assess transepithelial potential (Vte) of the late distal tubules in vivo. The average length for late distal tubule measurements, from the site of micropuncture to entry into the CCD, was 158.6 ± 18.0 μm (n = 7). This distance places the late distal tubule measurements at the CNT, as previously described (27). As shown in Fig. 4, Vte was significantly lower in NBCe2 KO mice with both standard diet and acid loading compared with WT mice (WT mice on standard diet: −11.0 ± 0.6 mV, n = 3, vs. NBCe2 KO mice on standard diet: −12.9 ± 0.6 mV, n = 3, P = 0.012; WT mice with acid loading: −0.6 ± 0.2, n = 5, vs. NBCe2 KO mice with acid loading: −3.1 ± 0.3 mV, n = 4, P < 0.001). These results are consistent with the K+ and Ca2+ wasting found in NBCe2-KO mice.
Fig. 4.
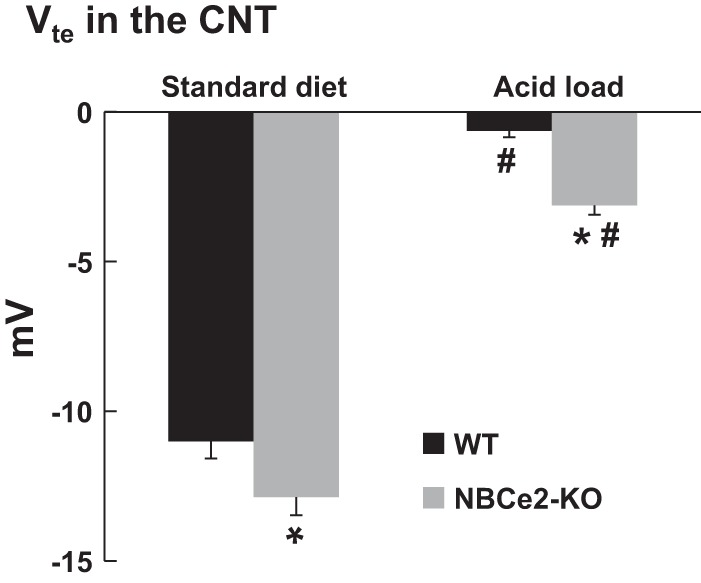
Assessment of transepithelial potential (Vte) in the CNT. Summary bar plots of Vte in the CNT from WT and NBCe2 KO mice on standard diet or with acid loading are shown. n = 3 WT mice on standard diet, 3 NBCe2 KO mice on standard diet, 5 WT mice with acid loading, and 4 NBCe2 KO mice with acid loading. *P < 0.05 vs. WT mice; #P < 0.05 vs. the standard diet.
H+-ATPase B1 in acid-loaded NBCe2 KO mice.
IHC showed that H+-ATPase B1 expression in WT mice with acid loading was mostly distributed in the cytoplasm, whereas it was restricted to the apical membrane in NBCe2 KO mice with acid loading (Fig. 5A). Western blot analysis also revealed that plasma membrane H+-ATPase B1 expression was significantly increased in the kidney cortex of NBCe2 KO mice with acid water compared with WT mice (Fig. 5, B and C).
Fig. 5.

Expression of apical membrane H+-ATPase B1 from the renal cortex of acid-loaded NBCe2 KO mice. A: immunofluorescence showing apical membrane H+-ATPase B1 expression in acid-loaded NBCe2-KO mice compared with WT mice. B and C: Western blots (B) and summary bar plots (C) of relative H+-ATPase B1 expression in PMs of the renal cortex of acid-loaded NBCe2 KO mice compared with WT mice. n = 4 mice/group. *P < 0.05 vs. WT mice.
DISCUSSION
NBCe2 deficiency and dRTA.
The Slc4a5 gene encodes NBCe2; its expression has been identified in the choroid plexus (20), liver (1), and kidney (47). Electrophysiological studies have shown that NBCe2 mediates Na+-HCO3− transport with a 1:2 or 1:3 stoichiometry and plays an important role in intracellular pH regulation (35, 40). NBCe2 is localized in the distal nephron (11, 15), and NBCe2 KO mice exhibit decreased plasma HCO3− concentration and increased urinary HCO3− excretion. These findings are consistent with the notion that NBCe2 plays an important role in acid/base regulation in the renal distal tubule. The detailed mechanism of the role of NBCe2 in acid/base transport is still not clear. However, a previous study (15) has suggested that the increased urinary HCO3− wasting in NBCe2 KO mice may be caused by upregulation of pendrin in intercalated cells.
Plasma HCO3− concentrations were not significantly different between WT and NBCe2 KO mice when they consumed the standard diet. This result is different from the original study (15) on NBCe2, which described a small decrease in NBCe2 KO mice compared with WT mice. The difference between studies is most likely due to genetic strain differences. NBCe2 KO mice were back-crossed for six generations in the present study, whereas the mice were back-crossed for two generations in the original study.
We expected lower Pco2 values in NBCe2 KO mice, as the breathing rate should be stimulated by increased chemoreceptor activity to compensate for the metabolic acidosis. However, Pco2 values of both acid-loaded WT and NBCe2 KO mice were in the normal range. We suspect that the Pco2 values were higher than expected because anesthesia causes transient respiratory suppression with Pco2 elevation during the death of the mice.
It is also notable that regular rodent chow provides a dietary alkali load (26). However, a typical Western diet provides a net acid load, due to the high protein content, and produces acidic urine. Increased protein intake is correlated with enhanced urinary acid excretion (23, 33). Thus, we propose that NBCe2 is unnecessary in renal acidification when the diet is alkaline but becomes essential to acidifying the urine and maintaining plasma pH in the context of a dietary acid load. Acid dietary loading, which simulates the human Western diet, would maximize NBCe2 function. A subject with deficient NBCe2 may develop dRTA after acid loading.
Effects of NBCe2 KO on distal tubule K+ and Ca2+.
In the present study, we found that acid-loaded NBCe2 KO mice developed hypokalemia, hyperkaliuria, and hypercalciuria together with renal tubular metabolic acidosis. These features fully resemble typical dRTA in humans. To further explore the possible mechanisms, we found that Vte in the CNT of NBCe2 KO mice was significantly lower than WT mice. This explains the increased urinary K+ and Ca2+ wasting in NBCe2 KO mice with acid loading. Our very latest study (46) showed that the decreased Vte in the CNT of NBCe2 KO mice was mostly due to increased activity of the epithelial Na+ channel (ENaC). Exactly how NBCe2 regulates ENaC needs further investigation. We propose that, like the electoneutral Na+-HCO3− cotransporter (NBCn1) in the thick ascending limb (31), NBCe2 protein should localize in the basolateral membrane of principle cells and mediate Na+/2HCO3− influx during acidosis to buffer cellular pH. The NBCe2-mediated Na+ uptake would increase the intracellular Na+ concentration in principal cells and thus subsequently inhibit ENaC-mediated Na+ reabsorption. The electrogenicity of NBCe2 would also hyperpolarize the cell and decrease the driving force for K+ secretion via renal outer medullary K+ channels and inhibit the driving force and activity of large-conductance channels at the apical membrane.
Although we found increased Ca2+ excretion in acid-loaded NBCe2 KO mice, we did not determine pathophysiological consequences of Ca2+ loss. Because NBCe2 KO mice did not exhibit dRTA and hypercalciuria until acid loading, we did not expect low bone density with short-term acid loading. In acid-loaded NBCe2 KO mice, we also found increased H+-ATPase B1 expression in the apical membrane, probably as a compensatory mechanism to maintain plasma pH in the absence of NBCe2.
Summary and conclusions.
Genetic studies in humans have shown that mutations in the SLC4A5 gene are associated with hypertension (2, 7, 18). Targeted disruption of NBCe2 in mice also results in hypertension (15) or neurological dysfunction (20). These studies suggest that NBCe2 plays an important role in various other biological functions. Our present study demonstrated that NBCe2 is required for maximal urinary acidification and that a deficiency in NBCe2 causes dRTA in mice. Further human genetic and physiological studies would be necessary to identify the role of SLC4A5/NBCe2 in dRTA.
GRANTS
This work was funded by National Institute of Diabetes and Digestive and Kidney Diseases Grants RO1-DK-071014 and RO1-DK-092474 (to S. C. Sansom), and American Heart Association-Midwest Affiliate Fellowship 11PRE7530018 (to R. J. Cornelius).
DISCLOSURES
No conflicts of interest, financial or otherwise, are declared by the author(s).
AUTHOR CONTRIBUTIONS
Author contributions: D.W. and S.C.S. conception and design of research; D.W., Y.Y., R.J.C., H.L., P.C.W., B.W., and J.W.-F. performed experiments; D.W., Y.Y., and S.C.S. analyzed data; D.W. and S.C.S. interpreted results of experiments; D.W. prepared figures; D.W. drafted manuscript; T.B. and S.C.S. edited and revised manuscript; S.C.S. approved final version of manuscript.
ACKNOWLEDGMENTS
The authors thank Dr. Tong Wang (Yale University School of Medicine) and Dr. Volker Vallon (University of California-San Diego School of Medicine) for advice and help with the micropuncture experiments. The authors appreciate the assistance of Dr. Channabasavai Gurumurthy and the Transgenic Core Facility at the University of Nebraska Medical Center for the help and advice in generating the knockout animals on the C57BL/6 background.
REFERENCES
- 1.Abuladze N, Pushkin A, Tatishchev S, Newman D, Sassani P, Kurtz I. Expression and localization of rat NBC4c in liver and renal uroepithelium. Am J Physiol Cell Physiol 287: C781–C789, 2004. [DOI] [PubMed] [Google Scholar]
- 2.Barkley RA, Chakravarti A, Cooper RS, Ellison RC, Hunt SC, Province MA, Turner ST, Weder AB, Boerwinkle E. Positional identification of hypertension susceptibility genes on chromosome 2. Hypertension 43: 477–482, 2004. [DOI] [PubMed] [Google Scholar]
- 3.Blomqvist SR, Vidarsson H, Fitzgerald S, Johansson BR, Ollerstam A, Brown R, Persson AE, Bergstrom GG, Enerback S. Distal renal tubular acidosis in mice that lack the forkhead transcription factor Foxi1. J Clin Invest 113: 1560–1570, 2004. [DOI] [PMC free article] [PubMed] [Google Scholar]
- 4.Boettger T, Hubner CA, Maier H, Rust MB, Beck FX, Jentsch TJ. Deafness and renal tubular acidosis in mice lacking the K-Cl co-transporter Kcc4. Nature 416: 874–878, 2002. [DOI] [PubMed] [Google Scholar]
- 5.Boros S, Bindels RJ, Hoenderop JG. Active Ca2+ reabsorption in the connecting tubule. Pflügers Arch 458: 99–109, 2009. [DOI] [PubMed] [Google Scholar]
- 6.Capasso G, Geibel PJ, Damiano S, Jaeger P, Richards WG, Geibel JP. The calcium sensing receptor modulates fluid reabsorption and acid secretion in the proximal tubule. Kidney Int 84: 277–84, 2013. [DOI] [PubMed] [Google Scholar]
- 7.Carey RM, Schoeffel CD, Gildea JJ, Jones JE, McGrath HE, Gordon LN, Park MJ, Sobota RS, Underwood PC, Williams J, Sun B, Raby B, Lasky-Su J, Hopkins PN, Adler GK, Williams SM, Jose PA, Felder RA. Salt sensitivity of blood pressure is associated with polymorphisms in the sodium-bicarbonate cotransporter. Hypertension 60: 1359–1366, 2012. [DOI] [PMC free article] [PubMed] [Google Scholar]
- 8.Chan JC. The rapid determination of urinary titratable acid and ammonium and evaluation of freezing as a method of preservation. Clin Biochem 5: 94–98, 1972. [DOI] [PubMed] [Google Scholar]
- 9.Chang MH, DiPiero J, Sönnichsen FD, Romero MF. Entry to “formula tunnel” revealed by SLC4A4 human mutation and structural model. J Biol Chem 283: 18402–10, 2008. [DOI] [PMC free article] [PubMed] [Google Scholar]
- 10.Cordat E, Reithmeier RA. Structure, function, and trafficking of SLC4 and SLC26 anion transporters. Curr Top Membr 73: 1–67, 2014. [DOI] [PubMed] [Google Scholar]
- 11.Damkier HH, Nielsen S, Praetorius J. Molecular expression of SLC4-derived Na+-dependent anion transporters in selected human tissues. Am J Physiol Regul Integr Comp Physiol 293: R2136–R2146, 2007. [DOI] [PubMed] [Google Scholar]
- 12.Finberg KE, Wagner CA, Bailey MA, Paunescu TG, Breton S, Brown D, Giebisch G, Geibel JP, Lifton RP. The B1-subunit of the H+ ATPase is required for maximal urinary acidification. Proc Natl Acad Sci USA 102: 13616–13621, 2005. [DOI] [PMC free article] [PubMed] [Google Scholar]
- 13.Geibel JP. Distal tubule acidification. J Nephrol 19, Suppl 9: S18–S26, 2006. [PubMed] [Google Scholar]
- 14.Giebisch G, Krapf R, Wagner C. Renal and extrarenal regulation of potassium. Kidney Int 72: 397–410, 2007. [DOI] [PubMed] [Google Scholar]
- 15.Groger N, Vitzthum H, Frohlich H, Kruger M, Ehmke H, Braun T, Boettger T. Targeted mutation of SLC4A5 induces arterial hypertension and renal metabolic acidosis. Hum Mol Genet 21: 1025–1036, 2012. [DOI] [PubMed] [Google Scholar]
- 16.Gueutin V, Vallet M, Jayat M, Peti-Peterdi J, Cornière N, Leviel F, Sohet F, Wagner CA, Eladari D, Chambrey R. Renal β-intercalated cells maintain body fluid and electrolyte balance. J Clin Invest 123: 4219–31, 2013. [DOI] [PMC free article] [PubMed] [Google Scholar]
- 17.Hennings JC, Picard N, Huebner AK, Stauber T, Maier H, Brown D, Jentsch TJ, Vargas-Poussou R, Eladari D, Hübner CA. A mouse model for distal renal tubular acidosis reveals a previously unrecognized role of the V-ATPase a4 subunit in the proximal tubule. EMBO Mol Med 4: 1057–71, 2012. [DOI] [PMC free article] [PubMed] [Google Scholar]
- 18.Hunt SC, Xin Y, Wu LL, Cawthon RM, Coon H, Hasstedt SJ, Hopkins PN. Sodium bicarbonate cotransporter polymorphisms are associated with baseline and 10-year follow-up blood pressures. Hypertension 47: 532–536, 2006. [DOI] [PubMed] [Google Scholar]
- 19.Imai M, Nakamura R. Function of distal convoluted and connecting tubules studied by isolated nephron fragments. Kidney Int 22: 465–472, 1982. [DOI] [PubMed] [Google Scholar]
- 20.Kao L, Kurtz LM, Shao X, Papadopoulos MC, Liu L, Bok D, Nusinowitz S, Chen B, Stella SL, Andre M, Weinreb J, Luong SS, Piri N, Kwong JM, Newman D, Kurtz I. Severe neurologic impairment in mice with targeted disruption of the electrogenic sodium bicarbonate cotransporter NBCe2 (Slc4a5 gene). J Biol Chem 286: 32563–32574, 2011. [DOI] [PMC free article] [PubMed] [Google Scholar]
- 21.Karet FE, Finberg KE, Nelson RD, Nayir A, Mocan H, Sanjad SA, Rodriguez-Soriano J, Santos F, Cremers CW, di PA, Hoffbrand BI, Winiarski J, Bakkaloglu A, Ozen S, Dusunsel R, Goodyer P, Hulton SA, Wu DK, Skvorak AB, Morton CC, Cunningham MJ, Jha V, Lifton RP. Mutations in the gene encoding B1 subunit of H+-ATPase cause renal tubular acidosis with sensorineural deafness. Nat Genet 21: 84–90, 1999. [DOI] [PubMed] [Google Scholar]
- 22.Karet FE, Gainza FJ, Gyory AZ, Unwin RJ, Wrong O, Tanner MJ, Nayir A, Alpay H, Santos F, Hulton SA, Bakkaloglu A, Ozen S, Cunningham MJ, di PA, Walker WG, Lifton RP. Mutations in the chloride-bicarbonate exchanger gene AE1 cause autosomal dominant but not autosomal recessive distal renal tubular acidosis. Proc Natl Acad Sci USA 95: 6337–6342, 1998. [DOI] [PMC free article] [PubMed] [Google Scholar]
- 23.Khanna A, Simoni J, Wesson DE. Endothelin-induced increased aldosterone activity mediates augmented distal nephron acidification as a result of dietary protein. J Am Soc Nephrol 16: 1929–1935, 2005. [DOI] [PubMed] [Google Scholar]
- 24.Kim J, Kim YH, Cha JH, Tisher CC, Madsen KM. Intercalated cell subtypes in connecting tubule and cortical collecting duct of rat and mouse. J Am Soc Nephrol 10: 1–12, 1999. [DOI] [PubMed] [Google Scholar]
- 25.Lin G, Ren H, Chen X, Di X. Computer-assisted 3D reconstruction of mouse connecting tubule. J China Med Univ 39: 401–403, 2010. [Google Scholar]
- 26.Lin SH, Cheema-Dhadli S, Chayaraks S, Chen CB, Gowrishankar M, Halperin ML. Physiological disposal of the potential alkali load in diet of the rat: steps to achieve acid-base balance. Am J Physiol Renal Physiol 274: F1037–F1044, 1998. [DOI] [PubMed] [Google Scholar]
- 27.Nakhoul NL1, Chen LK, Boron WF. Intracellular pH regulation in rabbit S3 proximal tubule: basolateral Cl-HCO3 exchange and Na-HCO3 cotransport. Am J Physiol Renal Fluid Electrolyte Physiol 258: F371–F381, 1990. [DOI] [PubMed] [Google Scholar]
- 28.Nakhoul NL, Hamm LL. Vacuolar H+-ATPase in the kidney. J Nephrol 15, Suppl 5: S22–S31, 2002. [PubMed] [Google Scholar]
- 29.Norgett EE, Borthwick KJ, Al-Lamki RS, Su Y, Smith AN, Karet FE. V1 and V0 domains of the human H+-ATPase are linked by an interaction between the G and a subunits. J Biol Chem 282: 14421–14427, 2007. [DOI] [PubMed] [Google Scholar]
- 30.Norgett EE, Golder ZJ, Lorente-Cánovas B, Ingham N, Steel KP, Karet Frankl FE. Atp6v0a4 knockout mouse is a model of distal renal tubular acidosis with hearing loss, with additional extrarenal phenotype. Proc Natl Acad Sci USA 109: 13775–13780, 2012. [DOI] [PMC free article] [PubMed] [Google Scholar]
- 31.Odgaard E, Jakobsen JK, Frische S, Praetorius J, Nielsen S, Aalkjaer C, Leipziger J. Basolateral Na+-dependent transporter NBCn1-mediated HCO3− influx in rat medullary thick ascending limb. J Physiol 555: 205–218, 2004. [DOI] [PMC free article] [PubMed] [Google Scholar]
- 32.Parker MD, Boron WF. The divergence, actions, roles, and relatives of sodium-coupled bicarbonate transporters. Physiol Rev 93: 803–959, 2013. [DOI] [PMC free article] [PubMed] [Google Scholar]
- 33.Remer T, Manz F. Estimation of the renal net acid excretion by adults consuming diets containing variable amounts of protein. Am J Clin Nutr 59: 1356–1361, 1994. [DOI] [PubMed] [Google Scholar]
- 34.Romero MF, Chen AP, Parker MD, Boron WF. The SLC4 family of bicarbonate (HCO3−) transporters. Mol Aspects Med 34: 159–182, 2013. [DOI] [PMC free article] [PubMed] [Google Scholar]
- 35.Sassani P, Pushkin A, Gross E, Gomer A, Abuladze N, Dukkipati R, Carpenito G, Kurtz I. Functional characterization of NBC4: a new electrogenic sodium-bicarbonate cotransporter. Am J Physiol Cell Physiol 282: C408–C416, 2002. [DOI] [PubMed] [Google Scholar]
- 36.Smith AN, Skaug J, Choate KA, Nayir A, Bakkaloglu A, Ozen S, Hulton SA, Sanjad SA, Al-Sabban EA, Lifton RP, Scherer SW, Karet FE. Mutations in ATP6N1B, encoding a new kidney vacuolar proton pump 116-kD subunit, cause recessive distal renal tubular acidosis with preserved hearing. Nat Genet 26: 71–75, 2000. [DOI] [PubMed] [Google Scholar]
- 37.Stehberger PA, Shmukler BE, Stuart-Tilley AK, Peters LL, Alper SL, Wagner CA. Distal renal tubular acidosis in mice lacking the AE1 (band3) Cl−/HCO3− exchanger (slc4a1). J Am Soc Nephrol 18: 1408–1418, 2007. [DOI] [PubMed] [Google Scholar]
- 38.Teng-umnuay P, Verlander JW, Yuan W, Tisher CC, Madsen KM. Identification of distinct subpopulations of intercalated cells in the mouse collecting duct. J Am Soc Nephrol 7: 260–274, 1996. [DOI] [PubMed] [Google Scholar]
- 39.Vallon V. Micropuncturing the nephron. Pflügers Arch 458: 189–201, 2009. [DOI] [PMC free article] [PubMed] [Google Scholar]
- 40.Virkki LV, Wilson DA, Vaughan-Jones RD, Boron WF. Functional characterization of human NBC4 as an electrogenic Na+-HCO3− cotransporter (NBCe2). Am J Physiol Cell Physiol 282: C1278–C1289, 2002. [DOI] [PubMed] [Google Scholar]
- 41.Wagner CA, Lukewille U, Valles P, Breton S, Brown D, Giebisch GH, Geibel JP. A rapid enzymatic method for the isolation of defined kidney tubule fragments from mouse. Pflügers Arch 446: 623–632, 2003. [DOI] [PubMed] [Google Scholar]
- 42.Wen D, Cornelius RJ, Rivero-Hernandez D, Yuan Y, Li H, Weinstein AM, Sansom SC. Relation between BK-α/β4-mediated potassium secretion and ENaC-mediated sodium reabsorption. Kidney Int 86: 139–145, 2014. [DOI] [PMC free article] [PubMed] [Google Scholar]
- 43.Wen D, Cornelius RJ, Sansom SC. Interacting influence of diuretics and diet on BK channel-regulated K homeostasis. Curr Opin Pharmacol 15: 28–32, 2014. [DOI] [PMC free article] [PubMed] [Google Scholar]
- 44.Wen D, Cornelius RJ, Yuan Y, Sansom SC. Regulation of BK-α expression in the distal nephron by aldosterone and urine pH. Am J Physiol Renal Physiol 305: F463–F476, 2013. [DOI] [PMC free article] [PubMed] [Google Scholar]
- 45.Wen D, Huang X, Zhang M, Zhang L, Chen J, Gu Y, Hao CM. Resveratrol attenuates diabetic nephropathy via modulating angiogenesis. PLos One 8: e82336, 2013. [DOI] [PMC free article] [PubMed] [Google Scholar]
- 46.Wen D, Yuan Y, Warner PC, Wang B, Cornelius RJ, Wang-France J, Li H, Boettger T, Sansom SC. Increased eptithelial sodium channel activity contributes to hypertension caused by Na+-HCO3− cotransporter electrogenic 2 deficicency. Hypertension 66: 68–74, 2015. [DOI] [PMC free article] [PubMed] [Google Scholar]
- 47.Xu J, Wang Z, Barone S, Petrovic M, Amlal H, Conforti L, Petrovic S, Soleimani M. Expression of the Na+-HCO3− cotransporter NBC4 in rat kidney and characterization of a novel NBC4 variant. Am J Physiol Renal Physiol 284: F41–F50, 2003. [DOI] [PubMed] [Google Scholar]