

Abstract
The highly anisotropic environment of the lipid bilayer membrane imposes significant constraints on the structures and functions of membrane proteins. However, NMR structure calculations typically use a simple repulsive potential that neglects the effects of solvation and electrostatics, because explicit atomic representation of the solvent and lipid molecules is computationally expensive and impractical for routine NMR-restrained calculations that start from completely extended polypeptide templates. Here, we describe the extension of a previously described implicit solvation potential, eefxPot, to include a membrane model for NMR-restrained calculations of membrane protein structures in XPLOR-NIH. The key components of eefxPot are an energy term for solvation free energy that works together with other nonbonded energy functions, a dedicated force field for conformational and nonbonded protein interaction parameters, and a membrane function that modulates the solvation free energy and dielectric screening as a function of the atomic distance from the membrane center, relative to the membrane thickness. Initial results obtained for membrane proteins with structures determined experimentally in lipid bilayer membranes show that eefxPot affords significant improvements in structural quality, accuracy, and precision. Calculations with eefxPot are straightforward to implement and can be used to both fold and refine structures, as well as to run unrestrained molecular-dynamics simulations. The potential is entirely compatible with the full range of experimental restraints measured by various techniques. Overall, it provides a useful and practical way to calculate membrane protein structures in a physically realistic environment.
Introduction
The functions and structures of proteins are coupled to the physical and chemical properties of their environment. Although NMR spectroscopy is very well suited for studying protein structure and dynamics in samples that resemble their functional settings (1,2), NMR-restrained structure calculations are typically performed with an energy function in which all nonbonded interactions are represented by a single, purely repulsive term, with no contributions from van der Waals attraction, electrostatics, or solvation energy. This simplified potential facilitates simulated annealing with restrained molecular-dynamics (MD) structure calculations from fully extended templates (3,4), but it can also lead to structures with suboptimal quality parameters, such as poor packing, unsatisfied hydrogen-bond donors or acceptors, and unbalanced salt bridges. Furthermore, although this model can provide a simplified representation of the isotropic aqueous environment surrounding soluble proteins, it does not adequately represent the heterogeneous and anisotropic lipid bilayer environment of membrane proteins, especially in cases where the protein possesses both hydrophobic membrane-embedded domains and hydrophilic water-soluble domains.
To alleviate this problem, NMR structure calculations of membrane proteins have been performed with geometric restraining terms, such as harmonic coordinate restraints (5) or plane distance restraints (6), to impose artificial membrane-water interface boundaries, or with an empirical potential based on the preferred membrane insertion depth of each amino acid (7). However, these approaches do not provide a physical representation of the water-membrane environment. Performing structure refinement in a force field with full atomic representation of the water and lipid molecules yields high-quality structures of membrane proteins and provides information about protein-lipid and protein-solvent interactions (8–11). However, this approach is computationally expensive and feasible only for the very final refinement stages of structure calculations but impractical for routine NMR applications. Force fields where solvent effects are treated implicitly (12–16) have been used with NMR structure refinement of membrane proteins (17–19), but they have not been widely implemented as integral parts of protocols to calculate NMR structure from unfolded templates.
Recently, we developed the implicit solvent potential eefxPot (20) for NMR-restrained structure calculations of water-soluble proteins in the program XPLOR-NIH (21,22). This potential can be easily implemented in standard NMR-restrained simulated annealing protocols for both protein folding and refinement. It yields significant improvements in structural quality, accuracy, and precision, and is very effective at guiding structure calculations even in the absence of large numbers of restraints.
Here, we describe the extension of eefxPot to include both water and membrane solvation for NMR-restrained structure calculations of membrane proteins. The extended potential is based on the effective energy function (EEF) (23) and implicit membrane model (IMM) (24) developed for the implicit treatment of water and membranes during MD simulations in CHARMM (25,26). We show that eefxPot provides a physically realistic environmental restraint and that membrane protein structures calculated with eefxPot have higher quality, accuracy, and precision. The potential is ideally suited for experimental restraints measured in lipid bilayer membranes, but can also be used with restraints measured in micelles. The combined potential, available with the XPLOR-NIH package, provides access to both water-soluble and membrane-embedded proteins.
Materials and Methods
Description of eefxPot
The XPLOR-NIH energy function (ETOTAL) is composed of an experimental restraining energy term (EEXP) that includes the widely used potentials for distance, dipolar coupling (DC), chemical shift anisotropy (CSA), and dihedral-angle restraints (21,22), a knowledge-based restraining term based on additional information about the system (EKNOW), and conformational and nonbonded terms that collectively describe the energy of the molecular system (ESYS) (21,22,25–27):
| (1) |
The conformational energy component of ESYS includes terms for covalent bonds (EBON), covalent bond angles (EANG), improper dihedral angles (EIMP), and proper dihedral angles represented by empirical values (EDIHE) or by statistical torsion-angle potentials such as torsionDB or Rama (28,29). The nonbonded energy component of ESYS can be represented either by a simple repulsive potential, implemented with the REPEL form of the XPLOR van der Waals function (EREPEL) (27), or by the potential eefxPot (EEEF) (20), which comprises terms for Lennard-Jones van der Waals energy (EVDW), including both repulsive and attractive forces, electrostatic energy (EELEC), and solvation free energy (ESLV).
Whereas the previous version of eefxPot (XPLOR-NIH version 2.36) was limited to bulk water solvation, the new version includes membrane-water solvation. Furthermore, whereas the previous version of eefxPot used XPLOR-encoded terms for EVDW and EELEC, the new version has dedicated functions for EVDW and EELEC, in addition to ESLV. This development was needed to enable 1) implementation of a modified form of EELEC that reflects the stronger electrostatic interactions present in the membrane interior, and 2) synchronization of the nonbonded atom list, generated using the ATOM or GROUp options of XPLOR, to ensure that all three energy terms of eefxPot share a single set of nonbonded atoms during the calculation. This revision has the added benefits of increasing the calculation speed and facilitating control of the potential with standard Python scripts.
The eefxPot function uses dedicated protein topology and parameter files (protein_eef.par and protein_eef.top) that contain the chemical information for the conformational and nonbonded energy terms of specific residue and atom types. These files are based on the CHARMM22 (25,26), PARALLHDG5.3 (30,31), and OPLS (32) force fields. They were generated by making the following modifications to the amino acid parameters of PARALLHDG5.3: 1) atom groupings were redefined to be those of CHARMM22; 2) partial atomic charges for nonionic residues were replaced with CHARMM22 partial charges; and 3) partial atomic charges for ionic residues (Arg, Lys, Asp, Glu, and termini) were replaced with those of CHARMM EEF1-IMM1 (23). The force field retains the full set of dihedral-angle parameters defined in PARALLHDG5.3, thus enabling eefxPot structure calculations to be performed with the XPLOR EDIHE energy function instead of a statistical torsion-angle potential, if desired.
The potential is coded in the C++ base framework of XPLOR-NIH and is accessible from the Python interface of the program by calling eefxPot and its accessory module eefxPotTools, which encodes the relevant solvation parameters. It is available in the latest release of XPLOR-NIH (version 2.39), downloadable from the web (http://nmr.cit.nih.gov/xplor-nih/).
Functional forms of the eefxPot energy terms
Detailed derivations of the EEF and IMM energy terms have been described previously (23,24). The three energy terms of eefxPot (EVDW, EELEC, and ESLV) are implemented together, with a switching function (SW) that is effective between 7 Å and 9 Å; since all nonbonded interactions beyond this range are neglected, the computational cost is reduced significantly. The new dedicated functions for EVDW and EELEC have the same forms as the switched van der Waals and electrostatic energy functions of XPLOR. EVDW depends on the values specified in the parameter file for interatomic distance (R), van der Waals radius (σ), and Lennard-Jones well depth (ε):
| (2) |
EELEC is computed from Coulomb’s constant (C) and the atomic charges (Q) that are specified in the topology file, and ionic side chains are neutralized to simplify the treatment of electrostatic interactions:
| (3) |
where εr is the dielectric constant, or permittivity of the solvent environment relative to vacuum. Screening of partial charges by the solvent is approximated by replacing εr with the expression εrRij in Eq. 3 and setting the value of εr equal to one, as in the XPLOR distance-dependent dielectric model RDIE (27).
ESLV is defined as the sum of the solvation free-energy contributions from all i atomic groups in the protein, each described as the solvation free energy of group i in its fully solvated state (ΔGiref) minus the reduction in solvation due to the presence of surrounding groups j, with van der Waals volume Vj and within distance Rij:
| (4) |
The values of ΔGiref for atomic groups in the bulk aqueous phase of eefxPot are specified in eefxPotTools. They are taken from experimental data for the solvation of small model molecules in water, with the values for hydrogen atoms set to zero.
Extension of eefxPot to membrane solvation required 1) introduction of a function that models the anisotropic membrane environment, 2) additional parametrization of ESLV with data for the solvation free-energy change associated with the transfer from water to a hydrophobic environment, and 3) modification of EELEC to account for the stronger electrostatic interactions, or weaker screening of partial charges, in the hydrophobic membrane interior, as previously described for the CHARMM version of the energy function (24).
The membrane is modeled as a function f (z), with the hydrophobic center set at z = 0 and the water-lipid interface parallel to the xy coordinate plane (Fig. 1 A); f (z) describes the transition from polar to hydrophobic environments and depends on the hydrocarbon thickness of the membrane (T) and the exponent (n) that controls the size of the region over which the transition occurs:
| (5) |
The membrane profile function f (z) modulates the solvation and electrostatic parameters of all atoms according to their absolute z distance from the hydrophobic center (z = 0). The ΔGiref solvation parameter of ESLV (Eq. 4) is now given by
| (6) |
where ΔGiref,wat are the solvation free energies for atomic groups in the bulk aqueous phase and ΔGiref,chex are the solvation free energies in the membrane hydrophobic interior, with values taken from experimental data for the distribution of small-molecule analogs of amino acid side chains in cyclohexane. The distance-dependent dielectric model of EELEC (Eq. 3) is modified by f (z) to make the strength of solvent screening dependent on both the interatomic distance and the absolute atomic distance from the membrane center; the value of εr in Eq. 3 is now replaced by the expression with
| (7) |
where fi and fj are given by the membrane profile function (Eq. 5) and the parameter a is a user-defined scaling factor, with 0 ≤ a ≤ 1, that further adjusts the strength of dielectric screening in the membrane.
Figure 1.

Shape of the membrane profile function f (z) that modulates the solvation and electrostatic interactions of eefxPot. Profiles were calculated with T = 2DC and n = 10 (black) or T = DB and n = 7 (gray) using bilayer structure parameters for DMPC at 30°C (78) with DB = 36.3 Å, DHH = 35.3 Å, and 2DC = 25.4 Å. (A) Modulation of the solvation free energy by f (z). (B) Modulation of solvent screening by f (z) and the effect of the parameter a. To see this figure in color, go online.
Far from the membrane hydrocarbon center, where both f (z) and fij are equal to one, ΔGiref corresponds to solvation in bulk water (ΔGiref,wat; Fig. 1 A) and the effective dielectric screening is scaled solely by the interatomic distance (Fig. 1 B). However, at the membrane center where f (z) and fij are equal to zero, ΔGiref corresponds to solvation in cyclohexane (ΔGiref,chex) and the effective dielectric constant is reduced to εr (i.e., the default value of one) for a = 0, but can be scaled up to εrRij for values of a > 0 up to a = 1 (Fig. 1 B). Setting a = 0 has been shown to overestimate the strength of electrostatic interactions inside the membrane, but setting a = 0.85 produces solvation and electrostatic energies that agree well with experimental results (24), as shown in Table S1 in the Supporting Material.
The values of T and n in Eq. 5 are set by the user to reflect the structure of a specific membrane environment. To properly set these parameters, it is worth considering some key structural features of phospholipid bilayers (33–37). The overall lipid bilayer thickness (DB), also known as the Luzzati thickness (33), is readily resolved by neutron-scattering experiments as the region of high contrast between protonated lipid and deuterated water (Fig. 1 A). This parameter defines the Gibbs dividing surface position for water at DB/2, where the water volume probability is 50%. The distance between polar headgroups (DHH), on the other hand, is best resolved by x-ray scattering as the cross-bilayer distance between the peaks of electron density that arise from the lipid phosphate groups. Although the polar headgroup region contains varying amounts of water molecules, the acyl chains that define the hydrocarbon thickness (2DC) are largely free of water. This hydrophobic core delimits the Gibbs dividing surface position for the hydrocarbon region defined by DC. These and other parameters have been measured and analyzed with increasing accuracy for several lipids to provide detailed structural views of membranes.
In this study, we followed Lazaridis’s (24) convention of setting T = 2DC and n = 10 because we deemed it important to compare the performance of eefxPot with that of its CHARMM model counterpart. As illustrated for dimyristoyl-phosphatidylcholine (DMPC), these settings (Fig. 1 A, black) generate an environment at distance z = T/2 = DC, where both solvation and effective screening are 50% like water (f = 0.5), and an environment at distance z = DB/2 that is 100% like bulk water (f = 1). This is very different from the physical situation, where the Gibbs dividing surface position for the hydrocarbon region (DC) has a water volume probability much lower than 50%, and the Gibbs dividing surface position for water (DB/2) has a water volume probability of 50%, not 100%. Therefore, these original settings appear to result in an overall thinning of the membrane, because the bulk water solvation and electrostatic conditions of the model (f = 1) are reached too close to the membrane center, in what should correspond to the headgroup region.
Values of T = DB and n = 7 (Fig. 1 A, gray) adjust the membrane hydration profile to resemble the experimental structure of DMPC bilayers more closely, as they move the Gibbs dividing surface position for water to the experimental value of DB/2. In this case, the headgroup region, defined by (DB/2) − DC, has a membrane profile that ranges from f = 0.5 at DB/2 to f = 0.1 at DC, consistent with the experimentally observed range of water volume probabilities (35–37).
Calibration of the potential
To evaluate the eefxPot energy landscape, we calculated the free energy of membrane insertion (ΔEEEF) for the two 25-residue α-helical polypeptides that were used to calibrate the CHARMM model, Ala25 and Leu25 (24). The resulting free energies (Table S1) match very closely with those reported for CHARMM EEF-IMM and correctly reflect the contribution of the dielectric screening function (Eq. 7). Setting a = 0.85 yields a favorable free energy of insertion for Leu25 (−45.7 kcal/mol) and a slightly unfavorable energy for Ala25 (1.6 kcal/mol). These values are also consistent with experiments showing that polyLeu peptides are good transmembrane helix formers, whereas polyAla peptides are not sufficiently hydrophobic to form stable transmembrane helices (38,39). By contrast, the results obtained with a = 0 overestimate the contribution of EELEC in the membrane and yield highly favorable insertion free energies for both Leu25 and Ala25.
To further explore the eefxPot energy landscape, we mapped ESLV and EELEC for Leu25 as a function of the membrane insertion depth and helix tilt (Fig. S1). The results show that global minima of the combined solvation and electrostatic terms (Fig. S1 C) are reached when Leu25 is inserted across the membrane with its mass center near z = 0, whereas positions farther away from z = 0 are not favored. Furthermore, the energy minima are found at different helix tilt angles that depend on the membrane thickness tested in each case, showing that eefxPot drives the transmembrane helix tilt to match the hydrophobic thickness of the model membrane, as previously reported for CHARMM EEF-IMM (24).
Structure calculations
All calculations were performed with XPLOR-NIH version 2.38 (21,22). The backbone conformations, side chain conformations, and nonbonded atomic interactions of the calculated structures were assessed using the programs WHAT IF (accessible in iCing) (40,41) and MolProbity (42–44). Structures were rendered with PyMol (45). The Ala25 and Leu25 α-helical polypeptides (uniform dihedral angles, Φ = −57°, Ψ = −40°) were generated in UCSF Chimera (46) and then subjected to 500 steps of Powell minimization.
Free MD simulations were performed at 300 K in Cartesian space. The structures were downloaded from the Protein Data Bank (PDB), energy minimized (500 steps of Powell minimization), and subjected to MD simulations with normal atomic masses instead of the uniform mass setup that is routinely used in NMR structure calculation protocols. The membrane thickness T was set to reflect the lipid composition of the experimental sample.
NMR-restrained structure calculations were performed using two simulated annealing protocols: one for folding an initially extended polypeptide conformation, and one for subsequent refinement of a folded model selected from the first folding protocol. For each calculation with REPEL or eefxPot, structure ensembles were generated by selecting the 10 models with the lowest total energy, excluding torsionDB energy.
The magnitude (Da), rhombicity (Rh), and orientation of the alignment tensors used in conjunction with solid-state NMR CSA and DC restraints were held fixed during the folding protocol, with the tensor axis aligned to the z axis of the eefxPot model membrane. This was dictated by the experimental solid-state NMR data, which were measured in samples with uniaxial order specifying Da ≈ 10 kHz, Rh = 0, and the tensor axis parallel to the membrane normal in all test cases. During refinement, the value of Da was allowed to vary while the axis and Rh were held fixed.
The folding and refinement protocols are both based on the internal variable module (IVM) (47) and share the same basic scheme comprising four stages: 1) torsion-angle dynamics at high temperature (3,500 K for folding, 3,000 K for refinement) for a time of 22 ps or 22,000 timesteps (folding protocol) or a time of 10 ps or 10,000 timesteps (refinement protocol); 2) torsion-angle dynamics with simulated annealing, where the temperature is reduced from the initial high-temperature value to 25 K in steps of 12.5 K, for a time of 0.4 ps or 200 timesteps per temperature step (folding protocol), or a time of 0.2 ps or 200 timesteps per temperature step (refinement protocol); 3) 500 steps of Powell torsion-angle minimization; and 4) 500 steps of Powell Cartesian minimization. As the IVM’s MD integrator utilizes a variable-timestep algorithm, one specifies both a total integration time and a maximum number of steps and integration stops when the first of these criteria is reached.
In the high-temperature stage, experimental restraints were applied with force constants of kCDIH = 10 kcal mol–1 rad–2 (dihedral angles), kDIST = 2 kcal mol–1 Å−2 (distances), and kCSA = 0.01 kcal mol–1 ppm−2. In the simulated-annealing stage, kCDIH was set to 200 kcal mol–1 rad–2, kDIST was increased geometrically from 2 to 30 kcal mol–1 Å−2, and kCSA was increased geometrically from 0.01 to 0.1 kcal mol–1 ppm−2. The torsionDB statistical torsion-angle potential (29) was included with a force constant set to ktDB = 0.02 kcal mol–1 in the high-temperature stage and ramped geometrically from 0.02 to 2 kcal mol–1 during simulated annealing.
During the eefxPot folding protocol, the 22 ps high-temperature stage was divided into three parts. This was done to prevent fatal atomic overlap in the early stages of calculations from extended templates. The initial two 3 ps segments of the high-temperature stage were performed using REPEL, first setting only CA-CA atomic interactions active, the van der Waals force constant Crep = 0.004 kcal mol−1 Å−4, and the van der Waals radius scale factor krep = 1.2, and then turning on all atom-atom interactions and setting Crep = 4 kcal mol−1 Å−4 and krep = 0.8. The third 16 ps segment of the high-temperature stage and the subsequent simulated-annealing stage were performed using eefxPot exclusively, with REPEL turned off. During folding with eefxPot, the protein center of mass was positioned at the membrane center (z = 0) before each block of the high-temperature stage.
The timing and force constants of the folding protocol are particularly important for OmpX. In this case, the β-barrel residues alternate between hydrophobic and hydrophilic along each β-strand, and the membrane-spanning structure is not formed by an independent, sequential α-helix, but rather by a three-dimensional barrel structure. Folding of OmpX with eefxPot was accomplished by extending the high-temperature equilibration stage to 32 ps to allow the attractive van der Waals forces to work, and dividing it into three parts to prevent atomic overlap (REPEL folding calculations were also carried out with 32 ps high-temperature dynamics for comparison). Furthermore, the dihedral angles were more strongly imposed with kCDIH set to 100 kcal mol–1 rad–2 at high temperature and 200 kcal mol–1 rad–2 during annealing.
The first 3 ps segment was performed using REPEL with only CA-CA atomic interactions active, the overall scale for the van der Waals term set to 0.004 kcal, Crep = 4 kcal mol−1 Å−4, and krep = 1.2. In the second 3 ps segment with REPEL, all atom-atom interactions were turned on and the scale for the van der Waals term was set to 0.1. The third 26 ps segment of the high-temperature stage and the subsequent simulated-annealing stage were performed without REPEL, using exclusively eefxPot with the scale set to 0.004 at high temperature and then ramped from 0.004 to 1 during simulated annealing.
Results
Unrestrained MD simulations
To assess the ability of eefxPot to sustain protein structure and stabilize a protein’s position relative to the membrane, we performed MD simulations at 300 K for four membrane-associated proteins and examined the deviations of the resulting coordinates from those of the experimentally determined structures. The proteins selected for analysis were the antimicrobial, amphipathic, helical peptide piscidin-3 (psc-3) (48); the transmembrane helix of Vpu (Vpu-TM) from HIV-1 (49); the two transmembrane helices of CrgA (CrgA-TM) from Mycobacterium tuberculosis (50); and the bacterial outer-membrane protein OmpX (51). These proteins range in size from 20 to 150 amino acids and their structures have been determined in detergent-free phospholipid bilayer membranes by NMR spectroscopy, with coordinates and experimental data publicly available in the PDB. They provide useful benchmarks for assessing the performance of eefxPot because they each have distinct conformations that are representative of the most basic structures required to bind or traverse the lipid bilayer membrane: amphipathic α-helix (psc-3), transmembrane α-helix (Vpu-TM and CrgA-TM), and transmembrane β-barrel (OmpX).
For each system, we compared the results of 1 ns MD simulations performed with either eefxPot or a vacuum force field implemented with distance-dependent dielectric screening. In all four cases, both the eefxPot and vacuum simulations were highly stable (Fig. 2, A–D) and maintained the native protein structure for the entire duration of the dynamics, with most of the changes in protein conformation occurring within the first 200–300 ps. However, even though vacuum can provide a good hydrophobic model environment for simulations of membrane proteins (24), it cannot model the membrane-water interface and is not suitable for the water-exposed regions of proteins. Indeed, simulations with eefxPot yielded structures with root mean-square deviations (RMSDs) that were ∼0.3 Å closer to native for all four proteins. Importantly, the membrane-associated positions of the proteins were maintained in the anisotropic environment of eefxPot but were completely lost in isotropic vacuum. Snapshots taken at various intervals during the eefxPot simulations show that all four proteins adopted stable membrane-embedded conformations within the first 200–300 ps of the dynamics (Fig. S2).
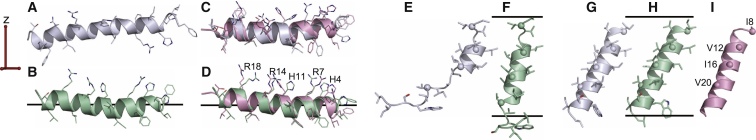
Figure 2.

MD simulations of the experimentally determined structures of psc-3, Vpu-TM, CrgA-TM, and OmpX, performed with eefxPot or vacuum in the absence of experimental restrains. Simulations were performed at 300 K in Cartesian space. Membranes are depicted as horizontal lines separated by thickness T. (A–D) Plots of structural accuracy as a function of MD time with eefxPot (green) or vacuum (blue). Accuracy is reported as the backbone atom (N, CA, and C) RMSD to the experimental structure deposited in the PDB. (E) Structure of psc-3 in DMPC/DMPG-oriented bilayers (48) taken directly from the PDB (2MCW, pink) or after eefxPot simulation in a 25.4 Å membrane (green). (F) Structure of Vpu-TM in DOPC-oriented bilayers (49) taken directly from the PDB (1PI7, pink) or after eefxPot simulation in 28.5 Å or 25.4 Å membranes (green). (G) Structure of CrgA-TM in DOPC-oriented bilayers (50) taken directly from the PDB (2MMU, pink) or after eefxPot simulation in a 26 Å membrane (green). (H) Structure of OmpX in DMPC/DMPG nanodiscs (51) taken directly from the PDB (2M06, pink) or after eefxPot simulation in a 26 Å membrane (green). The crystal structure (57) (1QJ8, red) is shown in the membrane position derived by rigid-body orientation with solid-state NMR restraints (56). To see this figure in color, go online.
The final membrane-associated positions (Fig. 2, E–H) agree very well with those determined experimentally. The amphipathic helix of Psc-3 settled at the membrane surface, with hydrophobic residues embedded in the membrane and polar residues facing the aqueous environment (Fig. 2 E), whereas Vpu-TM, CrgA, and OmpX all adopted membrane-inserted conformations (Fig. 2, F–H) with tilts and rotations similar to the experimental values.
The 10° tilt of Vpu-TM obtained in a T = 28.5 Å model membrane (Fig. 2 F) is similar to the 13° value observed by solid-state NMR (49) in liquid crystalline dioleoyl-phosphatidylcholine (DOPC). The helix rotation, indexed by the positions of Ile-19 and Trp-22, is also very similar. MD simulations of Vpu-TM performed with a T = 25.4 Å model membrane increased the transmembrane helix tilt to 18°, as observed in liquid crystalline DMPC, where Vpu-TM adopted a 27° tilt to match the hydrophobic thickness of the membrane (52,53). Aside from the limitations related to the implicit representation of the lipid bilayer membrane (see below), direct comparison with the experimental data is limited by the presence of additional residues in the experimental Vpu-TM peptide, including a series of C-terminal Lys to enhance solubility, that are likely to influence the transmembrane helix tilt and rotation. Nevertheless, the hydrophobic matching behavior of Vpu-TM was reproduced by eefxPot. Similar simulations performed for Leu25 in membranes of different thickness (Fig. S1 B) yielded results in close agreement with those obtained with CHARMM (24), with small differences (<1°) attributable to the different force fields used in the calculations.
The potential also performed well with the transmembrane domain of CrgA. Starting with the solid-state NMR structure that was recently determined in palmitoyl-oleoyl-phosphatidylcholine (POPC) and palmitoyl-oleoyl-phosphatidylglycerol (POPG) lipid bilayers (50), MD simulation with eefxPot maintained both the protein structure and its membrane position (Fig. 2 G). Importantly, this test also demonstrates that eefxPot is capable of sustaining transmembrane helix-helix packing, a critical mechanism for mediating protein-protein interactions in membranes. A simulation performed with eefxPot for the seven-transmembrane helix protein bacteriorhodopsin further demonstrates this important property (Fig. S2 E). Starting with a high-resolution crystal structure of the protein (54) that includes the well-resolved electron density of several boundary lipids, the potential sustained both the helix bundle topology and the global membrane position during an MD simulation, with a final backbone atom RMSD of 1.2 Å relative to the starting structure.
The overall transmembrane tilt and rotation of the OmpX β-barrel were also reproduced very well (Fig. 2 H). MD simulations with eefxPot starting with the solution NMR structure determined in DMPC and dimyristoyl-phosphatidylglycerol (DMPG) nanodiscs (51) resulted in a 15° barrel tilt and barrel rotation that were both very similar to the tilt and rotation previously determined by protein-lipid nuclear Overhauser effect (NOE) measurements (55). The tilt and rotation also matched those determined by solid-state NMR orientation restraints in a previous study (56) where the transmembrane position was determined by rigid-body orientation of the OmpX crystal structure (57) without protein all-atom refinement; this is sufficient to account for the 8° difference in the reported barrel tilt. Nevertheless, it is noteworthy that the barrel rotation, indexed by the positions of Phe residues in Fig. 2 H, is the same as that obtained with eefxPot. Thus, we conclude that eefxPot sustains membrane-inserted protein structures and reproduces the hydrophobic matching observed for transmembrane polypeptides.
NMR-restrained structure calculations
We next tested eefxPot for its ability to generate high-quality NMR-restrained, membrane-associated structures. We executed NMR-restrained calculations for four proteins: psc-3, Vpu-TM, OmpX, and the membrane-embedded form of the major coat protein from fd bacteriophage (fd), whose structure has been determined by solid-state NMR in POPC/POPG phospholipid bilayers (58). In all cases, the calculations were started from extended structures and performed with standard simulated-annealing protocols, using either the simple repulsive function REPEL with the default XPLOR-NIH protein topology and parameters, or eefxPot with its dedicated protein topology and parameters. Notably, CPU usage of the full eefxPot potential (including EVDW, EELEC, and ESLV terms) was competitive with the simple repulsive quartic REPEL term.
The original structures of the four proteins deposited in the PDB were determined with relatively limited experimental data, including bond orientation restraints derived from solid-state NMR 1H-15N DC and 15N CSA, amide backbone distance restraints obtained from solution NMR 1H-1H NOE measurements, and backbone dihedral-angle restraints derived from prior knowledge of α-helical secondary structures or from solution NMR isotropic chemical shift (CS) frequencies (48,51,52,58). Here, to test the performance of eefxPot, we used all data available for each protein, except for DCs, which were used only for cross-validation and not as restraints during simulated annealing.
DCs and CSAs depend on the orientation of interatomic vectors relative to the external magnetic field, and their exclusion from structure calculation provides a critical, independent test of structural accuracy (59,60). For the four proteins in this study, these parameters were measured in uniaxially oriented lipid bilayer samples and thus also serve as accurate global positioning restraints for each protein in the membrane. In contrast to interatomic distances or dihedral angles, orientation restraints are measured relative to a protein-external reference frame, independently of other atomic positions. This has the important advantage that each measurement can contribute equally and independently to the structure calculation, while structural distortions due to errors associated with an individual measurement remain localized to the specific site without distorting other regions of the protein.
The introduction of an additional term in the target energy function will frequently worsen the agreement between the calculated structures and other experimental and conformational energy terms. However, eefxPot yielded improvements in both accuracy and precision for all four proteins, without sacrificing agreement with either conformational or experimental restraint terms. Notably, all structures calculated with eefxPot have better agreement with the experimental 1H-15N DC data (Fig. 3 A), which were purposely excluded from the structure calculations. This reflects improvements in both their structural accuracy and the accuracy of their global membrane-integrated position. Furthermore, in all cases, the structures calculated with eefxPot have significantly higher precision (Fig. 3 B) and better agreement with dihedral-angle restraints (Fig. 3 C) than those obtained with REPEL.
Figure 3.
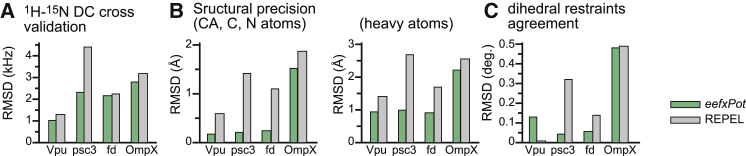
Structural statistics for NMR-restrained calculations. Bars represent results obtained with eefxPot (green) or REPEL (gray). (A) Agreement between structures and experimental DC restraints that were excluded from structure calculations. (B) Structural precision evaluated as the average pairwise RMSD of backbone (CA, C, and N) atoms or all heavy atoms. (C) Agreement between the structures and experimental dihedral-angle restraints used in the structure calculations. To see this figure in color, go online.
We also examined the conformational quality of the structures (Fig. 4) using WHAT IF (40) and MolProbity (43,44). In every case, eefxPot caused the favored regions of the Ramachandran plot to become more populated and the number of Ramachandran outliers to drop significantly. With regard to side chain conformation, WHAT IF and MolProbity indicate that both eefxPot and REPEL produce acceptable χ1/χ2 rotamer normality scores, with WHAT IF favoring eefxPot and MolProbity favoring REPEL. This is not surprising, since both sets of calculations were performed with torsionDB (29), which tends to have the greatest influence on side chain conformations that were not otherwise restrained.
Figure 4.

WHAT IF and MolProbity validation metrics of the NMR-restrained structures. Bars represent results obtained with eefxPot (green) or REPEL (gray). (A) WHAT IF validation statistics for Ramachandran plot appearance, backbone conformation, χ1/χ2 torsion angles, and protein packing quality. (B) MolProbity validation statistics for percent of residues in favored regions of the Ramachandran plot, percent of residues in disfavored regions of the Ramachandran plot, percent of residues with poor side chain torsion angles, clashscore, and overall MolProbity score. The MolProbity clashscore and MolProbity score are costs (the lower the better). To see this figure in color, go online.
The validation analyses further show that eefxPot improves the quality of both protein conformation and nonbonded atomic interactions. The WHAT IF packing quality (the atomic distributions around different molecular fragments) (61) and the MolProbity clashscore (the number of serious atomic overlaps per thousand atoms) (62) provide database-independent estimates of the quality of nonbonded atomic interactions or atomic packing. Notably, all four structures generated with eefxPot show marked improvements in these key metrics. This is also reflected in the overall MolProbity score (43,44) (the lower the better), which typically improves with eefxPot.
Previously, we showed that eefxPot directs structure calculations of soluble proteins toward their native structures, even in the absence of large numbers of restraints (20). This property correlates with the burial of solvent-accessible protein groups, formation of hydrogen bonds, and optimization of the radius of gyration by eefxPot. Here, we further examined the ability of eefxPot to produce folded-membrane-associated structures of membrane proteins with limited numbers of restraints.
Structures of Psc-3 were calculated using data sets that included only CSA and loosely implemented (±30°) ideal helix dihedral angles, but excluded DC restraints. Although REPEL yields highly distorted pseudo-helical structures after the first folding stage of the protocol (Fig. 5 A), eefxPot yields regular α-helical structures that associate with the membrane surface in the correct orientation dictated by helix amphiphilic polarity (Fig. 5 B). Subsequent refinement of these initial folds yields proper helical structures with either REPEL or eefxPot (Fig. 5, C and D). However, the eefxPot structure has better accuracy, precision, and structural quality metrics compared with that obtained by REPEL (Figs. 3 and 4).
Figure 5.
NMR-restrained structures of psc-3 and Vpu-TM. Structures were calculated using eefxPot (green) or REPEL (gray), or taken from the PDB (pink). Membranes are depicted as horizontal lines separated by membrane thickness T = 25.4 Å. The alignment tensor (red) derived from the experimental solid-state NMR restraints has the z axis aligned parallel to the membrane normal. (A–D) Structures of psc-3 folded from an extended template (A and B) and then refined (C and D) using backbone dihedral-angle and 15N CSA restraints, or taken from the PDB (2MCW) (48). (E–H) Structures of Vpu-TM folded from an extended template using only 15N CSA restraints without backbone dihedral angles (E and F), or folded from an extended template and then refined using backbone dihedral angles and 15N CSA restraints (G and H). (I) Solid-state NMR structure of Vpu-TM (52) taken from the PDB (2GOF). To see this figure in color, go online.
The influence of eefxPot in guiding protein folding is seen even more dramatically in the case of Vpu-TM (Fig. 5, E–H). When folding from an extended template was attempted under the sole influence of 15N CSA restraints, without input from either dihedral angles or 1H-15N DCs, REPEL gave a highly unfolded structure with only a slight helical semblance (Fig. 5 E), whereas eefxPot promoted the formation of a well-defined helix, correctly embedded in the membrane (Fig. 5 F). When both 15N CSA and dihedral restraints were employed, both REPEL and eefxPot resulted in transmembrane helical conformations with tilt and rotation consistent with both the PDB structure and the experimental 15N CSA data (Fig. 5, G and H). Nevertheless, the eefxPot structure of Vpu-TM has better accuracy, precision, and quality, as evidenced by all evaluated metrics (Figs. 3 and 4).
The fd coat protein has been studied extensively by MD simulations in all-atom as well as implicit membrane force fields (63,64) and thus provides a useful benchmark for testing the performance of eefxPot. In one of the first examples of protein structure determination by solid-state NMR (58), the conformation of membrane-inserted fd coat protein was calculated by converting experimental solid-state NMR 15N CSA and 1H-15N DC frequencies into backbone dihedral angles, without including the side chains, without refinement by simulated annealing, and without computationally accounting for environmental effects.
The structures folded from an extended template and refined with either REPEL or eefxPot both have the same L-shaped conformation as the PDB structure (Fig. 6, A and B), with the N-terminal helix parallel to the membrane surface and the C-terminal helix traversing the membrane. In both cases, the helix tilts and rotations are established by the solid-state NMR 15N CSA restraints and cross-validated by the experimental 1H-15N DC values, which were excluded from the calculations. The eefxPot structure (Fig. 6 B), however, contains additional information about the global position of the protein in the membrane, including helix tilt, helix rotation, and the depth of membrane insertion; these properties are consistent with the results from ensemble-dynamics (ED) simulations (Fig. 6 E) performed in an all-atom water-lipid force field (64).
Figure 6.

NMR-restrained structures of fd coat protein and OmpX. Structures were calculated using eefxPot (green) or REPEL (gray), or taken from the PDB (pink). The eefxPot membrane is depicted as horizontal lines separated by the membrane thickness T. The alignment tensor (red) derived from solid-state NMR CSA restraints has the z axis aligned parallel to the membrane normal. Each ensemble is aligned to its lowest-energy structure. (A–D) Side and top views of ensembles of the 10 lowest-energy structures calculated for fd coat protein with dihedral angles and solid-state NMR 15N CSA restraints. (E) Snapshot of a structure obtained previously (64) from ED simulations of fd coat protein in all-atom lipid bilayers; lipid phosphate atoms (orange spheres) mark the membrane-water interface. (F) PDB (1MZT) structure of the fd coat protein determined with solid-state NMR CSA and DC restraints without refinement (58). (G–I) Ensembles of the 10 lowest-energy structures calculated for OmpX using solution NMR amide hydrogen distances and dihedral angles, with (G and H) or without (I) solid-state NMR 15N CSA restraints for Phe residues. The PDB structure of OmpX (2M06, pink) was determined in nanodiscs by solution NMR (51). To see this figure in color, go online.
As seen in the ED structure, the basic and acidic side chains point to the aqueous phase, while hydrophobic side chains are stabilized in the membrane interior and the N- and C-termini are water exposed. By contrast, the REPEL structure has no such side chain discrimination and its N- and C-termini are free to adopt conformations that would place them inside the membrane. Furthermore, the backbone hydrogen bonds in the eefxPot structure are, on average, shorter by 0.09 Å than those in the REPEL structure. This is a characteristic property of membrane proteins that reflects the lower dielectric screening and stronger electrostatic interactions present in the membrane interior (2).
As observed for psc-3 and Vpu-TM, the fd coat protein structures from eefxPot have visibly higher backbone and side chain precision than those obtained with REPEL. Importantly, since these structures also have better DC cross-validation, their higher precision correlates with higher accuracy. The direction of the N-terminal helix is more precisely defined with eefxPot (Fig. 6 D) than with REPEL (Fig. 6 C), even though the turn (Thr-19-Ile-22) was only loosely restrained (±90° dihedral angles) and both the REPEL and eefxPot structures were calculated with separate CSA alignment tensors for the N-terminal and transmembrane helices, to allow for potentially different dynamics at the membrane surface. Both tensors had axial symmetry (Rh = 0) and identical orientations, with the principal axis parallel to the z membrane axis, but were allowed to adopt different values of the magnitude during refinement. This resulted in a different order parameter (S) for each of the two protein segments: higher for the transmembrane helix (S ≈ 1) and lower for the more dynamic N-terminal helix (S ≈ 0.9).
Finally, we examined the ability of eefxPot to calculate a transmembrane β-barrel. The eight-stranded β-barrel of OmpX has been determined by x-ray crystallography (57), by solution NMR with the protein in micelles (51,65), and more recently by solution NMR with the protein in DMPC/DMPG lipid bilayer nanodiscs (51). In addition, we previously measured solid-state NMR 1H/15N CSA and DC restraints for the seven Phe residues of OmpX in planar-oriented DMPC bilayers (56). MD simulations, infrared spectroscopy, NMR, and analyses with empirical potentials of amino acid membrane insertion all show that β-barrel membrane proteins can adopt tilted transmembrane orientations dictated by their structure and the thickness of the lipid bilayer membrane (55,56,66–71).
Structures of OmpX (Fig. 6, G–I) were calculated using the solution NMR amide backbone NOE distances and dihedral angles measured in nanodiscs (51) and the solid-state NMR 15N CSAs measured in oriented bilayers (56), while the solid-state NMR 1H-15N DCs were used only for cross-validation. The structure obtained with eefxPot (Fig. 6 H) has not only higher precision but also better 1H-15N DC cross-validation (Fig. 3 A), and hence higher accuracy. Furthermore, while some extracellular loops fold back against the barrel body in the REPEL structure (Fig. 6 G), these nonsensical conformations are not observed with eefxPot, where they are guided into the bulk water and away from the hydrophobic membrane interior.
To further examine the influence of eefxPot on the transmembrane tilt and rotation of the β-barrel, we also performed an eefxPot calculation of OmpX without either CSA or DC. Even in the absence of any orientation restraints, the barrel adopts a final tilt and rotation (Fig. 6 I) that are consistent with the experimental data, as evidenced by visualizing the positions of the Phe side chains. As noted for the fd coat protein, the backbone hydrogen bonds in the eefxPot structure of OmpX are 0.2 Å shorter than those in the REPEL structure. The difference is even greater for OmpX and may be due to the presence of stronger electrostatic interactions in the membrane combined with better packing of polar residues in the barrel interior.
Discussion
The results show that eefxPot provides an effective anisotropic membrane environment that supports the native structures of membrane proteins. The potential is ideally suited for cases where experimental restraints have been measured in detergent-free lipid bilayer samples, ensuring that the entire structure determination protocol is performed in an environment as close as possible to native. However, eefxPot calculations are also compatible with restraints measured in detergent micelle samples to impose boundaries between hydrophobic and polar environments, establish the proper protein topology, and prevent the water-exposed loops of side chains from folding back against protein regions that are membrane embedded. Further, we note that eefxPot is entirely compatible with the full range of experimental restraints measured by techniques other than NMR spectroscopy.
To make optimal use of this potential, it is also important to note its limitations. The lipid bilayer membrane of eefxPot is modeled implicitly as contiguous layers, each with a discrete solvation free energy and dielectric screening characteristics defined by the membrane profile function, and thus inherits all of the associated limitations. Throughout this study, we used constant values for the membrane thickness taken from the extensive literature on experimental structural studies of lipid bilayer membranes. However, the structural and physical properties of lipid bilayers, including membrane thickness, depend on the lipid composition as well as the temperature and composition of the aqueous phase. An important limitation of an implicit model such as eefxPot is that it cannot account for the effects of these variables on the lipid bilayer environment.
Another important limitation is related to the case of membrane proteins that form water-containing cavities or pores. Since the membrane is modeled implicitly as continuous layers, all residues at a given distance from the membrane center experience the same force field regardless of whether they are exposed to a water-filled cavity or are facing the membrane acyl chains. Lazaridis (72) has proposed a solution to this problem by introducing a function that shapes the model membrane to effectively form a water-filled pore. Implementation of this pore model in eefxPot will have to be tested for proteins with water-filled channels.
The OmpX β-barrel is not water filled. In this case, protein folding in the eefxPot membrane, starting from an extended template, was complicated by the alternating sequence of hydrophobic and hydrophilic amino acids and the need to form a nonsequential three-dimensional structure as the membrane-spanning unit, all in the presence of relatively few experimental restraints. This limitation is not specific to implicit membrane modeling; rather, it is somewhat analogous to the problem in nature, where folding and membrane insertion of β-barrels are assisted by dedicated machinery (73). By extending the high-temperature stage to allow attractive van der Waals forces to work, and imposing dihedral-angle restraints more strongly in the early stages of the protocol, we were able to achieve folding of OmpX in the eefxPot membrane and, once folded, the structure is stably sustained by eefxPot.
As observed for CHARMM IMM (24), eefxPot drives proteins to adopt membrane positions that match the hydrophobic thickness. Adjusting their membrane position is indeed one mechanism by which proteins match their amino acid sequence to the hydrophobic thickness of the surrounding lipids (74). However, hydrophobic matching is also obtained by reciprocal changes in the structure and order of the lipid bilayer (74–76). For example, all-atom ED simulations of the fd coat protein (64) showed that Lys residues near the C-terminus make frequent interactions with the phospholipid polar headgroups, acyl tails, and surrounding water. Lys-40, in particular, is located farther inside the hydrophobic core of the membrane, and the boundary lipids can adjust their positions closer to the membrane center so as to expose the charged side chain to the solvent. This effect is visible in Fig. 6 E, which shows a snapshot taken from those ED simulations. At present, such membrane deformations cannot be modeled by eefxPot, limiting its usefulness in MD simulations performed free of the influence of experimental restraints.
We note, however, that the intended purpose of eefxPot is to assist NMR-restrained structure calculations, where the unbiased force field is not alone in determining membrane-associated position, and experimental restraints play an important role. In this application, the data show that eefxPot does very well in guiding NMR structure calculations toward higher accuracy, precision, and conformational quality. We envision that eefxPot will play a significant role in assisting the initial folding and refinement stages of NMR-restrained structure calculations, and that the resulting structures will represent much improved starting points for subsequent refinement or analysis by MD simulations with all-atom force fields to obtain detailed information about protein-lipid interactions.
We anticipate that eefxPot will be very useful not only for fully integral membrane proteins, but also for proteins that are membrane-anchored and also have water-soluble globular domains that function at the membrane periphery. Many such proteins play critical roles in human biology (e.g., BLC-2 family proteins (77)) but remain relatively underrepresented in the PDB. As more of these proteins become accessible to NMR through the use of nanodisc samples, high magnetic fields, and advanced NMR experiments, calculations with eefxPot can provide significant improvements in structural accuracy, precision, and quality.
Author Contributions
F.M.M., C.D.S., Y.T., and S.J.O. designed the research. Y.T., C.D.S., and F.M.M. performed the research. F.M.M. wrote the manuscript.
Acknowledgments
This research was supported by grants from the National Institutes of Health (R01 GM110658 and P41 EB002031). C.D.S. was supported by funds from the NIH Intramural Research Program of the Center for Information Technology.
Editor: David Cafiso.
Footnotes
Two figures and one table are available at http://www.biophysj.org/biophysj/supplemental/S0006-3495(15)00656-6.
Supporting Material
References
- 1.Banci L., Bertini I., Mori M. NMR in structural proteomics and beyond. Prog. Nucl. Magn. Reson. Spectrosc. 2010;56:247–266. doi: 10.1016/j.pnmrs.2009.12.003. [DOI] [PubMed] [Google Scholar]
- 2.Zhou H.X., Cross T.A. Influences of membrane mimetic environments on membrane protein structures. Annu. Rev. Biophys. 2013;42:361–392. doi: 10.1146/annurev-biophys-083012-130326. [DOI] [PMC free article] [PubMed] [Google Scholar]
- 3.Nilges M., Gronenborn A.M., Clore G.M. Determination of three-dimensional structures of proteins by simulated annealing with interproton distance restraints. Application to crambin, potato carboxypeptidase inhibitor and barley serine proteinase inhibitor 2. Protein Eng. 1988;2:27–38. doi: 10.1093/protein/2.1.27. [DOI] [PubMed] [Google Scholar]
- 4.Clore G.M., Gronenborn A.M. Determination of three-dimensional structures of proteins and nucleic acids in solution by nuclear magnetic resonance spectroscopy. Crit. Rev. Biochem. Mol. Biol. 1989;24:479–564. doi: 10.3109/10409238909086962. [DOI] [PubMed] [Google Scholar]
- 5.Teriete P., Franzin C.M., Marassi F.M. Structure of the Na,K-ATPase regulatory protein FXYD1 in micelles. Biochemistry. 2007;46:6774–6783. doi: 10.1021/bi700391b. [DOI] [PMC free article] [PubMed] [Google Scholar]
- 6.Xu C., Gagnon E., Wucherpfennig K.W. Regulation of T cell receptor activation by dynamic membrane binding of the CD3epsilon cytoplasmic tyrosine-based motif. Cell. 2008;135:702–713. doi: 10.1016/j.cell.2008.09.044. [DOI] [PMC free article] [PubMed] [Google Scholar]
- 7.Shi L., Traaseth N.J., Veglia G. A refinement protocol to determine structure, topology, and depth of insertion of membrane proteins using hybrid solution and solid-state NMR restraints. J. Biomol. NMR. 2009;44:195–205. doi: 10.1007/s10858-009-9328-9. [DOI] [PMC free article] [PubMed] [Google Scholar]
- 8.Dror R.O., Dirks R.M., Shaw D.E. Biomolecular simulation: a computational microscope for molecular biology. Annu. Rev. Biophys. 2012;41:429–452. doi: 10.1146/annurev-biophys-042910-155245. [DOI] [PubMed] [Google Scholar]
- 9.Sharma M., Yi M., Cross T.A. Insight into the mechanism of the influenza A proton channel from a structure in a lipid bilayer. Science. 2010;330:509–512. doi: 10.1126/science.1191750. [DOI] [PMC free article] [PubMed] [Google Scholar]
- 10.Cheng X., Im W. NMR observable-based structure refinement of DAP12-NKG2C activating immunoreceptor complex in explicit membranes. Biophys. J. 2012;102:L27–L29. doi: 10.1016/j.bpj.2012.03.002. [DOI] [PMC free article] [PubMed] [Google Scholar]
- 11.Cheng X., Jo S., Im W. NMR-based simulation studies of Pf1 coat protein in explicit membranes. Biophys. J. 2013;105:691–698. doi: 10.1016/j.bpj.2013.06.040. [DOI] [PMC free article] [PubMed] [Google Scholar]
- 12.Roux B., Simonson T. Implicit solvent models. Biophys. Chem. 1999;78:1–20. doi: 10.1016/s0301-4622(98)00226-9. [DOI] [PubMed] [Google Scholar]
- 13.Feig M., Brooks C.L., 3rd Recent advances in the development and application of implicit solvent models in biomolecule simulations. Curr. Opin. Struct. Biol. 2004;14:217–224. doi: 10.1016/j.sbi.2004.03.009. [DOI] [PubMed] [Google Scholar]
- 14.Baker N.A. Improving implicit solvent simulations: a Poisson-centric view. Curr. Opin. Struct. Biol. 2005;15:137–143. doi: 10.1016/j.sbi.2005.02.001. [DOI] [PubMed] [Google Scholar]
- 15.Chen J., Brooks C.L., 3rd, Khandogin J. Recent advances in implicit solvent-based methods for biomolecular simulations. Curr. Opin. Struct. Biol. 2008;18:140–148. doi: 10.1016/j.sbi.2008.01.003. [DOI] [PMC free article] [PubMed] [Google Scholar]
- 16.Bashford D., Case D.A. Generalized born models of macromolecular solvation effects. Annu. Rev. Phys. Chem. 2000;51:129–152. doi: 10.1146/annurev.physchem.51.1.129. [DOI] [PubMed] [Google Scholar]
- 17.Xia B., Tsui V., Wright P.E. Comparison of protein solution structures refined by molecular dynamics simulation in vacuum, with a generalized Born model, and with explicit water. J. Biomol. NMR. 2002;22:317–331. doi: 10.1023/a:1014929925008. [DOI] [PubMed] [Google Scholar]
- 18.Chen J., Im W., Brooks C.L., 3rd Refinement of NMR structures using implicit solvent and advanced sampling techniques. J. Am. Chem. Soc. 2004;126:16038–16047. doi: 10.1021/ja047624f. [DOI] [PubMed] [Google Scholar]
- 19.Chen J., Won H.S., Brooks C.L., 3rd Generation of native-like protein structures from limited NMR data, modern force fields and advanced conformational sampling. J. Biomol. NMR. 2005;31:59–64. doi: 10.1007/s10858-004-6056-z. [DOI] [PubMed] [Google Scholar]
- 20.Tian Y., Schwieters C.D., Marassi F.M. A practical implicit solvent potential for NMR structure calculation. J. Magn. Reson. 2014;243:54–64. doi: 10.1016/j.jmr.2014.03.011. [DOI] [PMC free article] [PubMed] [Google Scholar]
- 21.Schwieters C.D., Kuszewski J.J., Clore G.M. The Xplor-NIH NMR molecular structure determination package. J. Magn. Reson. 2003;160:65–73. doi: 10.1016/s1090-7807(02)00014-9. [DOI] [PubMed] [Google Scholar]
- 22.Schwieters C.D., Kuszewski J.J., Marius Clore G. Using Xplor-NIH for NMR molecular structure determination. Prog. Nucl. Magn. Reson. Spectrosc. 2006;48:47–62. [Google Scholar]
- 23.Lazaridis T., Karplus M. Effective energy function for proteins in solution. Proteins. 1999;35:133–152. doi: 10.1002/(sici)1097-0134(19990501)35:2<133::aid-prot1>3.0.co;2-n. [DOI] [PubMed] [Google Scholar]
- 24.Lazaridis T. Effective energy function for proteins in lipid membranes. Proteins. 2003;52:176–192. doi: 10.1002/prot.10410. [DOI] [PubMed] [Google Scholar]
- 25.Brooks B.R., Bruccoleri R.E., Karplus M. CHARMM: a program for macromolecular energy, minimization, and dynamics calculations. J. Comput. Chem. 1983;4:187–217. [Google Scholar]
- 26.Brooks B.R., Brooks C.L., 3rd, Karplus M. CHARMM: the biomolecular simulation program. J. Comput. Chem. 2009;30:1545–1614. doi: 10.1002/jcc.21287. [DOI] [PMC free article] [PubMed] [Google Scholar]
- 27.Brünger A.T. Yale University Press; New Haven: 1992. X-PLOR, version 3.1: a system for X-ray crystallography and NMR. [Google Scholar]
- 28.Kuszewski J., Gronenborn A.M., Clore G.M. Improving the quality of NMR and crystallographic protein structures by means of a conformational database potential derived from structure databases. Protein Sci. 1996;5:1067–1080. doi: 10.1002/pro.5560050609. [DOI] [PMC free article] [PubMed] [Google Scholar]
- 29.Bermejo G.A., Clore G.M., Schwieters C.D. Smooth statistical torsion angle potential derived from a large conformational database via adaptive kernel density estimation improves the quality of NMR protein structures. Protein Sci. 2012;21:1824–1836. doi: 10.1002/pro.2163. [DOI] [PMC free article] [PubMed] [Google Scholar]
- 30.Linge J.P., Williams M.A., Nilges M. Refinement of protein structures in explicit solvent. Proteins. 2003;50:496–506. doi: 10.1002/prot.10299. [DOI] [PubMed] [Google Scholar]
- 31.Linge J.P., Nilges M. Influence of non-bonded parameters on the quality of NMR structures: a new force field for NMR structure calculation. J. Biomol. NMR. 1999;13:51–59. doi: 10.1023/a:1008365802830. [DOI] [PubMed] [Google Scholar]
- 32.Jorgensen W.L., Tirado-Rives J. The OPLS [optimized potentials for liquid simulations] potential functions for proteins, energy minimizations for crystals of cyclic peptides and crambin. J. Am. Chem. Soc. 1988;110:1657–1666. doi: 10.1021/ja00214a001. [DOI] [PubMed] [Google Scholar]
- 33.Luzzati V., Husson F. The structure of the liquid-crystalline phasis of lipid-water systems. J. Cell Biol. 1962;12:207–219. doi: 10.1083/jcb.12.2.207. [DOI] [PMC free article] [PubMed] [Google Scholar]
- 34.Marsh D. CRC Press; Boca Raton, FL: 2013. Handbook of Lipid Bilayers. [Google Scholar]
- 35.Nagle J.F., Tristram-Nagle S. Structure of lipid bilayers. Biochim. Biophys. Acta. 2000;1469:159–195. doi: 10.1016/s0304-4157(00)00016-2. [DOI] [PMC free article] [PubMed] [Google Scholar]
- 36.Kučerka N., Nieh M.P., Katsaras J. Fluid phase lipid areas and bilayer thicknesses of commonly used phosphatidylcholines as a function of temperature. Biochim. Biophys. Acta. 2011;1808:2761–2771. doi: 10.1016/j.bbamem.2011.07.022. [DOI] [PubMed] [Google Scholar]
- 37.Nagle J.F. Introductory lecture: basic quantities in model biomembranes. Faraday Discuss. 2013;161:11–29. doi: 10.1039/c2fd20121f. discussion 113–150. [DOI] [PMC free article] [PubMed] [Google Scholar]
- 38.Davis J.H., Clare D.M., Bloom M. Interaction of a synthetic amphiphilic polypeptide and lipids in a bilayer structure. Biochemistry. 1983;22:5298–5305. [Google Scholar]
- 39.Chung L.A., Thompson T.E. Design of membrane-inserting peptides: spectroscopic characterization with and without lipid bilayers. Biochemistry. 1996;35:11343–11354. doi: 10.1021/bi960080c. [DOI] [PubMed] [Google Scholar]
- 40.Vriend G. WHAT IF: a molecular modeling and drug design program. J. Mol. Graph. 1990;8:52–56. doi: 10.1016/0263-7855(90)80070-v. 29. [DOI] [PubMed] [Google Scholar]
- 41.Doreleijers J.F., Sousa da Silva A.W., Vuister G.W. CING: an integrated residue-based structure validation program suite. J. Biomol. NMR. 2012;54:267–283. doi: 10.1007/s10858-012-9669-7. [DOI] [PMC free article] [PubMed] [Google Scholar]
- 42.Lovell S.C., Davis I.W., Richardson D.C. Structure validation by Calpha geometry: phi,psi and Cbeta deviation. Proteins. 2003;50:437–450. doi: 10.1002/prot.10286. [DOI] [PubMed] [Google Scholar]
- 43.Davis I.W., Leaver-Fay A., Richardson D.C. MolProbity: all-atom contacts and structure validation for proteins and nucleic acids. Nucleic Acids Res. 2007;35:W375–W383. doi: 10.1093/nar/gkm216. [DOI] [PMC free article] [PubMed] [Google Scholar]
- 44.Chen V.B., Arendall W.B., 3rd, Richardson D.C. MolProbity: all-atom structure validation for macromolecular crystallography. Acta Crystallogr. D Biol. Crystallogr. 2010;66:12–21. doi: 10.1107/S0907444909042073. [DOI] [PMC free article] [PubMed] [Google Scholar]
- 45.DeLano, W. L. 2005. PyMol. www.pymol.org.
- 46.Pettersen, E. F., T. D. Goddard, …, T. E. Ferrin. UCSF Chimera–a visualization system for exploratory research and analysis. J. Comput. Chem. 25:1605–1612. [DOI] [PubMed]
- 47.Schwieters C.D., Clore G.M. Internal coordinates for molecular dynamics and minimization in structure determination and refinement. J. Magn. Reson. 2001;152:288–302. doi: 10.1006/jmre.2001.2413. [DOI] [PubMed] [Google Scholar]
- 48.Perrin B.S., Jr., Tian Y., Cotten M.L. High-resolution structures and orientations of antimicrobial peptides piscidin 1 and piscidin 3 in fluid bilayers reveal tilting, kinking, and bilayer immersion. J. Am. Chem. Soc. 2014;136:3491–3504. doi: 10.1021/ja411119m. [DOI] [PMC free article] [PubMed] [Google Scholar]
- 49.Park S.H., Mrse A.A., Opella S.J. Three-dimensional structure of the channel-forming trans-membrane domain of virus protein “u” (Vpu) from HIV-1. J. Mol. Biol. 2003;333:409–424. doi: 10.1016/j.jmb.2003.08.048. [DOI] [PubMed] [Google Scholar]
- 50.Das N., Dai J., Cross T.A. Structure of CrgA, a cell division structural and regulatory protein from Mycobacterium tuberculosis, in lipid bilayers. Proc. Natl. Acad. Sci. USA. 2015;112:E119–E126. doi: 10.1073/pnas.1415908112. [DOI] [PMC free article] [PubMed] [Google Scholar]
- 51.Hagn F., Etzkorn M., Wagner G. Optimized phospholipid bilayer nanodiscs facilitate high-resolution structure determination of membrane proteins. J. Am. Chem. Soc. 2013;135:1919–1925. doi: 10.1021/ja310901f. [DOI] [PMC free article] [PubMed] [Google Scholar]
- 52.Park S.H., De Angelis A.A., Opella S.J. Three-dimensional structure of the transmembrane domain of Vpu from HIV-1 in aligned phospholipid bicelles. Biophys. J. 2006;91:3032–3042. doi: 10.1529/biophysj.106.087106. [DOI] [PMC free article] [PubMed] [Google Scholar]
- 53.Park S.H., Opella S.J. Tilt angle of a trans-membrane helix is determined by hydrophobic mismatch. J. Mol. Biol. 2005;350:310–318. doi: 10.1016/j.jmb.2005.05.004. [DOI] [PubMed] [Google Scholar]
- 54.Schobert B., Cupp-Vickery J., Lanyi J. Crystallographic structure of the K intermediate of bacteriorhodopsin: conservation of free energy after photoisomerization of the retinal. J. Mol. Biol. 2002;321:715–726. doi: 10.1016/s0022-2836(02)00681-2. [DOI] [PubMed] [Google Scholar]
- 55.Hagn F., Wagner G. Structure refinement and membrane positioning of selectively labeled OmpX in phospholipid nanodiscs. J. Biomol. NMR. 2015;61:249–260. doi: 10.1007/s10858-014-9883-6. [DOI] [PMC free article] [PubMed] [Google Scholar]
- 56.Mahalakshmi R., Marassi F.M. Orientation of the Escherichia coli outer membrane protein OmpX in phospholipid bilayer membranes determined by solid-State NMR. Biochemistry. 2008;47:6531–6538. doi: 10.1021/bi800362b. [DOI] [PMC free article] [PubMed] [Google Scholar]
- 57.Vogt J., Schulz G.E. The structure of the outer membrane protein OmpX from Escherichia coli reveals possible mechanisms of virulence. Structure. 1999;7:1301–1309. doi: 10.1016/s0969-2126(00)80063-5. [DOI] [PubMed] [Google Scholar]
- 58.Marassi F.M., Opella S.J. Simultaneous assignment and structure determination of a membrane protein from NMR orientational restraints. Protein Sci. 2003;12:403–411. doi: 10.1110/ps.0211503. [DOI] [PMC free article] [PubMed] [Google Scholar]
- 59.Clore G.M., Garrett D.S. R-factor, free R, and complete cross-validation for dipolar coupling refinement of NMR structures. J. Am. Chem. Soc. 1999;121:9008–9012. [Google Scholar]
- 60.Murray D.T., Li C., Cross T.A. Membrane protein structural validation by oriented sample solid-state NMR: diacylglycerol kinase. Biophys. J. 2014;106:1559–1569. doi: 10.1016/j.bpj.2014.02.026. [DOI] [PMC free article] [PubMed] [Google Scholar]
- 61.Vriend G., Sander C. Quality control of protein models: directional atomic contact analysis. J. Appl. Cryst. 1993;26:47–60. [Google Scholar]
- 62.Word J.M., Lovell S.C., Richardson D.C. Visualizing and quantifying molecular goodness-of-fit: small-probe contact dots with explicit hydrogen atoms. J. Mol. Biol. 1999;285:1711–1733. doi: 10.1006/jmbi.1998.2400. [DOI] [PubMed] [Google Scholar]
- 63.Im W., Brooks C.L., 3rd De novo folding of membrane proteins: an exploration of the structure and NMR properties of the fd coat protein. J. Mol. Biol. 2004;337:513–519. doi: 10.1016/j.jmb.2004.01.045. [DOI] [PubMed] [Google Scholar]
- 64.Cheng X., Jo S., Im W. Solid-state NMR-restrained ensemble dynamics of a membrane protein in explicit membranes. Biophys. J. 2015;108:1954–1962. doi: 10.1016/j.bpj.2015.03.012. [DOI] [PMC free article] [PubMed] [Google Scholar]
- 65.Fernández C., Hilty C., Wüthrich K. NMR structure of the integral membrane protein OmpX. J. Mol. Biol. 2004;336:1211–1221. doi: 10.1016/j.jmb.2003.09.014. [DOI] [PubMed] [Google Scholar]
- 66.Baaden M., Sansom M.S. OmpT: molecular dynamics simulations of an outer membrane enzyme. Biophys. J. 2004;87:2942–2953. doi: 10.1529/biophysj.104.046987. [DOI] [PMC free article] [PubMed] [Google Scholar]
- 67.Ramakrishnan M., Qu J., Marsh D. Orientation of beta-barrel proteins OmpA and FhuA in lipid membranes. Chain length dependence from infrared dichroism. Biochemistry. 2005;44:3515–3523. doi: 10.1021/bi047603y. [DOI] [PubMed] [Google Scholar]
- 68.Tusnády G.E., Dosztányi Z., Simon I. PDB_TM: selection and membrane localization of transmembrane proteins in the protein data bank. Nucleic Acids Res. 2005;33:D275–D278. doi: 10.1093/nar/gki002. [DOI] [PMC free article] [PubMed] [Google Scholar]
- 69.Evanics F., Hwang P.M., Prosser R.S. Topology of an outer-membrane enzyme: Measuring oxygen and water contacts in solution NMR studies of PagP. J. Am. Chem. Soc. 2006;128:8256–8264. doi: 10.1021/ja0610075. [DOI] [PubMed] [Google Scholar]
- 70.Lomize M.A., Lomize A.L., Mosberg H.I. OPM: orientations of proteins in membranes database. Bioinformatics. 2006;22:623–625. doi: 10.1093/bioinformatics/btk023. [DOI] [PubMed] [Google Scholar]
- 71.Triba M.N., Zoonens M., Warschawski D.E. Reconstitution and alignment by a magnetic field of a beta-barrel membrane protein in bicelles. Eur. Biophys. J. 2006;35:268–275. doi: 10.1007/s00249-005-0014-x. [DOI] [PubMed] [Google Scholar]
- 72.Lazaridis T. Structural determinants of transmembrane β-barrels. J. Chem. Theory Comput. 2005;1:716–722. doi: 10.1021/ct050055x. [DOI] [PubMed] [Google Scholar]
- 73.Kleinschmidt J.H. Folding of β-barrel membrane proteins in lipid bilayers—unassisted and assisted folding and insertion. Biochim. Biophys. Acta. 2015 doi: 10.1016/j.bbamem.2015.05.004. pii:S0005-2736(15)00152-2. [DOI] [PubMed] [Google Scholar]
- 74.de Planque M.R., Killian J.A. Protein-lipid interactions studied with designed transmembrane peptides: role of hydrophobic matching and interfacial anchoring. Mol. Membr. Biol. 2003;20:271–284. doi: 10.1080/09687680310001605352. [DOI] [PubMed] [Google Scholar]
- 75.Mouritsen O.G., Bloom M. Mattress model of lipid-protein interactions in membranes. Biophys. J. 1984;46:141–153. doi: 10.1016/S0006-3495(84)84007-2. [DOI] [PMC free article] [PubMed] [Google Scholar]
- 76.White S.H., Wimley W.C. Membrane protein folding and stability: physical principles. Annu. Rev. Biophys. Biomol. Struct. 1999;28:319–365. doi: 10.1146/annurev.biophys.28.1.319. [DOI] [PubMed] [Google Scholar]
- 77.Yao Y., Fujimoto L.M., Marassi F.M. Conformation of BCL-XL upon membrane integration. J. Mol. Biol. 2015;427:2262–2270. doi: 10.1016/j.jmb.2015.02.019. [DOI] [PMC free article] [PubMed] [Google Scholar]
- 78.Kucerka N., Liu Y., Nagle J.F. Structure of fully hydrated fluid phase DMPC and DLPC lipid bilayers using X-ray scattering from oriented multilamellar arrays and from unilamellar vesicles. Biophys. J. 2005;88:2626–2637. doi: 10.1529/biophysj.104.056606. [DOI] [PMC free article] [PubMed] [Google Scholar]
Associated Data
This section collects any data citations, data availability statements, or supplementary materials included in this article.