Figure 2.
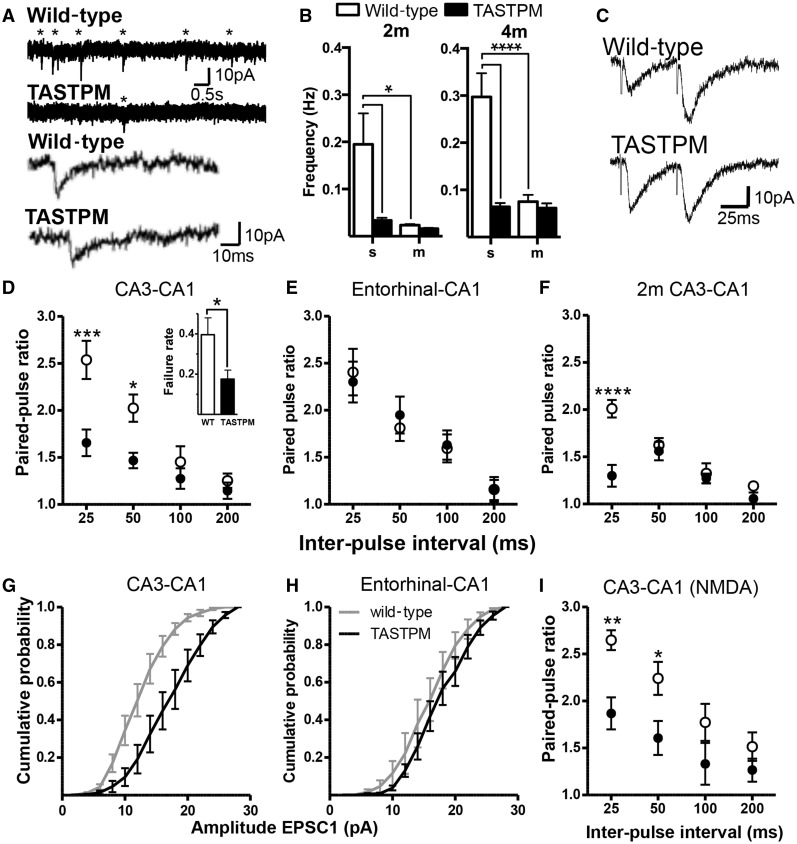
Absence of spontaneous EPSCs in TASTPM CA1 pyramidal neurons (4-months-old unless otherwise indicated). (A) Top: Example traces (Vhold = −70 mV) showing spontaneous EPSCs from 4 m TASTPM and age-matched wild-type mice. Asterisks indicate confirmed EPSCs. Bottom: Example miniature EPSCs from 4 m TASTPM and wild-type mice. (B) Mean frequency of spontaneous (s) EPSCs and miniature (m) EPSCs. Sample sizes (WT/TASTPM): spontaneous EPSCs: 2 m: 11/7; 4 m: 7/7; miniature EPSCs: 2 m: 8/5; 4 m: 8/8 animals. Two-way ANOVA revealed a significant main effect of genotype (2 m: P < 0.05; 4 m: P < 0.001) and tetrodotoxin (2 m: P < 0.05; 4 m: P < 0.001). (C) Example evoked EPSCs from CA3–CA1 synapses at 4 m. (D) Paired-pulse ratios (EPSC2amplitude/EPSC1amplitude) were lower in TASTPM (n = 8) than wild-type (n = 6) mice at CA3–CA1 synapses. Two-way ANOVA: main effect of interval (P < 0.0001); genotype (P < 0.01). Post hoc significance as indicated. Inset: The proportion of stimuli that failed to evoke a successful EPSC was lower in TASTPM than wild-type. (E) Entorhinal cortical-CA1 synapses (temporoammonic pathway) showed no difference in paired-pulse ratios between wild-type (n = 5) and TASTPM (n = 6). (F) Paired-pulse ratios at CA3–CA1 synapses in 2-month-old wild-type (n = 5) and TASTPM (n = 5) animals. Two-way ANOVA revealed significant main effects of genotype (P = 0.016), and interval (P < 0.0001). (G) First unitary EPSCs at Schaffer collateral (CA3-CA1) synapses are larger in slices from TASTPM (n = 6) than wild-type (n = 8); (P < 0.0001). (H) In contrast, at temporoammonic synapses, the amplitudes of the first unitary EPSCs were statistically identical between TASTPM (n = 6) and wild-type mice (n = 5). (I) Paired-pulse ratios of pharmacologically isolated NMDA receptor-mediated EPSCs at CA3–CA1 synapses were lower in TASTPM (n = 7) than wild-type mice (n = 6). Two-way ANOVA revealed significant main effects of genotype (P = 0.01) and interval (P < 0.0001). In all panels significance by Sidak post hoc analysis indicated as *P < 0.05, **P < 0.01, ***P < 0.001, ****P < 0.0001. WT = wild-type.

