

Abstract
Bioorthogonal reactions, including the strain-promoted azide–alkyne cycloaddition (SPAAC) and inverse electron demand Diels–Alder (iEDDA) reactions, have become increasingly popular for live-cell imaging applications. However, the stability and reactivity of reagents has never been systematically explored in the context of a living cell. Here we report a universal, organelle-targetable system based on HaloTag protein technology for directly comparing bioorthogonal reagent reactivity, specificity, and stability using clickable HaloTag ligands in various subcellular compartments. This system enabled a detailed comparison of the bioorthogonal reactions in live cells and informed the selection of optimal reagents and conditions for live-cell imaging studies. We found that the reaction of sTCO with monosubstituted tetrazines is the fastest reaction in cells; however, both reagents have stability issues. To address this, we introduced a new variant of sTCO, Ag-sTCO, which has much improved stability and can be used directly in cells for rapid bioorthogonal reactions with tetrazines. Utilization of Ag complexes of conformationally strained trans-cyclooctenes should greatly expand their usefulness especially when paired with less reactive, more stable tetrazines.
Introduction
Probing the biological functions of proteins and small molecules is essential to our mechanistic understanding of cell biology. Recent developments in bioorthogonal chemistry1−5 have provided a means to chemically tag biomolecules in live cells without significantly perturbing their native functions. These bioorthogonal chemical tags provide unique handles that, after ligation with specific reporters, enable visualization and/or identification of biological targets. Bioorthogonal tags have been introduced into proteins in a number of ways: reaction with clickable covalent inhibitors,6,7 ligand-directed affinity-based labeling with tosyl8 and other reactive groups,9,10 photoaffinity labeling with clickable photoprobes,11,12 ligation using enzymes (such as lipoic acid ligase,13−15 protein farnesyltransferase16 or sortase17), metabolic labeling18 (clickable glycans,19,20 amino acids,21 lipids,22,23 acetyl-CoA24 and S-adenosyl-l-methionine analogues25), and genetic encoding of unnatural amino acids.26,27 These techniques are finding great utility in drug discovery efforts for target identification, target-engagement, and target validation directly in living systems.28−30
With the widespread use of bioorthogonal labeling strategies, there is increasing effort to develop novel reactions for targeting cellular biomolecules.4,5 These reactions typically follow second-order kinetics and have reaction rate constants ranging from 10–4 to 106 M–1 s–1;5,31,32 however, these rate constants are typically measured in vitro and are not necessarily reflective of rates in complex biological systems. While many reactions have been evaluated in vitro or at the cell surface, relatively few bioorthogonal reactions have been carried out in an intracellular context. In addition, with more than 20 unique reactions,5 selecting the appropriate chemistry for a given application can be daunting. We envisioned developing a system that would enable the unbiased investigation of bioorthogonal reaction progression in the complex intracellular biological mileu of living cells, where issues such as reagent permeability, selectivity, and cross-reactivity could be explored.
Recently, methods have been developed to label proteins with small-molecules using genetically encoded fusion proteins with the covalent self-labeling O6-alkyl guanine-DNA alkyltransferase (AGT) known as SNAP-tag33,34 and an engineered haloalkane dehalogenase known as HaloTag.35 These proteins covalently react with small molecule substrates and allow selective labeling within living systems. AGT fusion proteins can be covalently labeled with O6-benzylguanine derivatives and HaloTag fusion proteins covalently bind chloroalkane ligands. One advantage of these genetic fusion techniques is that they can be designed to target selected organelles in live cells.36,37 There are now a number of recombinant methods that can be used to incorporate bioorthogonal groups into proteins, either via direct encoding of unnatural amino acids,27,38−40 or through fusion of an acceptor peptide for ligase-mediated attachment of a bioorthogonal tag.14,15 Several of these methods have been applied to live-cell imaging.14,41−43 However, these techniques are not yet able to accept the full spectrum of bioorthogonal tagging groups, many of which are sterically demanding and hydrophobic.
Herein, we report the development and validation of an organelle-targetable model system that can be used to systematically evaluate bioorthogonal reactions in live cells. We adapted the HaloTag protein labeling technology35,44 by synthesizing chloroalkane derivatives incorporating various bioorthogonal groups and covalently displaying these groups on HaloTag-fusion proteins. Previously, this technology has been used to label HaloTag-fusion proteins in live cells with chloroalkane-linked fluorescent molecules,45−50 photosensitizing chromophores,51 photoreactive kinase inhibitors52,53 and hydrophobic tags.54,55 HaloTag-protein fusions were selected to localize the HaloTag protein, and hence the bioorthogonal reaction, to different subcellular compartments, including the nucleus, cytosol, plasma membrane and endoplasmic reticulum (ER). Because HaloTag labeling is broadly general, it can be used to incorporate a wide range of bioorthogonal reaction partners thereby enabling the comparative study of reaction efficiency and selectivity. Moreover, the same HaloTag constructs can be used to directly incorporate fluorophores, thereby providing a fluorescence readout for quantifying the efficiency of bioorthogonal methods of attaching the same fluorophores. Overall, this system enables a quantitative comparison between different bioorthogonal ligations, as well as the participating chemical groups, in the complex microenvironments within the confines of a living cell, where true bioorthogonality can be evaluated.
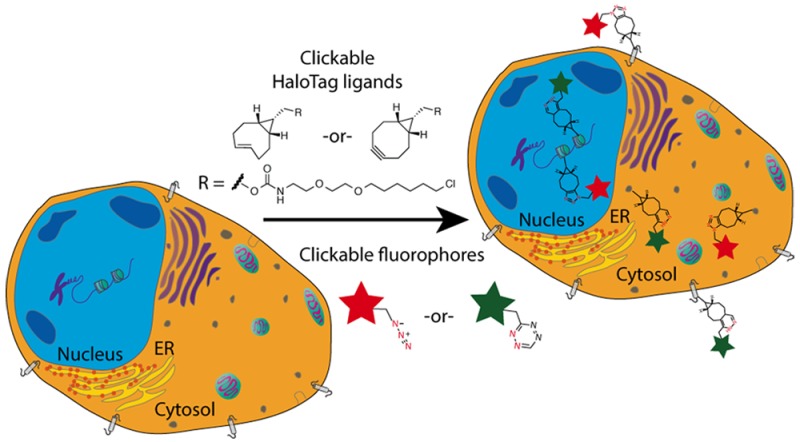
To validate this system, we investigated two prominent bioorthogonal chemistries that are amenable to live-cell labeling, the strain-promoted azide–alkyne cycloaddition (SPAAC) between cyclooctynes and azides56,57 and the inverse electron-demand Diels–Alder (iEDDA) reaction of strained cycloalkenes and cyclooctynes with tetrazines.31,58,59 We used bioorthogonal fluorophore reporters to investigate reaction rates, reagent specificity, cellular availability, stability, and optimal conditions for intracellular labeling in living mammalian cells using in-gel fluorescence and fluorescence microscopy (Scheme 1). This system provides a novel, live-cell platform for the unbiased investigation of bioorthogonal chemistry in different subcellular organelles and will be a useful tool to characterize novel reactions and fluorophores in the context of a living cell.
Scheme 1. Organelle-Targetable HaloTag-Based Evaluation of Strain Promoted Azide–Alkyne Cycloaddition (SPAAC, Top) and Inverse Electron Demand Diels–Alder (iEDDA, Bottom) Bioorthogonal Chemistry with Analysis by Fluorescence Microscopy and In-Gel Fluorescence.

Results and Discussion
Design and Synthesis of Clickable HaloTag Ligands and Fluorophores
We developed a model system based on HaloTag protein technology to examine bioorthogonal reactions inside living cells and optimize conditions for live-cell fluorescence imaging applications (Scheme 1). A suite of bioorthogonal HaloTag ligands were synthesized (Figure 1A) to investigate two prominent bioorthogonal reactions that have become increasingly popular for live-cell labeling: SPAAC and iEDDA (see Supporting Information (SI) for synthesis). For SPAAC, several cyclooctynes with enhanced reaction kinetics due to increased strain energy have been introduced, including the dibenzocyclooctynes DIBO,60 DBCO61 (also known as DIBAC) and BARAC,62 and the bicyclononyne BCN.63 We chose to prepare HaloTag ligands based on the commercially available cyclooctynes DBCO 1 and BCN 2 (Figure 1A) and investigate the SPAAC reaction with fluorophore-azides (i.e., 15, 19 and 23, Figure 1B–D). In addition, we examined the reverse bioorthogonal group pairing, by preparing chloroalkane-azide HaloTag ligand 3 to tag the protein with an azide, followed by reaction with DBCO- and BCN-linked fluorescent reporters 16 and 17, respectively. For iEDDA, we prepared HaloTag ligands incorporating seven different dienophiles that cover a broad range of reactivity, including the parent trans-cyclooctene 4,64 the conformationally strained trans-cyclooctenes known as sTCO (5 and 6)65 and dTCO 7,32 as well as derivatives of norbornene (8)66 and cyclopropene (9)67,68 (Figure 1A). The iEDDA reaction was examined using fluorophore-tetrazines (i.e., 13, 14, 20–22, Figure 1B–D) as the reaction partner. We also examined the reaction of tetrazine-chloroalkane 10 and methyl-tetrazine-chloroalkane 11(66,69−71) with the BCN- and TCO-linked fluorophores (17 and 18, respectively) to study the reverse pairing where the tetrazine was the protein tag and the strained alkyne and alkene was incorporated in the reporter molecule. We chose to investigate the reactions with clickable versions of three fluorophores, carboxytetramethylrhodamine (TAMRA), boron dipyrromethene (BODIPY), and fluorescein that have been used extensively for live-cell imaging (Figure 1B–D).
Figure 1.

Structures of clickable (A) HaloTag chloroalkane ligands and (B) TAMRA-, (C) Fluorescein-, and (D) BODIPY-fluorophores.
Organelle-Targeted HaloTag Fusion Proteins
HaloTag fusion proteins were designed to contain three components: (1) an N-terminal HaloTag protein to react with bioorthogonal HaloTag ligands, (2) an organelle-targeting protein sequence, and (3) a fluorescent protein (GFP or mCherry) for confirmation of protein expression and reaction colocalization by fluorescence microscopy. When expressed in mammalian cells, the organelle-targeting sequence directs expression of the HaloTag protein inside the lumen of the organelle of interest. Localized HaloTag fusion protein can then be covalently labeled with various clickable HaloTag ligands (i.e., 1–11) to tag the protein followed by reaction with the cognate bioorthogonal fluorophore reporters (Scheme 1). Expression and localization of fusion proteins targeting the nucleus, endoplasmic reticulum (ER), cytosol, and plasma membrane (Table 1) were confirmed by live-cell fluorescence microscopy (Figure S1) prior to analysis of the bioorthogonal reactions.
Table 1. Organelle-Targeted HaloTag Constructs.
| HaloTag construct | organelle |
|---|---|
| Halo-H2B-GFP | nucleus |
| Halo-H2B-mCherry | |
| Halo-mCherry | nucleus/cytosol |
| Halo-GAP43-GFP | cytosol |
| Halo-GAP43-mCherry | |
| Halo-KDEL | endoplasmic reticulum |
| Halo-KDEL-GFP | |
| Halo-KDEL-mCherry | |
| Halo-mCherry-PDGFR | extracellular plasma membrane |
Efficiency of Clickable HaloTag Ligand Conjugation to HaloTag Fusion Proteins
We initially investigated the SPAAC and iEDDA reactions in the nucleus of live HeLa cells using Halo-H2B-GFP, which has high protein expression levels and excellent nuclear localization. Our initial investigations used TAMRA as the fluorophore reporter as it exhibits low background fluorescence for live-cell imaging and has a relatively uniform distribution within HeLa cells.72,73 The capacity of HaloTag ligands 1–11 to label Halo-H2B-GFP in HeLa cells was first examined using a competitive pulse-chase assay with fluorescent TAMRA HaloTag ligand 12. Halo-H2B-GFP expressing HeLa cells were labeled with HaloTag ligands 1–11, and chased with TAMRA ligand 12. The ability of nonfluorescent ligands 1–11 to inhibit incorporation of 12 was determined by in-gel fluorescence (Figure S2). While we did not observe complete saturation of HaloTag protein under these conditions, the incorporation of clickable HaloTag ligands 1–11 was similar (∼70–79% incorporation), enabling a semiquantitative comparison of subsequent SPAAC and iEDDA reactions.
Comparison of Bioorthogonal Reactions in Live HeLa Cells
The SPAAC and iEDDA ligations were evaluated in cells by reacting the clickable HaloTag protein conjugates of 1–11 with the corresponding clickable TAMRA-based fluorescent reporters 13–18. The TAMRA-labeled proteins were detected by in-gel fluorescence to quantify the click chemistry reaction product as well as any nonspecific protein labeling. Total HaloTag protein was measured by Western blot to control for protein loading. To account for data fluctuations, variability between experiments, and the dynamic nature of a live-cell system, we included TAMRA chloroalkane ligand 12 as a positive control to determine the total amount of HaloTag protein that could be fluorescently labeled per experiment (see Materials and Methods for detailed procedures). We first analyzed a dose response for each reaction to determine the half-maximal effective concentration (EC50), defined as the dose halfway between the baseline and saturating level for each reaction. The saturating level for each reaction was based on the plateau from normalized curve fit data in which we observed no further significant increase in fluorescence intensity between the clickable HaloTag conjugate and bioorthogonal TAMRA reporter. An optimized dose was then selected for timecourse studies to determine the reaction half-life (t1/2), defined as the time point halfway between the baseline and saturating level for the indicated dose. In addition, we calculated the efficiency for each reaction (Emax) from timecourse data, which is defined as the saturating level (plateau from curve fit data) for each reaction when normalized to the TAMRA HaloTag ligand 12 control. The reaction rate data reflect both the HaloTag labeling and the bioorthogonal reaction. As the HaloTag labeling efficiency was consistent from experiment to experiment (Figure S2), differences in these values mostly reflect differences between the bioorthogonal reactions.
SPAAC Reactions in Live HeLa Cells for Strained Alkyne Tags with Azide Reporters
For SPAAC ligations, HeLa cells expressing Halo-H2B-GFP were labeled with strained alkyne ligands DBCO 1 or BCN 2, followed by reaction with a dose response of TAMRA-azide 15 for 2h (Figure 2A,B). Reactions were immediately quenched with 500 μM 2-(2-(2-(2-azidoethoxy)ethoxy)ethoxy)ethan-1-amine (azide-amine 24, Figure S3A) and processed as described in the Materials and Methods section to determine the EC50 for each reaction. Representative gels for the SPAAC reaction of TAMRA-azide 15 with the DBCO 1- and BCN 2-Halo-H2B-GFP conjugates are shown in Figure S4A and Figure 2A, respectively and the EC50 curves from quantitation of 3–6 replicates for each reaction are shown in Figure 2B. The reactions were further investigated using a timecourse with 25 μM 15 to determine the t1/2 and Emax values (Figure 2C,D, Table 2). Representative gels from the timecourse reaction of TAMRA-azide 15 with DBCO 1- (Figure S4B) and BCN 2-Halo-H2B-GFP conjugates (Figure 2C) are shown. Quantification of the in-gel fluorescence and graph of the one-phase association curves from 3−6 replicates are reported in Figure 2D. Interestingly, we found significant differences between EC50, t1/2, and Emax values for DBCO 1 compared with BCN 2 when reacted with 15 (Table 2). The reaction between 1 and 15 was ∼10-fold faster and had a 20-fold lower EC50. Consistent with our observations for DBCO in these live-cell studies, rate enhancements up to 400-fold over in vitro reaction rates have been reported for more lipophilic cyclooctynes in biological environments.56,74,75 In addition, we observed a significant difference in the saturating levels (Emax) for SPAAC ligations in the context of a living cell. Here, 1 proceeded with >90% efficiency (Emax = 94%), whereas 2 had an average Emax of 67% (Table 2). These findings demonstrate the utility of our model system to directly compare bioorthogonal reaction parameters in live cells. Furthermore, the reaction parameters calculated herein are a reflection of multiple variables, including the reaction kinetics, as well as the permeability and diffusion of the reactants. Therefore, the differences in rates we observe cannot easily be predicted from in vitro models of reaction kinetics. Taken together, our studies suggest that the combination of DBCO with TAMRA-azide is an efficient SPAAC reaction for live-cell nuclear labeling in mammalian cells.
Figure 2.

Analysis of SPAAC reactions of DBCO 1- and BCN 2-HaloTag conjugates with TAMRA-azide 15 in the nucleus of live HeLa cells expressing Halo-H2B-GFP. (A) Cells were treated with 10 μM chloroalkane ligand BCN 2 for 30 min to generate the BCN 2-Halo-H2B-GFP conjugate followed by reaction with 50 nM-250 μM TAMRA-azide 15 for 2 h at 37 °C and analyzed by in-gel fluorescence (top panel) and western blotting with anti-HaloTag antibody (bottom panel). As a control, Halo-H2B-GFP was treated with TAMRA ligand 12 to determine the maximum fluorescent labeling per experiment (lane 1). (B) Dose–response curves from fluorescence intensity analysis of gels from the SPAAC reaction of TAMRA-azide 15 with DBCO 1-Halo (orange) and BCN 2-Halo (green) conjugates. (C) Representative gel of SPAAC timecourse experiments with BCN 2-Halo and 25 μM TAMRA-azide 15 analyzed by in-gel fluorescence (top panel) and western blotting with anti-HaloTag antibody (bottom panel). (D) One-phase association curves from timecourse fluorescence intensity analysis of SPAAC reactions between DBCO 1-Halo (orange) and BCN 2-Halo (green) reacting with 25 μM TAMRA–azide 15 for 1–240 min at 37 °C. Curves were generated in GraphPad Prism from fluorescence intensity measurements of n = 3–6 independent replicates as described in the Experimental Section, and reported as the mean ± SEM.
Table 2. Live-Cell Reaction Rate Data and Efficiency for SPAAC Reactions in the Nucleus.
| HaloTag ligand | TAMRA-azide | EC50 (μM)a | t1/2 (min)b | Emax (%)b |
|---|---|---|---|---|
| DBCO (1) | 15 | 0.4 | 4.2 | 94 |
| BCN (2) | 15 | 10.7 | 40.1 | 67 |
From dose response of TAMRA-azide for 2 h.
From timecourse with 25 μM TAMRA-azide.
iEDDA Reactions in Live HeLa Cells for Strained Alkene and Alkyne Tags with Tetrazine Reporters
We next evaluated the iEDDA reaction of tetrazines with four prominent dienophiles covering a broad range of reactivity. We calculated the EC50, t1/2, and Emax values as described above and in the Materials and Methods section. Because of faster kinetics for iEDDA reactions compared to SPAAC reactions, and the propensity of monosubstituted tetrazines for nonspecific labeling at high concentrations (vide infra, Figure S6, S8 and S13), we used lower concentrations of the fluorophore-tetrazine for the iEDDA dose response and timecourse studies. The strained alkyne BCN 2, which has recently been reported to undergo iEDDA reactions,39,76,77 and DBCO 1 were also investigated in these studies. Halo-H2B-GFP incorporating the TCO 4, BCN 2, DBCO 1, NBor 8 and Cprop 9 HaloTag ligands were initially reacted with a dose response of TAMRA-Tz 13 for 1 h, and the reactions were quenched with 100 μM (4-(1,2,4,5-tetrazin-3-yl)phenyl)methanamine (Tz-amine 27, Figure S3B) and processed as described. Figure 3A contains a representative gel for the reaction between TCO 4-Halo-H2B-GFP conjugate and TAMRA-Tz 13, and a representative gel for the reaction of the BCN 2-Halo-H2B-GFP conjugate with 13 is included in Figure S5A. Under these conditions, TCO 4 had a slightly lower EC50 and the reaction proceeded to a greater extent compared to BCN 2 (Figure 3B and Table 3). In contrast, DBCO 1 did not react with TAMRA-Tz 13 (Figure S6). This is consistent with previous reports,77,78 and is likely due to increased sterics present in the tricyclic dibenzocyclooctyne ring system. We next investigated the reaction timecourse of BCN 2 and TCO 4 with 2 μM TAMRA-Tz 13 to determine the t1/2 and Emax values. Representative gels for the timecourse reaction of TAMRA-Tz 13 with TCO 4 or BCN 2 are shown in Figure 3C and Figure S5B, respectively. Here, we observed much faster reaction rates than the SPAAC ligations, consistent with the faster in vitro kinetics reported for iEDDA ligations. Interestingly, BCN 2 was found to undergo an iEDDA reaction with TAMRA-Tz 13 almost as fast as TCO 4 in the nucleus of live mammalian cells, and both reactions proceeded with similar efficiencies (Figure 3D and Table 3).
Figure 3.

Analysis of iEDDA reactions of BCN 2- and TCO 4-HaloTag conjugates with TAMRA-Tz 13 in the nucleus of live HeLa cells expressing Halo-H2B-GFP. (A) Cells were treated with 10 μM chloroalkane ligand TCO 4 for 30 min to generate the TCO 4-Halo-H2B-GFP conjugate followed by reaction with 1 nM-20 μM TAMRA-Tz 13 for 1 h at 37 °C and analyzed by in-gel fluorescence (top panel) and western blotting with anti-HaloTag antibody (bottom panel). As a control, Halo-H2B-GFP was treated with TAMRA-ligand 12 to determine the maximum fluorescence labeling per experiment (lane 1). (B) Dose–response curves from fluorescence intensity analysis of gels from the iEDDA reaction of TAMRA-Tz 13 with BCN 2-Halo (black) and TCO 4-Halo (blue) conjugates. (C) Representative gel of iEDDA timecourse reaction between 2 μM TAMRA-Tz 13 and TCO 4-Halo conjugate analyzed by in-gel fluorescence (top panel) and western blotting with anti-HaloTag antibody (bottom panel). (D) One-phase association curves from timecourse fluorescence intensity analysis of iEDDA reactions between BCN 2-Halo (black) or TCO 4-Halo (blue) with 2 μM TAMRA-Tz 13 for 0.5–120 min at 37 °C. Curves were generated in GraphPad Prism from fluorescence intensity measurements of n = 3–6 independent replicates as described in the Experimental Section, and reported as the mean ± SEM.
Table 3. Live-Cell Reaction Rate Data and Efficiency for iEDDA Reactions in the Nucleus.
| HaloTag ligand | TAMRA- | EC50 (μM)a | t1/2 (min)b | Emax (%)b |
|---|---|---|---|---|
| BCN (2) | Tz (13) | 2.1 | 16.9 | 51 |
| TCO (4) | Tz (13) | 1.4 | 13.8 | 47 |
| BCN (2) | Tz-Me (14) | n.d. | 44.8 | 31 |
| TCO (4) | Tz-Me (14) | n.d. | 46.4 | 27 |
| sTCO (5) | Tz (13) | 0.1 | 2.2 | 67 |
| Ag-sTCO (6) | Tz (13) | 0.036 | 1.4 | 86 |
| dTCO (7) | Tz (13) | 0.05 | 5.2 | 77 |
From dose response of TAMRA-Tz 13 for 1 h.
From timecourse with 2 μM 13 or 14. n.d. = not determined.
As DBCO was found to rapidly undergo the SPAAC reaction with TAMRA-azide 15, we were curious to determine how the rate of this reaction compared with iEDDA reactions of 2 and 4 with 13. To provide a direct comparison between reaction rates, we determined the half-life and efficiency of this reaction under identical conditions as the iEDDA reactions. Here, we observed a half-life for this SPAAC reaction of ∼15 min, which was almost as fast in live cells as the iEDDA reactions of 4 and 2 with 13 (Figure S7). This surprising rate enhancement for SPAAC reactions of DBCO underscores the importance of measuring relative reaction rates within a cellular context, and not relying solely on in vitro rate data.
Under the same conditions used in Figure 3A, we did not observe significant reaction with either the NBor 8 or Cprop 9 HaloTag conjugates (data not shown), even though the HaloTag ligands were effectively conjugated to the HaloTag protein (Figure S2). To more accurately assess the reactivity of NBor 8 and Cprop 9 HaloTag ligands in our cellular system, which display sluggish in vitro reaction rates compared to other dienophiles,66,68,79−81 we evaluated higher concentrations of TAMRA-Tz 13 over a longer 4 h reaction period. Even under these modified conditions, we were only able to detect ∼10–20% reaction (Figure S8). Furthermore, we observed significant background protein labeling by 13 at these high concentrations, and background labeling dominated at 100 μM. These studies suggest that 8 and 9 are either not stable in the nucleus of mammalian cells or not sufficiently reactive under the live-cell labeling conditions implemented here.
Various tetrazines have been synthesized for live-cell labeling, and 3-methyl-6-aryltetrazine derivatives have been used for live-cell imaging applications due to their improved stability.70,71 Therefore, we were curious to examine how this tetrazine variant behaved in our model system. To this end, we determined the half-lives and efficiency for the BCN 2-Halo and TCO 4-Halo conjugates with TAMRA-Tz-Me 14 (Figure 1B). Consistent with published in vitro kinetic data,82,8314 reacts about 3 times more slowly than TAMRA-Tz 13 under identical parameters (Figure S9 and Table 3). In addition, reaction with TAMRA-Tz-Me 14 was also less efficient, reacting with only ∼25–30% efficiency when compared to our positive TAMRA control within the 4 h timecourse.
Overall, these studies clearly demonstrate significant differences in labeling rates and stability of reactants when placed in the context of a living cell, and should help provide guidance when choosing the reaction of choice and labeling conditions for a particular application.
SPAAC and iEDDA Ligations of Azide and Tetrazine Tags with Strained Alkyne and Alkene Reporters
Our live-cell model system provided interesting observations regarding SPAAC and iEDDA reactions when either the strained alkyne or alkene was introduced into the cell as a tag prior to reaction with the appropriate azide or tetrazine reporter. We also investigated the reverse situation where an azide or tetrazine was introduced into the cell as a tag followed by reaction with the appropriate strained alkyne or alkene reporter. For the SPAAC reactions, Halo-H2B-GFP incorporating azide HaloTag ligand 3 was reacted with a timecourse of 25 μM TAMRA-DBCO 16 or TAMRA-BCN 17 (Figure S10). Here, we observed an interesting disconnect where the azide tag/cycloalkyne reporter combination did not perform as well and generally had decreased reaction efficiency relative to the analogous cycloalkyne tag/azide reporter systems. To better understand this disconnect, we determined the passive permeability of the clickable fluorophore reporters 13–18 in low-efflux MDCKII cells (Table S1).84 We found that TAMRA-azide 15 had moderate permeability, while TAMRA-BCN 16 and TAMRA-DBCO 17 had very low permeability. We also investigated the stability of 13–18 in HeLa cells and found that TAMRA-azide 15 was completely stable over a 24 h period, while TAMRA-BCN 17 exhibited considerable instability with only 6% remaining after 24 h (Table S2). Therefore, the reduced efficiency of the azide tag/cycloalkyne reporter combination can be explained, in part, by the poorer permeability and stability of the cycloalkyne reporters which leads to lower effective intracellular concentrations of these reagents. In addition, we observed a significant amount of background protein labeling using 25 μM 16 and 17 (Figure S12E,F) that was not observed with TAMRA-azide 15 (Figure S12A). This is most likely due to nonspecific labeling of cysteine thiol biomolecules which has been shown to be a limitation of cyclooctynes including BCN in cell lysates and inside living cells.85 These observations have implications for probe design and argue for preferential placement of cycloalkyne bioorthogonal tags directly on the probe or biological component to be labeled rather than the reporter group.
For iEDDA reactions, the efficiency of reaction between the HaloTag conjugate of Tz 10 and 2 μM TAMRA-TCO 18 decreased by ∼50% (Figure S11) compared to the corresponding reaction where TCO 4 was incorporated as the tag and TAMRA-Tz 13 was used as the reporter (Figure 3). Monosubstituted tetrazines82 have been reported to have limited stability in serum upon prolonged exposure and this could account for part of the reduced reaction efficiency. In addition, TAMRA-Tz 13 displays nonspecific labeling at high concentrations (Figure S8 and S12D) so it is likely that a component of the instability is due to covalent modification of biomolecules within the cell. We also found that TAMRA-TCO 18 was considerably more stable than TAMRA-BCN 17 in HeLa cells (Table S2). Consistent with the improved stability, very little background labeling was observed for TAMRA-TCO 18 under the conditions of our experiments (Figure S12B). Even though TCO has been shown to undergo partial isomerization to the cis-isomer within the cell,86 this isomer is inert and does not cause nonspecific labeling of background proteins. This isomerization may slightly lower the Emax for the iEDDA reaction between 10 and 18, but it is not a limitation because the selectivity is not affected.
Interestingly, the Tz-Me 11 HaloTag conjugate retained high efficiency when incubated with TAMRA-TCO 18 (Figure S11). In addition, TAMRA-Tz-Me 14 was more stable in HeLa cells (Table S2) and displayed much less background labeling (Figure S12C) compared to TAMRA-Tz 13 (Figure S12D). These observations are consistent with prior reports that 3,6-disubstituted tetrazines are more stable than monosubstituted tetrazines,64,82,83,87 and suggest that disubstituted tetrazines may be useful as protein tagging agents for live-cell bioorthogonal labeling in mammalian cells particularly when paired with more reactive TCO reporters, as is the case in bacteria.32,38
Investigation of Conformationally Strained TCO Derivatives
Recently, two conformationally strained trans-cyclooctene derivatives have been described that display faster reactivity relative to simpler TCO derivatives. These groups include the strained trans-cyclooctene sTCO,65 which displays the fastest reactivity, and the cis-dioxolane-fused trans-cyclooctene dTCO, which displays better stability and solubility.32 To date, their use in live cells has been limited to applications as reporter molecules,32,38 and efforts to genetically encode or to use ligases to selectively introduce sTCO or dTCO into proteins have thus far proved unsuccessful.14,39 Recent reports have shown that these conformationally strained derivatives can undergo isomerization to the unreactive cis-isomer in the presence of high thiol concentrations, presumbably via a free radical mediated pathway.32,65 Using our model system, we investigated both the stability and reactivity of these two highly reactive TCO derivatives to assess their utility as tags for bioorthogonal labeling in mammalian cells.
We first examined the stability of sTCO when heated neat at 30 °C for 3 days and observed almost complete decomposition with a trace of isomerization to the cis-isomer (Figure 4A). We sought to find a way to stabilize the sTCO reagent to permit prolonged storage. The preparation of sTCO involves photoisomerization of the cis-cyclooctene in a flow reactor where the trans-isomer is isolated through selective complexation with AgNO3-impregnated silica gel.65,88 The sTCO is then liberated by stirring the silica with NH4OH. We hypothesized that preparing the sTCO reagent as the silver complex would provide long-term stability for storage, yet could be applied directly to cell culture, which contains high concentrations of NaCl that could release the reactive sTCO in situ. First we prepared the Ag-sTCO HaloTag ligand 6 (Figure 1A) and demonstrated that it was stable when heated at 30 °C for 3 days (Figure 4B), unlike the parent sTCO ligand 5 (Figure 4A). In addition, we synthesized a HaloTag reagent derived from the newly reported dTCO32 (Figure 1A, ligand 7), which has increased stability compared to sTCO while displaying similar reactivity.
Figure 4.

Stability of conformationally strained trans-cyclooctene derivatives. (A) 1H NMR spectra (600 MHz, CD3OD) of fresh sTCO 5 (bottom) and following a 3-day incubation neat at 30 °C (top) showing degradation and some trans-cis isomerization. (B) 1H NMR spectra (600 MHz, CD3OD) of fresh Ag-sTCO 6 (bottom) and following a 3 day incubation neat at 30 °C (top) showing no degradation or trans-cis isomerization. (C) Stability of TCO-derivatized HaloTag ligands 4–7 following formation of Halo-H2B-GFP conjugates inside the nucleus over 24 h. HeLa cells expressing Halo-H2B-GFP were labeled with 10 μM chloroalkane ligands 4–7 for 30 min at 37 °C. Unbound ligand was washed out of the cells for 1 h, and the t = 0 time point was labeled with a saturating dose of 2 μM TAMRA-Tz 13 for 1 h and analyzed by in-gel fluorescence. All other time points were labeled with TAMRA-Tz 13 after the indicated incubation times in media. For each time point, we labeled Halo-H2B-GFP or Halo-KDEL with TAMRA ligand 12 as a positive control to account for HaloTag conjugate protein turnover during the course of the experiment. Graphs represent fluorescence intensity measurements from 3 replicates, and are reported as the mean ± SEM (D) Stability of TCO 4–7 Halo-KDEL conjugates inside the lumen of the ER over 24 h. HeLa cells expressing Halo-KDEL were labeled, collected, and analyzed as in (C).
We next examined the relative stability of the TCO series of HaloTag ligands (compounds 4–7) following conjugation to Halo-H2B-GFP in the nucleus or Halo-KDEL in the endoplasmic reticulum (ER) (Figure 4C,D). HeLa cells were transfected with either Halo-H2B-GFP or Halo-KDEL and HaloTag ligands 4–7 were added to make the corresponding clickable HaloTag conjugates and excess unbound ligand was washed out of the cells. TAMRA-Tz 13 was added at the indicated time points over 24 h to evaluate how much of the TCO-Halo conjugate was stable and could undergo the iEDDA reaction. Results were quantified by in-gel fluorescence and Western blotting. The reaction of TCO 4-Halo-H2B-GFP with TAMRA-Tz 13 progressed to the same extent over 24 h indicating that TCO 4 was stable in the nucleus under these conditions. In contrast, less TAMRA-Tz 13 reacted over the 24 h period with the conformationally strained TCO derivatives presumably due to isomerization to the unreactive cis-isomer with prolonged incubation. Ag-sTCO 6 and sTCO 5 had the lowest stability, leading to significant loss of reactivity after 24 h, while dTCO 7 had intermediate stability. However, in the ER, all the trans-cyclooctenes appeared stable for up to 24 h (Figure 4D), suggesting that differences in subcellular microenvironments can affect reagent stability. The ER provides a highly oxidizing environment relative to the rest of the cell89 and further study will be needed to determine if that contributes to the enhanced stability of trans-cyclooctenes in the ER relative to the nucleus. Nonetheless, our data suggests that conformationally strained TCOs are useful as tagging molecules in the ER, where some enzyme-mediated protein labeling reactions are not compatible.90 Importantly, sTCO 5 and Ag-sTCO 6 behaved almost identically demonstrating that the Ag is effectively decomplexed when 6 is added to cells.
Reaction rates were then examined between TAMRA-Tz 13 and the more reactive dienophiles 5–7 in the nucleus to determine how these values compare to TCO 4 under the same reaction conditions. Consistent with the increased reactivity observed from in vitro kinetics data,32,65 we observed over 14-fold lower EC50 values for the sTCO 5, Ag-sTCO 6 and dTCO 7 Halo-H2B-GFP conjugates when compared to TCO 4, with the lowest EC50 ∼ 36 nM for Ag-sTCO 6 (Figure 5A, Table 3). Representative gels for each reaction are shown in Figure S13A. Furthermore, a comparison of reaction half-life values demonstrates that Ag-sTCO 6 (half-life ∼1.4 min) and sTCO 5 (half-life ∼2.2 min) react the fastest, followed by dTCO 6, and finally TCO 4 (Figure 5B and Table 3). Representative gels for timecourse reactions are shown in Figure S13B. In addition, the reactions with conformationally strained TCO derivatives 5–7 have the highest efficiencies with Emax values in the 67–86% range compared to 47% for TCO 4. Overall, these data demonstrate that the sTCO reagents (5 and 6) have the fastest kinetics and highest efficiency for live-cell labeling, enabling reaction saturation within minutes following addition of the tetrazine reporter. Furthermore, consistent with the above stability data, sTCO was clearly liberated from the silver complex 6 when added to the cell culture since Ag-sTCO 6 performed identically or slightly better than the parent sTCO 5. In addition, Ag-sTCO 6 stock solutions remained stable up to 8 months when stored at −20 °C, whereas sTCO 5 stock solutions, and even neat compound, required frequent preparation and/or resynthesis of the ligand when stored at −20 °C. We also tested sTCO 5 and Ag-sTCO 6 in a standard MTT cell viability assay in HeLa cells and found no cell toxicity over a 24 h period (Figure S14). Given that Ag-sTCO has greatly improved stability for storage, we feel this reagent will expand the utility of sTCO iEDDA chemistry in cells.
Figure 5.

Analysis of iEDDA reactions of sTCO 5-, Ag-sTCO 6-, and dTCO 7-HaloTag conjugates with TAMRA-Tz 13 in the nucleus of live HeLa cells expressing Halo-H2B-GFP. (A) Dose–response curves for the iEDDA reaction of TAMRA-Tz 13 with the HaloTag conjugates of sTCO 5 (red), Ag-sTCO 6 (blue), and dTCO 7 (black) chloroalkane ligands. (B) One phase association plot of the iEDDA reaction timecourse between 2 μM TAMRA-Tz 13 and the HaloTag conjugates of chloroalkane ligands 5–7. Curve fits represent full 2 h timecourse, and are shown here up to 60 min to highlight differences in the early part of the curves. See Figure S13 for representative gels of each reaction. Data is reported as the mean ± SEM for 3 replicates.
Characterization of SPAAC and iEDDA Reactions in Different Organelles
We next investigated the performance of the SPAAC and iEDDA reactions in the endoplasmic reticulum and cytosol, where unique subcellular microenvironments can affect the stability (Figure 4C,D) and, potentially, reactivity of the bioorthogonal groups investigated here. We chose the fastest dienophiles, Ag-sTCO 6 and dTCO 7, to evaluate the iEDDA reaction. For SPAAC chemistry, we examined both the DBCO 1 and BCN 2 chloroalkane ligands. We restricted the bioorthogonal reactions to the lumen of the ER using HaloTag-KDEL. For cytosolic localization, we designed a HaloTag-GAP43-GFP construct which is present throughout the cytosol, and excluded from the nucleus (Figure S1C). HeLa cells were transfected with either construct and treated under identical conditions used for evaluation of the nuclear construct, Halo-H2B-GFP. Overall, both the SPAAC and iEDDA reactions proceeded with similar reaction rates in both the cytosol and ER (Figure S15 and Table 4). The reaction of Ag-sTCO 6 and dTCO 7 with TAMRA-Tz 13 mirrored what was seen in the nucleus (Figure S15C,D and Table 4).
Table 4. Live-Cell Reaction Rate Data in Different Organelles.
| HaloTag ligand | TAMRA- | organelle | t1/2 (min) | Emax (%) |
|---|---|---|---|---|
| BCN (2) | Azide (15) | cytosol | 20.1a | 70 |
| ER | 25.2a | 66 | ||
| DBCO (1) | Azide (15) | cytosol | 5.3a | 86 |
| ER | 6.6a | 78 | ||
| Ag-sTCO (6) | Tz (13) | cytosol | 2.1b | 82 |
| ER | 1.2b | 68 | ||
| dTCO (7) | Tz (13) | cytosol | 2.7b | 75 |
| ER | 4.7b | 78 |
From timecourse with 25 μM TAMRA-azide.
From timecourse with 2 μM TAMRA-Tz.
As expected, Ag-sTCO 6 was slightly faster than dTCO 7, and both reactions proceeded with similar efficiencies (Table 4). Furthermore, the SPAAC reaction between TAMRA-azide 15 and DBCO 1 was approximately 5-fold faster and proceeded with greater efficiency than the reaction with BCN 2 (Figure S15A,B and Table 4). These data suggest that both SPAAC and iEDDA ligations are compatible with different subcellular compartments.
Evaluation of SPAAC and iEDDA Reactions with Bioorthogonal TAMRA Fluorophores for Intracellular Imaging in the Nucleus
With the systematic evaluation of the bioorthogonal reactions in hand, we were in a position to evaluate the SPAAC and iEDDA reactions using our clickable reagents for the purpose of intracellular imaging in live cells. For the SPAAC reaction, HeLa cells expressing Halo-H2B-GFP were treated with either DBCO ligand 1 or BCN ligand 2, followed by reaction with a dose response of TAMRA-azide 15. Cells were imaged live after a 2 h washout period. Representative images for the reaction of BCN 2-Halo-H2B-GFP (Figure 6A) and DBCO 1-Halo-H2B-GFP (Figure 6B) conjugates with TAMRA-azide 15 are shown. Overall, we observed differences in the intensity of nuclear labeling consistent with our reaction rate data in live cells (Table 2). The rate enhancement observed with the HaloTag conjugate of DBCO 1 enabled significant reaction to be visualized with as little as 0.5 μM TAMRA-azide 15 and the reaction becomes saturated with optimal signal-to-noise levels with only 2 μM TAMRA-azide 15 (Figure 6B). In contrast, 10 μM TAMRA-azide 15 is required to visualize the reaction with BCN 2, and 25 μM 15 is necessary to achieve adequate signal-to-noise levels (Figure 6A). Background fluorescence becomes evident with 25 μM TAMRA-azide 15, and dominates at 100 μM 15 (Figure 6A, bottom panel). These data suggest that 25 μM is an upper limit to the amount of TAMRA-azide 15 that can be successfully used for these live-cell imaging studies.
Figure 6.

Confocal images of the SPAAC and iEDDA reactions of clickable BCN 2-, DBCO 1-, and TCO 4-HaloTag conjugates with clickable TAMRA fluorophores in live cells expressing Halo-H2B-GFP. Halo-H2B-GFP was labeled with 10 μM BCN 2 (A), DBCO 1 (B), or TCO 4 (C) chloroalkane ligands for 30 min, followed by reaction with a dose response of TAMRA-azide 15 (SPAAC, A-B) or TAMRA-Tz 13 (iEDDA, C) for 30 min at 37 °C and imaged live after a 2 h washout period. Total nuclei were visualized with Hoescht 33342 and are shown in blue (column 1 on the left). Cells expressing Halo-H2B-GFP are shown in green (column 2). TAMRA-labeled nuclei from click chemistry are shown in red (column 3). Overlays were created between green and red channels to demonstrate colocalization (yellow) between transfection and bioorthogonal chemistry (column 4). All images were collected under identical parameters on the same day. Scale bar = 20 μm.
For iEDDA reactions, HeLa cells expressing Halo-H2B-GFP were treated with chloroalkane TCO ligand 4 followed by reaction with a dose response of TAMRA-Tz 13 (Figure 6C) for 30 min, and imaged live after a 2 h washout. For iEDDA reaction with 13, we observed a direct correlation between our in-gel fluorescence analysis and imaging, with significant signal observed using 0.5 μM TAMRA-Tz 13 and optimal signal-to-noise levels using 2 μM TAMRA-Tz 13. Background labeling dominated when 10 μM TAMRA-Tz 13 was used (Figure 6C, bottom panel), suggesting lower concentrations (≤2 μM) should be used for live-cell imaging studies in mammalian cells. Here, we also examined the reverse bioorthogonal group pairing where Tz ligand 10 or Tz-Me ligand 11 was incorporated into Halo-H2B-GFP as the tag, and TAMRA-TCO 18 served as the fluorescent reporter (Figure S16). We observed labeling with a low dose of TAMRA-TCO (0.1 μM), but the labeling did not increase in a dose proportionate fashion when up to 25 μM TAMRA-TCO 18 was used on the Tz 10 conjugate of Halo-H2B-GFP (Figure S16A). This data suggests that the monosubstituted Tz 10 is not stable in the cells and a proportion decomposes before reacting with TAMRA-TCO 18. In contrast, the less reactive Me-Tz 11 HaloTag conjugate behaved differently. No reaction with Me-Tz 11 was observed when 0.1 μM TAMRA-TCO 18 was used; however, significant labeling was seen with 2 μM 18 and the reaction appeared to reach saturation when 10 μM 18 was used with good colocalization (Figure S16B). This data is consistent with the results from the in-gel fluorescence analysis where the reaction of the Tz-Me 11 HaloTag conjugate retained high efficiency when incubated with TAMRA-TCO 18, while the reaction of the Tz 10 conjugate was less efficient (Figure S11). It is also worthwhile to note that very little background fluorescent labeling or nonspecific fluorophore accumulation was observed with TAMRA-TCO 18, even up to 25 μM (Figure S16). This is also consistent with the low background observed based on in-gel fluorescence data (Figure S12B). These observations highlight how TCO-based reporters not only provide excellent reactivity, but also label tetrazine-tagged proteins with high selectivity.
Evaluation of SPAAC and iEDDA Reactions with Bioorthogonal Fluorescein and BODIPY-FL Fluorophores for Intracellular Imaging in Different Organelles
We next explored the SPAAC and iEDDA ligations in different organelles using two green fluorophores amenable to intracellular imaging: BODIPY-FL and Fluorescein (Fl). HeLa cells were transfected with the intracellular organelle-targeting constructs for HaloTag expression in the nucleus (Halo-H2B-mCherry), and ER (Halo-KDEL-mCherry). For the SPAAC ligations, HaloTag protein was labeled with BCN ligand 2 followed by reaction with the green cell-permeable fluorophores, fluorescein-dipivalate-azide (Fl-diPiv-azide) 19 (Figure 7) and BODIPY-FL-azide 23 (Figure S17). Here, we observed significant background fluorescence for both 19 and 23, even after a 2 h washout. Fl-diPiv-azide 19 signal appeared to be present diffusely throughout the cytosol and nucleus of live cells (Figure 7A,B, top panels). This background accumulation is likely due to the high concentration of fluorophore needed to effectively promote the SPAAC reactions, resulting in trapping of negatively charged fluorescein once the pivaloyl groups have been removed by endogenous esterases inside the cell. This limits passive diffusion of unreacted fluorophore out of the cell during the washout stage due to lower membrane permeability. Fixing the cells in MeOH completely removed background, and revealed selective labeling in both the nucleus (Figure 7A, bottom panel) and ER (Figure 7B, bottom panel). BODIPY-FL-azide 23 displayed a different pattern of nonspecific accumulation, with high concentrations of unreacted fluorophore that appeared to accumulate in organelles (Figure S17A,B, top panels). This background was not completely removed after fixation (Figure S17A,B, bottom panels), suggesting that BODIPY-FL-azide 23 may not be as useful for intracellular imaging.
Figure 7.

Confocal images of the SPAAC and iEDDA reactions between clickable HaloTag conjugates and clickable fluorescein derivatives in different subcellular organelles. (A) Confocal images of nuclei expressing Halo-H2B-mCherry labeled with BCN 2 followed by SPAAC reaction with 50 μM Fl-diPiv-azide 19 for 1 h under live (top panel) and MeOH fixed (bottom panel) conditions. Total nuclei were visualized with Hoescht 33342 and are shown in blue (column 1 on left). Cells expressing mCherry are shown in red (column 2). Fluorophore-labeled proteins from click chemistry are shown in green (column 3). Overlays were created between red, green, and blue channels to demonstrate colocalization (yellow) between transfection and bioorthogonal chemistry (column 4). (B) Confocal images of the ER expressing Halo-KDEL-mCherry labeled with BCN 2 followed by SPAAC reaction with 50 μM Fl-diPiv-azide 19 for 1 h under live (top panel) and MeOH fixed (bottom panel) conditions. (C) Confocal images of nuclei expressing Halo-H2B-mCherry labeled with TCO 4 followed by iEDDA reaction with 1 μM Fl-diAc-Tz 20 for 1 h. (D) Confocal images of the ER expressing Halo-KDEL-mCherry labeled with TCO 4 followed by iEDDA reaction with 1 μM Fl-diAc-Tz 20 for 1 h. (E) Confocal images of the cytoplasm/nucleus expressing Halo-mCherry labeled with TCO 4 followed by iEDDA reaction with 1 μM Fl-diAc-Tz 20 for 1 h. (F) Confocal images of cell surface expressing Halo-mCherry-PDGFR labeled with TCO 4 followed by iEDDA reaction with cell-impermeable Fl-Tz 21. All images were acquired after a 2 h washout period. Scale bar = 20 μm.
We also evaluated iEDDA reactions in the nucleus (Halo-H2B-mCherry), ER (Halo-KDEL-mCherry), cytosol (Halo-mCherry), and at the extracellular face of the plasma membrane (Halo-mCherry-PDGFR). HeLa cells expressing the intracellular constructs were labeled with TCO HaloTag ligand 4, followed by reaction with 1 μM fluorescein-diacetate-Tz (Fl-diAc-Tz) 20 (Figure 7C–E) or BODIPY-FL-Tz 22 (Figure S17C–F) for 30 min. Tetrazines have been reported to quench the fluorescence of some fluorophores, resulting in turn-on fluorescence upon reaction with trans-cyclooctenes.91 Therefore, we initially attempted to image subcellular compartments without a washout step prior to imaging in live cells using these “turn-on” tetrazine-linked fluorescein- and BODIPY-FL fluorophores. However, the background fluorescence we observed was too high to distinguish specific labeling (data not shown). This is in part due to stability issues with the tetrazine which can lead to fluorescent impurities (i.e., see Table S2 for stability of TAMRA-Tz 13 in HeLa cells).70,92 Fluorophore-tetrazines with >1000-fold fluorescence increases have recently been developed, and these may provide better tools for intracellular iEDDA imaging in live cells with no washout period.70,71 Following a 2 h washout, we were able to observe selective labeling with no visible background for both Fl-diAc-Tz 20 and BODIPY-FL-Tz 22 in the nucleus (Figure 7C and S17C), ER (Figure 7D and S17D), and cytosol (Figure 7E and S17E). In addition, we demonstrated selective extracellular labeling with cell-impermeable fluorescein-Tz (Fl-Tz) 21 (Figure 7F), whereas cell-permeable BODIPY-FL-Tz 22 labeled both intracellular (present in the secretory pathway) and extracellular Halo-mCherry-PDGFR (Figure S17F), demonstrating that iEDDA reactions are successful for both intracellular and extracellular labeling. Of note, Fl-Tz 21 is amenable to selective extracellular labeling, even when the bioorthogonal reaction partner is present intracellularly.
On the basis of these studies, the cell-permeable iEDDA fluorophore-tetrazines at the concentrations tested here exhibit excellent properties for live-cell intracellular imaging experiments in all the organelles tested, whereas the high concentrations of fluorophore-azides required for efficient SPAAC labeling are not ideal for live-cell imaging and cells need to be fixed to remove background fluorescence.
Rapid Intracellular Imaging with Conformationally Strained trans-Cyclooctenes Using the iEDDA Reaction
Finally, we evaluated the fastest iEDDA reactions observed in this work, for rapid labeling in the nucleus at low fluorophore concentrations. Here, we analyzed a dose response of TAMRA-Tz 13 after 5 min of incubation with the Ag-sTCO 6-Halo-H2B-GFP and dTCO 7-Halo-H2B-GFP conjugates compared to the TCO 4-Halo-H2B-GFP conjugate. Reactions were quenched for 5 min with 100 μM Tz-amine 27 (Figure S3), and imaged after a 1 h washout period. Here, we observed some signal for both Ag-sTCO 6-Halo (Figure 8A) and dTCO 7-Halo (Figure 8B) conjugates at 100 nM after 5 min (top row), with significant labeling and excellent signal-to-noise levels at 1 μM (third row). Furthermore, labeling intensity increased with increasing fluorophore concentration, and appeared to saturate with 1–5 μM TAMRA-Tz 13 within the 5 min incubation (Figure 8A and 8B). In contrast, we needed ∼10-fold more fluorophore to see any signal with TCO 4-Halo (Figure 8C), further highlighting the superiority of the Ag-sTCO and dTCO reagents over TCO for rapid intracellular live-cell imaging.
Figure 8.

Rapid intracellular imaging of iEDDA reactions in live HeLa cells. Halo-H2B-GFP expressing HeLa cells were labeled with HaloTag chloroalkane ligands TCO 4, dTCO 7, or Ag-sTCO 6 followed by reaction with a dose response of TAMRA-Tz 13 for 5 min at 37 °C. Reactions were quenched with Tz-amine 27 followed by a 1 h washout prior to imaging. Cells were imaged live under identical parameters and representative images are shown for Ag-sTCO 6-Halo (A), dTCO 7-Halo (B), and TCO 4-Halo (C). Total nuclei were visualized with Hoescht 33342 and are shown in blue (column 1 on left). Cells expressing Halo-H2B-GFP are shown in green (column 2). TAMRA-labeled nuclei from click chemistry are shown in red (column 3). Overlays were created between red and green channels to demonstrate colocalization (yellow) between transfection and bioorthogonal chemistry (column 4). Scale bar = 20 μm.
Conclusions
Overall, our HaloTag model system provides a unique and unbiased method to systematically evaluate bioorthogonal labeling strategies directly inside living mammalian cells, as well as in different subcellular organelles. Using this approach, we were able to rapidly assess various bioorthogonal groups for fast, efficient, and selective SPAAC and iEDDA ligations for live-cell imaging applications. While the SPAAC reactions were slower overall, we were still able to identify conditions for intracellular live-cell imaging studies using TAMRA fluorophores for both BCN and DBCO. However, in many cases the high fluorophore concentrations required for live-cell labeling studies limits the fluorophore selection due to background fluorescence accumulation. Unexpectedly, we discovered that the SPAAC reaction of DBCO 1 when conjugated to HaloTag proteins was nearly as rapid as the iEDDA reaction with slower dienophiles, TCO and BCN, in different subcellular organelles of live cells. This rate acceleration allowed the use of lower concentrations of the fluorophore-azide reporter and suggests that this SPAAC reaction may have utility for intracellular imaging applications where DBCO is used as a tag. When DBCO was linked to the reporter, we observed extensive background labeling at the high concentrations required for the SPAAC reaction, limiting its use in these instances.
For the first time, proteins have been tagged in living mammalian cells with sTCO and dTCO, which when reacted with tetrazines constitutes the fastest bioorthogonal coupling reaction known to date. Our studies clearly demonstrate that iEDDA ligations are the fastest reactions in multiple cellular compartments of live cells, enabling reaction completion within minutes when selecting the fastest dienophiles, sTCO and dTCO. Previous attempts to tag proteins with sTCO or dTCO using genetically encoded amino acids or lipoic acid ligase have been unsuccessful.14,31 Here, we demonstrate that protein conjugates can be made in living mammalian cells using Halotag ligands of both sTCO (5, 6) and dTCO (7). The intracellular stability of sTCO and dTCO was organelle dependent, with significant loss of reactivity in the nucleus after 24 h, but high stability in the ER over 24 h. Thus, while conformationally strained trans-cyclooctenes display remarkable kinetics, their utility as tagging molecules is somewhat tempered by their organelle-dependent stability. The impact is somewhat alleviated because the major side reaction is isomerization to the unreactive cis-isomer which appears to be “silent” in the cells. In contrast, cyclooctynes can undergo covalent modification with cysteine and other thiol-containing biomolecules which can lead to issues associated with nonspecific background labeling. Another advantage of iEDDA reactions with trans-cyclooctenes is that efficient labeling can be achieved using low concentrations of fluorophore-tetrazines, thereby reducing the chance for nonspecific fluorophore accumulation and labeling in live cells, an issue which is present with the high fluorophore concentrations required for SPAAC reactions or iEDDA reactions with less reactive dienophiles.
The modest shelf life of sTCO has also limited its usefulness. We observed degradation when sTCO was stored neat or as a DMSO stock solution. In addition, freeze–thawing of stock solutions led to decomposition/isomerization, and we found it was best to prepare single-use frozen aliquots to prevent freeze–thaw decomposition. We addressed the shelf life issue by making a stable Ag-sTCO complex and demonstrated that it can be used directly in cells for reaction with tetrazine-linked fluorophores. This silver complex has been stored as a stock solution in ethanol for 8 months at −20 °C without any observable loss of reactivity.
To date, most cell-labeling studies involving iEDDA have focused on use of tetrazines as reporter molecules with strained alkenes and alkynes as the tags. In a “reversed” approach, our data shows that methyl-tetrazine tag 14 could be used as the protein tag in labeling studies with TAMRA-TCO 18 as the reporter. Moving forward, we expect there will be considerable advantages to utilizing stable tetrazine tags with the more reactive conformationally strained sTCO or dTCO based reporters. We are presently preparing Ag-sTCO and Ag-dTCO fluorescent reporters for this purpose and results will be disclosed in due course. Further expansion of the suite of stable tetrazines with reduced size and good solubility is also an important goal to enhance their utility as tagging molecules.
The selection of an appropriate bioorthogonal labeling strategy for a given application is a difficult task, requiring multiple considerations to minimally perturb the system of interest. We hope these investigations will help provide guidance for selecting the appropriate reaction and reagents for various live-cell imaging applications. We believe it can also serve as a platform to evaluate new bioorthogonal reactions5,93,94 where one could easily prepare HaloTag ligands of newly developed bioorthogonal groups to evaluate the chemistry in live cells and within the various intracellular organelles. The development of improved fluorophores is also an exciting area of research.50,95 This platform is ideally suited to help evaluate and optimize new fluorophores including fluorogenic fluorophores for no-wash live-cell imaging71,92,96 as well as fluorophores for super-resolution imaging.41,97,98
Experimental Section
Materials and Methods
Synthesis of chloroalkane HaloTag ligands 1–11 and bioorthogonal fluorophores are described in the Supporting Information. All reagents were purchased from Sigma-Aldrich unless otherwise noted.
Molecular Cloning
N-Terminal HaloTag ORF fusion protein plasmids in pFN21A mammalian expression vector were purchased for targeted HaloTag expression in the lumen of the endoplasmic reticulum (human KDELR3; Promega FHC05579), nucleus (human HIST1H2BK; Promega FHC05625), and cytosol (human GAP43; Promega FHC02950). KDELR3, HIST1H2BK, and GAP43 plasmids were cut with PmeI/NotI, and ligated to a NotI/SmaI fragment of either EGFP (pEGFP-N1, Clontech) or mCherry (pmCherry-N1, Clontech) to create fluorescent protein tags on each construct.
The C-terminal HaloTag ORF pHTN mammalian expression vector was purchased from Promega (G772A). A cytosolic/nuclear expressed Halo-mCherry fusion construct was generated by ligating an NheI/EcoRV Halo fragment into pmCherry-N1 (Clontech) mammalian expression vector, cut with NheI/PspOMI (blunt filled). For extracellular HaloTag protein expression (Halo-mCherry-PDGFR), a construct was generated by ligating a synthetic, stop codon eliminated Halo-mCherry fusion to the transmembrane domain of the PDGFR in the pDisplay vector (Invitrogen/LifeTechnologies catalog #V660–20) at the restriction sites BglII/PstI. A (Ser-Gly-Gly-Gly)9 bridge was synthesized between Halo and mCherry.
HeLa Cell Culture and Transfection
HeLa cells were maintained in growth media containing Dulbecco’s modified eagle medium (DMEM, Life Technologies) supplemented with 10% (v:v) heat inactivated FBS (Life Technologies), 100 units/mL penicillin and streptomycin (Life Technologies), and 10 mM Hepes (Life Technologies) in a humidified incubator set at 37 °C/5% CO2. HeLa cells were transfected with a 3:1 ratio of lipofectamine 2000 (Life Technologies):DNA according to the manufacturer’s protocol in antibiotic-free DMEM/10% FBS at 80–90% confluence. Cells were incubated for 3 h at 37 °C/5% CO2 and media was changed into growth media for 16–20 h prior to HaloTag labeling experiments.
Preparation of Clickable HaloTag Ligand and Fluorophore Stock Solutions
HaloTag Ligands 1–11 were prepared as 10 mM stocks (1000×) in anhydrous DMSO within 1-week of NMR confirmation of ligand structure. Stocks were frozen as single-use aliquots at −20 °C, and kept for up to 6 months due to stability issues. sTCO ligand 5 and cyclopropene ligand 9 were especially unstable, and required constant monitoring and resynthesis. Ag-sTCO ligand 6 was prepared as a 10 mM stock in EtOH, and maintained stability over at least 8 months when stored at −20 °C. Fluorophore tetrazine derivatives were prepared as 10 mM stocks in anhydrous DMSO, and serially diluted to 1000× working stocks. Solutions were frozen at −20 °C and remained stable up to 3 freeze–thaw cycles. Strained alkyne and azide fluorophores were prepared as 100 mM stock solutions in anhydrous DMSO, and frozen as 1000× working stocks at −20 °C. Aliquots were used up to 3 times before disposal without any loss of reactivity. TCO-TAMRA fluorophore was prepared as a 10 mM stock in anhydrous DMSO, aliquoted, and stored at −20 °C as single-use aliquots.
Labeling of HaloTag Fusion Proteins with Bioorthogonal Ligands and Evaluation of SPAAC and iEDDA Reactions in Live Cells
HeLa cells expressing HaloTag constructs were treated in 6-well dishes with 1 mL of 10 μM HaloTag ligands 1–12 in growth media for 0.5 h at 37 °C/5% CO2. Samples labeled with 12 served as a positive control to determine the maximum amount of HaloTag protein labeling per experiment. Cells were washed three times in DPBS and incubated in 2 mL new media for 1 h with one media change to remove unbound HaloTag ligands. For SPAAC reactions, HeLa cells were labeled with chloroalkane ligands 1–3 followed by either a dose response of 50 nM to 250 μM fluorophores 15–17 for 2 h, or a timecourse of 25 μM fluorophore for 30 s to 4 h in growth media. Reactions were immediately quenched by washing cells two times in 500 μM azide-amine 24, DBCO-amine 26 (Click Chemistry Tools), or BCN-amine 25 in PBS (SPAAC Quench buffer). For iEDDA, HeLa cells labeled with chloroalkane ligands 2, and 4–11 were treated with either a dose response from 1 nM-20 μM fluorophores 13, 14, 17, and 18 for 1 h, or a timecourse of 2 μM fluorophore for 10 s-2 h in growth media. Cells were quenched by washing two times in 100 μM Tz-amine 27 (Click Chemistry Tools) or TCO-amine 28 in PBS (iEDDA Quench buffer). Cells were scraped in 1 mL quench buffer, spun at 2000g for 3 min, the buffer was aspirated and cell pellets were immediately frozen on dry ice.
HeLa Cell Lysis, SDS-PAGE, In-Gel Fluorescence, and Western Blotting
For SPAAC, cell pellets were lysed by sonication in 100 μL 1% SDS/SPAAC quench buffer. For iEDDA, cell pellets were lysed by sonication in 100 μL 1% SDS/iEDDA quench buffer. Protein concentrations were determined with a BCA protein assay (Thermo-Fisher) and cell lysates were normalized by protein concentration. Samples were prepared in 1× LDS sample buffer (Life Technologies), with 10 μg protein loaded per well, and separated by SDS-PAGE on NuPage 4–12% Bis-Tris gels in MES running buffer (Life Technologies). TAMRA-fluorescence was analyzed on a Typhoon variable mode imager (GE Healthsciences) using a TAMRA filter. Gels were then transferred to nitrocellulose using iBLOT (Life Technologies), blocked in Odyssey blocking buffer (LiCor) for 1 h at RT, and incubated in anti-HaloTag pAb (Promega, G9281) at 1:2000 overnight in TBST. Membranes were washed 3 times in TBST, and incubated in goat anti-rabbit IRDye 800CW (LiCor) at 1:10,000 in TBST for 1 h at RT. Membranes were washed three times in TBST and imaged on the Odyssey Infrared Imager (LiCor).
Data Quantification
Fluorescence intensity measurements were quantified in ImageJ 1.45 (NIH) for both TAMRA fluorescence and total HaloTag protein expression. In-gel fluorescence (TAMRA) signal first was normalized to total HaloTag protein expression signal (Western blot). The positive TAMRA-control (ligand 12) was set at 100% for each experiment. SPAAC and iEDDA data were normalized to this value, and reported as a percent of control. Data from 3 to 6 independent replicates were quantified and plotted as the log[dose] vs response for generation of EC50 values. Curves were fit using a four parameter dose–response curve in GraphPad Prism version 6.03 for Windows, GraphPad Software, La Jolla California USA, www.graphpad.com. For timecourse experiments, data was plotted as the percent of control vs time and fit with pseudo-first order association kinetics where Y = Y0 + (Plateau – Y0)(1 – exp(−Kx)) where the Plateau = Emax and K = rate constant expressed as the reciprocal of x in units. Y0 was set as a constant = 0. All data is reported as the mean ± SEM from 3 to 6 independent replicates.
Pulse-Chase Analysis of HaloTag Ligand Incorporation into HaloTag Protein
HeLa cells expressing Halo-H2B-GFP were treated with 10 μM HaloTag ligands 1–12 for 30 min in growth media at 37 °C/5% CO2, washed three times with PBS, and incubated for 1 h in growth media with one media change to remove unbound HaloTag ligand. Samples were treated with 1 μM HaloTag ligand 12 for 10 min at 37 °C/5% CO2, washed three times with PBS and processed as described after lysis in 100 μL 1% SDS with sonication.
Analysis of the Stability of TCO Derivatives in the Nucleus and ER of Live HeLa Cells
HeLa cells transfected with Halo-H2B-GFP (nucleus) or Halo-KDEL (ER) were analyzed for dienophile stability. Cells treated with 10 μM HaloTag ligands 4–7 and 12 were incubated in DMEM/10% FBS for 0.5 h followed by a 1 h washout period prior to reaction with TAMRA-tetrazine 13 at 37 °C/5% CO2. HeLa cells were incubated with a saturating dose of 2 μM 5-TAMRA-tetrazine 13 for 1 h at 37 °C/5% CO2 at the indicated time points. Cells were washed with PBS, scraped in 1 mL PBS, pelleted at 2000g for 3 min, and processed as described previously for in-gel fluorescence. Each time point contained 12 as a control to account for labeled HaloTag protein degradation during the course of the experiment.
Evaluation of SPAAC and iEDDA Reactions for Live/Fixed Cell Imaging
HeLa cells were plated on poly-lysine coated glass-bottom dishes (MatTek, P35GC-1.5–14C), transfected, and treated as described for in-gel fluorescence with the following modifications. Following fluorophore incubation in culture media, cells were washed 3 × 1 mL PBS with the appropriate quench reagent, and quenched for an additional 5 min in media. Cells were washed 3 × 1 mL media to remove quench reagent and incubated in cell culture media for 1–2 h prior to imaging. Cells were washed one time in phenol red-free DMEM (Life Technologies)/10% FBS, and media was replaced with phenol-red free DMEM/10% FBS supplemented with 10 μg/mL Hoescht 33342 (Life Technologies, H3570) for nuclear labeling 5 min prior to imaging live. For fixed-cell imaging, cells were fixed in ice-cold MeOH for 10 min, washed 3 × 1 mL PBS and incubated in 1 mL PBS overnight at 4 °C. PBS was aspirated and 100 μL VECTASHIELD (Vector Laboratories) cell mounting media containing DAPI (Vector Laboratories, H-1200) was added prior to imaging.
Fluorescence Microscopy
Live and fixed cells were imaged on a Zeiss AxioObserver.Z1 with a Yokagawa CSU-X1M 5000 spinning disk system using a Zeiss PlanApochromatic 40×/1.3 or 63×/1.4 oil immersion objectives. The imaging system was maintained in a 37 °C heated incubation chamber along with humidified stage-top incubation components set at 37 °C/5% CO2 for live-cell imaging. Excitation of Hoescht and DAPI was carried out with a 405 nm laser and emission spectra were collected between 440 and 480 nM. Excitation of fluorescein, BODIPY-FL, and eGFP was carried out using a 488 nm laser and emission spectra were collected between 520 and 550 nm. TAMRA and mCherry were excited with a 561 nm laser and emission spectra were collected between 620 and 670 nm. Images were acquired using a Photometrics Evolve 512 Delta camera using the appropriate filter conditions for the indicated fluorophores with the ZEN Blue 2012 v. 8.1 software (Carl Zeiss Microscopy).
Acknowledgments
This work was supported by NIH Grant R01EB014354 from NIBIB. Spectra were obtained with instrumentation supported by NIH P20GM104316, P30GM110758, S10RR026962-01, S10OD016267-01 and NSF grants CHE 0840401 and CHE-1229234. We would like to thank Kay Ahn and Jemy Gutierrez for valuable discussions, Katherine Hales for assistance with confocal microscopy, and Shannon Cawley and Brendon Kapinos for LC–MS sample analysis.
Supporting Information Available
The Supporting Information is available free of charge on the ACS Publications website at DOI: 10.1021/jacs.5b06847.
Supporting figures and synthetic methods. (PDF)
Author Present Address
# Janssen Pharmaceutical Companies of Johnson & Johnson, Molecular and Cellular Pharmacology Department, 1400 McKean Road, Spring House, Pennsylvania 19002, United States.
The authors declare no competing financial interest.
Supplementary Material
References
- Prescher J. A.; Bertozzi C. R. Nat. Chem. Biol. 2005, 1, 13. 10.1038/nchembio0605-13. [DOI] [PubMed] [Google Scholar]
- Sletten E. M.; Bertozzi C. R. Angew. Chem., Int. Ed. 2009, 48, 6974. 10.1002/anie.200900942. [DOI] [PMC free article] [PubMed] [Google Scholar]
- Ramil C. P.; Lin Q. Chem. Commun. (Cambridge, U. K.) 2013, 49, 11007. 10.1039/c3cc44272a. [DOI] [PMC free article] [PubMed] [Google Scholar]
- Lang K.; Chin J. W. ACS Chem. Biol. 2014, 9, 16. 10.1021/cb4009292. [DOI] [PubMed] [Google Scholar]
- Patterson D. M.; Nazarova L. A.; Prescher J. A. ACS Chem. Biol. 2014, 9, 592. 10.1021/cb400828a. [DOI] [PubMed] [Google Scholar]
- Johnson D. S.; Weerapana E.; Cravatt B. F. Future Med. Chem. 2010, 2, 949. 10.4155/fmc.10.21. [DOI] [PMC free article] [PubMed] [Google Scholar]
- Lanning B. R.; Whitby L. R.; Dix M. M.; Douhan J.; Gilbert A. M.; Hett E. C.; Johnson T. O.; Joslyn C.; Kath J. C.; Niessen S.; Roberts L. R.; Schnute M. E.; Wang C.; Hulce J. J.; Wei B.; Whiteley L. O.; Hayward M. M.; Cravatt B. F. Nat. Chem. Biol. 2014, 10, 760. 10.1038/nchembio.1582. [DOI] [PMC free article] [PubMed] [Google Scholar]
- Yamaura K.; Kuwata K.; Tamura T.; Kioi Y.; Takaoka Y.; Kiyonaka S.; Hamachi I. Chem. Commun. (Cambridge, U. K.) 2014, 50, 14097. 10.1039/C4CC05885B. [DOI] [PubMed] [Google Scholar]
- Evans M. J.; Saghatelian A.; Sorensen E. J.; Cravatt B. F. Nat. Biotechnol. 2005, 23, 1303. 10.1038/nbt1149. [DOI] [PubMed] [Google Scholar]
- Weerapana E.; Simon G. M.; Cravatt B. F. Nat. Chem. Biol. 2008, 4, 405. 10.1038/nchembio.91. [DOI] [PMC free article] [PubMed] [Google Scholar]
- Lapinsky D. J. Bioorg. Med. Chem. 2012, 20, 6237. 10.1016/j.bmc.2012.09.010. [DOI] [PubMed] [Google Scholar]
- Pozdnyakov N.; Murrey H. E.; Crump C. J.; Pettersson M.; Ballard T. E.; Am Ende C. W.; Ahn K.; Li Y. M.; Bales K. R.; Johnson D. S. J. Biol. Chem. 2013, 288, 9710. 10.1074/jbc.M112.398602. [DOI] [PMC free article] [PubMed] [Google Scholar]
- Fernandez-Suarez M.; Baruah H.; Martinez-Hernandez L.; Xie K. T.; Baskin J. M.; Bertozzi C. R.; Ting A. Y. Nat. Biotechnol. 2007, 25, 1483. 10.1038/nbt1355. [DOI] [PMC free article] [PubMed] [Google Scholar]
- Liu D. S.; Tangpeerachaikul A.; Selvaraj R.; Taylor M. T.; Fox J. M.; Ting A. Y. J. Am. Chem. Soc. 2012, 134, 792. 10.1021/ja209325n. [DOI] [PMC free article] [PubMed] [Google Scholar]
- Yao J. Z.; Uttamapinant C.; Poloukhtine A.; Baskin J. M.; Codelli J. A.; Sletten E. M.; Bertozzi C. R.; Popik V. V.; Ting A. Y. J. Am. Chem. Soc. 2012, 134, 3720. 10.1021/ja208090p. [DOI] [PMC free article] [PubMed] [Google Scholar]
- Wollack J. W.; Monson B. J.; Dozier J. K.; Dalluge J. J.; Poss K.; Hilderbrand S. A.; Distefano M. D. Chem. Biol. Drug Des. 2014, 84, 140. 10.1111/cbdd.12303. [DOI] [PMC free article] [PubMed] [Google Scholar]
- Rashidian M.; Keliher E. J.; Bilate A. M.; Duarte J. N.; Wojtkiewicz G. R.; Jacobsen J. T.; Cragnolini J.; Swee L. K.; Victora G. D.; Weissleder R.; Ploegh H. L. Proc. Natl. Acad. Sci. U. S. A. 2015, 112, 6146. 10.1073/pnas.1502609112. [DOI] [PMC free article] [PubMed] [Google Scholar]
- Grammel M.; Hang H. C. Nat. Chem. Biol. 2013, 9, 475. 10.1038/nchembio.1296. [DOI] [PMC free article] [PubMed] [Google Scholar]
- Murrey H. E.; Hsieh-Wilson L. C. Chem. Rev. 2008, 108, 1708. 10.1021/cr078215f. [DOI] [PMC free article] [PubMed] [Google Scholar]
- Cecioni S.; Vocadlo D. J. Curr. Opin. Chem. Biol. 2013, 17, 719. 10.1016/j.cbpa.2013.06.030. [DOI] [PubMed] [Google Scholar]
- Ngo J. T.; Tirrell D. A. Acc. Chem. Res. 2011, 44, 677. 10.1021/ar200144y. [DOI] [PMC free article] [PubMed] [Google Scholar]
- Hannoush R. N.; Sun J. Nat. Chem. Biol. 2010, 6, 498. 10.1038/nchembio.388. [DOI] [PubMed] [Google Scholar]
- Hang H. C.; Wilson J. P.; Charron G. Acc. Chem. Res. 2011, 44, 699. 10.1021/ar200063v. [DOI] [PMC free article] [PubMed] [Google Scholar]
- Yang Y. Y.; Ascano J. M.; Hang H. C. J. Am. Chem. Soc. 2010, 132, 3640. 10.1021/ja908871t. [DOI] [PMC free article] [PubMed] [Google Scholar]
- Wang R.; Luo M. Curr. Opin. Chem. Biol. 2013, 17, 729. 10.1016/j.cbpa.2013.08.007. [DOI] [PMC free article] [PubMed] [Google Scholar]
- Liu C. C.; Schultz P. G. Annu. Rev. Biochem. 2010, 79, 413. 10.1146/annurev.biochem.052308.105824. [DOI] [PubMed] [Google Scholar]
- Lang K.; Chin J. W. Chem. Rev. 2014, 114, 4764. 10.1021/cr400355w. [DOI] [PubMed] [Google Scholar]
- Bunnage M. E.; Chekler E. L.; Jones L. H. Nat. Chem. Biol. 2013, 9, 195. 10.1038/nchembio.1197. [DOI] [PubMed] [Google Scholar]
- Simon G. M.; Niphakis M. J.; Cravatt B. F. Nat. Chem. Biol. 2013, 9, 200. 10.1038/nchembio.1211. [DOI] [PMC free article] [PubMed] [Google Scholar]
- Schulke J. P.; McAllister L. A.; Geoghegan K. F.; Parikh V.; Chappie T. A.; Verhoest P. R.; Schmidt C. J.; Johnson D. S.; Brandon N. J. ACS Chem. Biol. 2014, 9, 2823. 10.1021/cb500671j. [DOI] [PubMed] [Google Scholar]
- Selvaraj R.; Fox J. M. Curr. Opin. Chem. Biol. 2013, 17, 753. 10.1016/j.cbpa.2013.07.031. [DOI] [PMC free article] [PubMed] [Google Scholar]
- Darko A.; Wallace S.; Dmitrenko O.; Machovina M. M.; Mehl R. A.; Chin J. W.; Fox J. M. Chemical Science 2014, 5, 3770. 10.1039/C4SC01348D. [DOI] [PMC free article] [PubMed] [Google Scholar]
- Keppler A.; Gendreizig S.; Gronemeyer T.; Pick H.; Vogel H.; Johnsson K. Nat. Biotechnol. 2003, 21, 86. 10.1038/nbt765. [DOI] [PubMed] [Google Scholar]
- Keppler A.; Pick H.; Arrivoli C.; Vogel H.; Johnsson K. Proc. Natl. Acad. Sci. U. S. A. 2004, 101, 9955. 10.1073/pnas.0401923101. [DOI] [PMC free article] [PubMed] [Google Scholar]
- Los G. V.; Encell L. P.; McDougall M. G.; Hartzell D. D.; Karassina N.; Zimprich C.; Wood M. G.; Learish R.; Ohana R. F.; Urh M.; Simpson D.; Mendez J.; Zimmerman K.; Otto P.; Vidugiris G.; Zhu J.; Darzins A.; Klaubert D. H.; Bulleit R. F.; Wood K. V. ACS Chem. Biol. 2008, 3, 373. 10.1021/cb800025k. [DOI] [PubMed] [Google Scholar]
- Tomat E.; Nolan E. M.; Jaworski J.; Lippard S. J. J. Am. Chem. Soc. 2008, 130, 15776. 10.1021/ja806634e. [DOI] [PMC free article] [PubMed] [Google Scholar]
- Srikun D.; Albers A. E.; Nam C. I.; Iavarone A. T.; Chang C. J. J. Am. Chem. Soc. 2010, 132, 4455. 10.1021/ja100117u. [DOI] [PMC free article] [PubMed] [Google Scholar]
- Seitchik J. L.; Peeler J. C.; Taylor M. T.; Blackman M. L.; Rhoads T. W.; Cooley R. B.; Refakis C.; Fox J. M.; Mehl R. A. J. Am. Chem. Soc. 2012, 134, 2898. 10.1021/ja2109745. [DOI] [PMC free article] [PubMed] [Google Scholar]
- Lang K.; Davis L.; Wallace S.; Mahesh M.; Cox D. J.; Blackman M. L.; Fox J. M.; Chin J. W. J. Am. Chem. Soc. 2012, 134, 10317. 10.1021/ja302832g. [DOI] [PMC free article] [PubMed] [Google Scholar]
- Nikic I.; Kang J. H.; Girona G. E.; Aramburu I. V.; Lemke E. A. Nat. Protoc. 2015, 10, 780. 10.1038/nprot.2015.045. [DOI] [PubMed] [Google Scholar]
- Lukinavicius G.; Umezawa K.; Olivier N.; Honigmann A.; Yang G.; Plass T.; Mueller V.; Reymond L.; Correa I. R. Jr.; Luo Z. G.; Schultz C.; Lemke E. A.; Heppenstall P.; Eggeling C.; Manley S.; Johnsson K. Nat. Chem. 2013, 5, 132. 10.1038/nchem.1546. [DOI] [PubMed] [Google Scholar]
- Dean K. M.; Palmer A. E. Nat. Chem. Biol. 2014, 10, 512. 10.1038/nchembio.1556. [DOI] [PMC free article] [PubMed] [Google Scholar]
- Nikic I.; Plass T.; Schraidt O.; Szymanski J.; Briggs J. A.; Schultz C.; Lemke E. A. Angew. Chem., Int. Ed. 2014, 53, 2245. 10.1002/anie.201309847. [DOI] [PubMed] [Google Scholar]
- Los G. V.; Wood K. Methods Mol. Biol. 2007, 356, 195. [DOI] [PubMed] [Google Scholar]
- Zhang Y.; So M. K.; Loening A. M.; Yao H.; Gambhir S. S.; Rao J. Angew. Chem., Int. Ed. 2006, 45, 4936. 10.1002/anie.200601197. [DOI] [PubMed] [Google Scholar]
- Watkins R. W.; Lavis L. D.; Kung V. M.; Los G. V.; Raines R. T. Org. Biomol. Chem. 2009, 7, 3969. 10.1039/b907664f. [DOI] [PMC free article] [PubMed] [Google Scholar]
- Lee H. L.; Lord S. J.; Iwanaga S.; Zhan K.; Xie H.; Williams J. C.; Wang H.; Bowman G. R.; Goley E. D.; Shapiro L.; Twieg R. J.; Rao J.; Moerner W. E. J. Am. Chem. Soc. 2010, 132, 15099. 10.1021/ja1044192. [DOI] [PMC free article] [PubMed] [Google Scholar]
- Lisse D.; Wilkens V.; You C.; Busch K.; Piehler J. Angew. Chem., Int. Ed. 2011, 50, 9352. 10.1002/anie.201101499. [DOI] [PubMed] [Google Scholar]
- Wilmes S.; Staufenbiel M.; Lisse D.; Richter C. P.; Beutel O.; Busch K. B.; Hess S. T.; Piehler J. Angew. Chem., Int. Ed. 2012, 51, 4868. 10.1002/anie.201200853. [DOI] [PubMed] [Google Scholar]
- Grimm J. B.; English B. P.; Chen J.; Slaughter J. P.; Zhang Z.; Revyakin A.; Patel R.; Macklin J. J.; Normanno D.; Singer R. H.; Lionnet T.; Lavis L. D. Nat. Methods 2015, 12, 244. 10.1038/nmeth.3256. [DOI] [PMC free article] [PubMed] [Google Scholar]
- Takemoto K.; Matsuda T.; McDougall M.; Klaubert D. H.; Hasegawa A.; Los G. V.; Wood K. V.; Miyawaki A.; Nagai T. ACS Chem. Biol. 2011, 6, 401. 10.1021/cb100431e. [DOI] [PubMed] [Google Scholar]
- Brigham J. L.; Perera B. G.; Maly D. J. ACS Chem. Biol. 2013, 8, 691. 10.1021/cb300623a. [DOI] [PMC free article] [PubMed] [Google Scholar]
- Krishnamurty R.; Brigham J. L.; Leonard S. E.; Ranjitkar P.; Larson E. T.; Dale E. J.; Merritt E. A.; Maly D. J. Nat. Chem. Biol. 2013, 9, 43. 10.1038/nchembio.1118. [DOI] [PMC free article] [PubMed] [Google Scholar]
- Neklesa T. K.; Tae H. S.; Schneekloth A. R.; Stulberg M. J.; Corson T. W.; Sundberg T. B.; Raina K.; Holley S. A.; Crews C. M. Nat. Chem. Biol. 2011, 7, 538. 10.1038/nchembio.597. [DOI] [PMC free article] [PubMed] [Google Scholar]
- Tae H. S.; Sundberg T. B.; Neklesa T. K.; Noblin D. J.; Gustafson J. L.; Roth A. G.; Raina K.; Crews C. M. ChemBioChem 2012, 13, 538. 10.1002/cbic.201100793. [DOI] [PMC free article] [PubMed] [Google Scholar]
- Debets M. F.; van Berkel S. S.; Dommerholt J.; Dirks A. T.; Rutjes F. P.; van Delft F. L. Acc. Chem. Res. 2011, 44, 805. 10.1021/ar200059z. [DOI] [PubMed] [Google Scholar]
- Sletten E. M.; Bertozzi C. R. Acc. Chem. Res. 2011, 44, 666. 10.1021/ar200148z. [DOI] [PMC free article] [PubMed] [Google Scholar]
- Devaraj N. K.; Weissleder R. Acc. Chem. Res. 2011, 44, 816. 10.1021/ar200037t. [DOI] [PMC free article] [PubMed] [Google Scholar]
- Seckute J.; Devaraj N. K. Curr. Opin. Chem. Biol. 2013, 17, 761. 10.1016/j.cbpa.2013.08.004. [DOI] [PMC free article] [PubMed] [Google Scholar]
- Ning X.; Guo J.; Wolfert M. A.; Boons G. J. Angew. Chem., Int. Ed. 2008, 47, 2253. 10.1002/anie.200705456. [DOI] [PMC free article] [PubMed] [Google Scholar]
- Debets M. F.; van Berkel S. S.; Schoffelen S.; Rutjes F. P.; van Hest J. C.; van Delft F. L. Chem. Commun. (Cambridge, U. K.) 2010, 46, 97. 10.1039/B917797C. [DOI] [PubMed] [Google Scholar]
- Jewett J. C.; Sletten E. M.; Bertozzi C. R. J. Am. Chem. Soc. 2010, 132, 3688. 10.1021/ja100014q. [DOI] [PMC free article] [PubMed] [Google Scholar]
- Dommerholt J.; Schmidt S.; Temming R.; Hendriks L. J.; Rutjes F. P.; van Hest J. C.; Lefeber D. J.; Friedl P.; van Delft F. L. Angew. Chem., Int. Ed. 2010, 49, 9422. 10.1002/anie.201003761. [DOI] [PMC free article] [PubMed] [Google Scholar]
- Blackman M. L.; Royzen M.; Fox J. M. J. Am. Chem. Soc. 2008, 130, 13518. 10.1021/ja8053805. [DOI] [PMC free article] [PubMed] [Google Scholar]
- Taylor M. T.; Blackman M. L.; Dmitrenko O.; Fox J. M. J. Am. Chem. Soc. 2011, 133, 9646. 10.1021/ja201844c. [DOI] [PMC free article] [PubMed] [Google Scholar]
- Devaraj N. K.; Weissleder R.; Hilderbrand S. A. Bioconjugate Chem. 2008, 19, 2297. 10.1021/bc8004446. [DOI] [PMC free article] [PubMed] [Google Scholar]
- Patterson D. M.; Nazarova L. A.; Xie B.; Kamber D. N.; Prescher J. A. J. Am. Chem. Soc. 2012, 134, 18638. 10.1021/ja3060436. [DOI] [PubMed] [Google Scholar]
- Yang J.; Seckute J.; Cole C. M.; Devaraj N. K. Angew. Chem., Int. Ed. 2012, 51, 7476. 10.1002/anie.201202122. [DOI] [PMC free article] [PubMed] [Google Scholar]
- Yang J.; Karver M. R.; Li W.; Sahu S.; Devaraj N. K. Angew. Chem., Int. Ed. 2012, 51, 5222. 10.1002/anie.201201117. [DOI] [PMC free article] [PubMed] [Google Scholar]
- Carlson J. C.; Meimetis L. G.; Hilderbrand S. A.; Weissleder R. Angew. Chem., Int. Ed. 2013, 52, 6917. 10.1002/anie.201301100. [DOI] [PMC free article] [PubMed] [Google Scholar]
- Meimetis L. G.; Carlson J. C.; Giedt R. J.; Kohler R. H.; Weissleder R. Angew. Chem., Int. Ed. 2014, 53, 7531. 10.1002/anie.201403890. [DOI] [PMC free article] [PubMed] [Google Scholar]
- Longmire M. R.; Ogawa M.; Hama Y.; Kosaka N.; Regino C. A.; Choyke P. L.; Kobayashi H. Bioconjugate Chem. 2008, 19, 1735. 10.1021/bc800140c. [DOI] [PMC free article] [PubMed] [Google Scholar]
- Cunningham C. W.; Mukhopadhyay A.; Lushington G. H.; Blagg B. S.; Prisinzano T. E.; Krise J. P. Mol. Pharmaceutics 2010, 7, 1301. 10.1021/mp100089k. [DOI] [PMC free article] [PubMed] [Google Scholar]
- Reddington S. C.; Tippmann E. M.; Jones D. D. Chem. Commun. (Cambridge, U. K.) 2012, 48, 8419. 10.1039/c2cc31887c. [DOI] [PubMed] [Google Scholar]
- Huber T.; Sakmar T. P. Chem. Biol. 2014, 21, 1224. 10.1016/j.chembiol.2014.08.009. [DOI] [PubMed] [Google Scholar]
- Borrmann A.; Milles S.; Plass T.; Dommerholt J.; Verkade J. M.; Wiessler M.; Schultz C.; van Hest J. C.; van Delft F. L.; Lemke E. A. ChemBioChem 2012, 13, 2094. 10.1002/cbic.201200407. [DOI] [PubMed] [Google Scholar]
- Chen W.; Wang D.; Dai C.; Hamelberg D.; Wang B. Chem. Commun. (Cambridge, U. K.) 2012, 48, 1736. 10.1039/C2CC16716F. [DOI] [PubMed] [Google Scholar]
- Karver M. R.; Weissleder R.; Hilderbrand S. A. Angew. Chem., Int. Ed. 2012, 51, 920. 10.1002/anie.201104389. [DOI] [PMC free article] [PubMed] [Google Scholar]
- Lang K.; Davis L.; Torres-Kolbus J.; Chou C.; Deiters A.; Chin J. W. Nat. Chem. 2012, 4, 298. 10.1038/nchem.1250. [DOI] [PMC free article] [PubMed] [Google Scholar]
- Plass T.; Milles S.; Koehler C.; Szymanski J.; Mueller R.; Wiessler M.; Schultz C.; Lemke E. A. Angew. Chem., Int. Ed. 2012, 51, 4166. 10.1002/anie.201108231. [DOI] [PubMed] [Google Scholar]
- Sachdeva A.; Wang K.; Elliott T.; Chin J. W. J. Am. Chem. Soc. 2014, 136, 7785. 10.1021/ja4129789. [DOI] [PMC free article] [PubMed] [Google Scholar]
- Karver M. R.; Weissleder R.; Hilderbrand S. A. Bioconjugate Chem. 2011, 22, 2263. 10.1021/bc200295y. [DOI] [PMC free article] [PubMed] [Google Scholar]
- Yang J.; Liang Y.; Seckute J.; Houk K. N.; Devaraj N. K. Chem. - Eur. J. 2014, 20, 3365. 10.1002/chem.201304225. [DOI] [PMC free article] [PubMed] [Google Scholar]
- Di L.; Whitney-Pickett C.; Umland J. P.; Zhang H.; Zhang X.; Gebhard D. F.; Lai Y.; Federico J. J. 3rd; Davidson R. E.; Smith R.; Reyner E. L.; Lee C.; Feng B.; Rotter C.; Varma M. V.; Kempshall S.; Fenner K.; El-Kattan A. F.; Liston T. E.; Troutman M. D. J. Pharm. Sci. 2011, 100, 4974. 10.1002/jps.22674. [DOI] [PubMed] [Google Scholar]
- van Geel R.; Pruijn G. J.; van Delft F. L.; Boelens W. C. Bioconjugate Chem. 2012, 23, 392. 10.1021/bc200365k. [DOI] [PubMed] [Google Scholar]
- Rossin R.; van den Bosch S. M.; Ten Hoeve W.; Carvelli M.; Versteegen R. M.; Lub J.; Robillard M. S. Bioconjugate Chem. 2013, 24, 1210. 10.1021/bc400153y. [DOI] [PubMed] [Google Scholar]
- Selvaraj R.; Giglio B.; Liu S.; Wang H.; Wang M.; Yuan H.; Chintala S. R.; Yap L. P.; Conti P. S.; Fox J. M.; Li Z. Bioconjugate Chem. 2015, 26, 435. 10.1021/acs.bioconjchem.5b00089. [DOI] [PMC free article] [PubMed] [Google Scholar]
- Royzen M.; Yap G. P.; Fox J. M. J. Am. Chem. Soc. 2008, 130, 3760. 10.1021/ja8001919. [DOI] [PubMed] [Google Scholar]
- Montero D.; Tachibana C.; Rahr Winther J.; Appenzeller-Herzog C. Redox Biol. 2013, 1, 508. 10.1016/j.redox.2013.10.005. [DOI] [PMC free article] [PubMed] [Google Scholar]
- Uttamapinant C.; White K. A.; Baruah H.; Thompson S.; Fernandez-Suarez M.; Puthenveetil S.; Ting A. Y. Proc. Natl. Acad. Sci. U. S. A. 2010, 107, 10914. 10.1073/pnas.0914067107. [DOI] [PMC free article] [PubMed] [Google Scholar]
- Devaraj N. K.; Hilderbrand S.; Upadhyay R.; Mazitschek R.; Weissleder R. Angew. Chem., Int. Ed. 2010, 49, 2869. 10.1002/anie.200906120. [DOI] [PMC free article] [PubMed] [Google Scholar]
- Wu H.; Yang J.; Seckute J.; Devaraj N. K. Angew. Chem., Int. Ed. 2014, 53, 5805. 10.1002/anie.201400135. [DOI] [PMC free article] [PubMed] [Google Scholar]
- MacKenzie D. A.; Sherratt A. R.; Chigrinova M.; Cheung L. L.; Pezacki J. P. Curr. Opin. Chem. Biol. 2014, 21, 81. 10.1016/j.cbpa.2014.05.023. [DOI] [PubMed] [Google Scholar]
- McKay C. S.; Finn M. G. Chem. Biol. 2014, 21, 1075. 10.1016/j.chembiol.2014.09.002. [DOI] [PMC free article] [PubMed] [Google Scholar]
- Lavis L. D.; Raines R. T. ACS Chem. Biol. 2014, 9, 855. 10.1021/cb500078u. [DOI] [PMC free article] [PubMed] [Google Scholar]
- Shieh P.; Bertozzi C. R. Org. Biomol. Chem. 2014, 12, 9307. 10.1039/C4OB01632G. [DOI] [PMC free article] [PubMed] [Google Scholar]
- Lukinavicius G.; Reymond L.; D’Este E.; Masharina A.; Gottfert F.; Ta H.; Guther A.; Fournier M.; Rizzo S.; Waldmann H.; Blaukopf C.; Sommer C.; Gerlich D. W.; Arndt H. D.; Hell S. W.; Johnsson K. Nat. Methods 2014, 11, 731. 10.1038/nmeth.2972. [DOI] [PubMed] [Google Scholar]
- Uno S. N.; Kamiya M.; Yoshihara T.; Sugawara K.; Okabe K.; Tarhan M. C.; Fujita H.; Funatsu T.; Okada Y.; Tobita S.; Urano Y. Nat. Chem. 2014, 6, 681. 10.1038/nchem.2002. [DOI] [PubMed] [Google Scholar]
Associated Data
This section collects any data citations, data availability statements, or supplementary materials included in this article.