

Abstract
Osteoarthritis is the most common joint disorder affecting millions of people. Most scaffolds developed for cartilage regeneration fail due to vascularization and matrix mineralization. In this study we present a chondrogenic extracellular matrix (ECM) incorporated collagen/chitosan scaffold (chondrogenic ECM scaffold) for potential use in cartilage regenerative therapy. Biochemical characterization showed that these scaffolds possess key pro-chondrogenic ECM components and growth factors. MRI characterization showed that the scaffolds possess mechanical properties and diffusion characteristics important for cartilage tissue regeneration. In vivo implantation of the chondrogenic ECM scaffolds with bone marrow derived mesenchymal stem cells (MSCs) triggered chondrogenic differentiation of the MSCs without the need for external stimulus. Finally, results from in vivo MRI experiments indicate that the chondrogenic ECM scaffolds are stable and possess MR properties on par with native cartilage. Based on our results, we envision that such ECM incorporated scaffolds have great potential in cartilage regenerative therapy. Additionally, our validation of MR parameters with histology and biochemical analysis indicates the ability of MRI techniques to track the progress of our ECM scaffolds non-invasively in vivo; highlighting the translatory potential of this technology.
Keywords: Cartilage tissue engineering, Biomimetic scaffold, Extracellular matrix scaffold and MRI of tissue-engineered cartilage, MSC differentiation
1. Introduction
Osteoarthritis (OA) affects about 27 million people in the United States alone. OA is characterized by degeneration of the articular cartilage that lines the joints (such as hip and knee). Cartilage, being an avascular tissue, has a very limited regenerative potential[1] and therefore, OA is currently managed by the use of analgesics, physical therapy and lifestyle changes. In extreme cases, joint replacement surgery is performed. However, this procedure has several drawbacks. These can be categorized into immediate (thromboembolism, infection), mid term (fracture of adjacent bone, dislocation, loss in range of motion) and long-term (loosening and polyethylene synovitis) complications. In short, there is at present, no clinical treatment for OA that can be considered as a cure. Tissue engineering strategies can solve this problem by providing replacement cartilage tissues using patient specific somatic MSCs that can provide the structural and functional properties of the native cartilage.
Over the past decade, several tissue-engineering strategies have aimed at regenerating cartilage tissue using both naturally occurring and artificial polymeric biomaterials. We have recently published a review article on the use of such materials for bone and cartilage tissue engineering [2]. Several studies have shown the potential of scaffolds with ECM proteins and growth factors to trigger chondrogenic differentiation of MSCs[3-6]. Although these studies are promising, several complications such as safety and dosage of appropriate growth factors and precise control via complex delivery systems limit clinical translation of such strategies.
Cartilage, unlike bone is an avascular tissue. Therefore, the key to successful regeneration of cartilage is prevention of vascularization. Upon vascularization, mesenchymal stem cells (MSCs) undergo osteogenic as opposed to chondrogenic differentiation. In a recent study, porcine decellularized cartilage was used to induce chondrogenic differentiation of rabbit MSCs. The scaffolds were promising in vitro, but failed to maintain the chondrogenic phenotype in vivo over the long-term. The study showed that angiogenesis of the scaffold resulted in scaffold failure [7]. Other such studies also face similar setbacks[8]. In vivo, the tissue specific ECM governs tissue architecture, cellular functions, growth factor sequestration, growth factor delivery and stem cell differentiation. The ECM is uniquely cell type specific and provides the most relevant mixture of structural and functional proteins to achieve and maintain lineage specificity. Therefore, the need for ECM derived scaffolds for regenerating osteochondral defects is high. This need is also highlighted in a recent review by Benders et.al [9].
The ideal scaffold for cartilage tissue engineering should be one that consists of all of the ECM components required to differentiate mesenchymal stem cells (MSCs) to a chondrogenic lineage, prevent vascularization and provide the required mechanical and structural stability over a long term. To artificially engineer such a scaffold containing all the chondrogenic ECM components is not feasible. Therefore, an alternate approach is to utilize the secreted ECM of chondrogenic mesenchymal cells.
Published studies have shown the potential of decellularized ECM scaffolds to induce chondrogenic differentiation of MSCs and marrow clots [10, 11]. However, in vivo evaluation of vascularization and osteogenic differentiation of the stem cells is lacking in current approaches. Therefore, it is difficult to understand if such scaffolds are suitable for long-term use in vivo. Bone marrow derived MSCs have a natural tendency to differentiate towards an osteogenic lineage. Therefore, it is imperative for pro-chondrogenic scaffolds to inhibit vascularization and osteogenic differentiation of MSCs.
The focus of the present study is to evaluate chondrogenic differentiation of human bone marrow derived MSCs in vitro and in vivo. We have compared the pro-chondrogenic ECM scaffolds to pro-osteogenic ECM scaffolds in an attempt to demonstrate that cell type specific ECM can promote lineage specific differentiation of stem cells. We also compare their ability to inhibit or promote vascularization in vivo. To our knowledge, this is the first study of its kind that directly compares ECM derived osteogenic and chondrogenic scaffolds.
A non-invasive technology is required to monitor engineered cartilage tissues in vivo. Magnetic Resonance Imaging (MRI) is ideal for measuring the growth dynamics of cartilage tissue [12-14]. Our recent review article summarizes the development in the field of non-invasive monitoring of engineered cartilage using magnetic resonance techniques [12]. MRI observes the interaction of water protons with its surrounding and provides information about tissue microstructure non-invasively. The water relaxation times (T1, T2 and T1rho) and apparent diffusion coefficient (ADC) are commonly used as biomarkers for probing tissue engineered cartilage in vitro and in vivo [12, 15, 16]. In a recent clinical trial, T2 was chosen as a biomarker for measuring the progress of cartilage repair [16]. In this study, we have explored the use of MRI to study the properties of the pro-chondrogenic ECM scaffold in vitro and in vivo.
2. Materials and Methods
2.1. Cell culture
Adult human marrow stromal cells (HMSCs) were used in this study. The cells were obtained from the Tulane cancer center. We have published previously using these cells and they serve as a good representation of marrow MSCs from adults [17]. The cells were cultured in α MEM basal medium containing 20% fetal bovine serum (FBS), 1% L-glutamine and 1% antibiotic-antimycotic solution.
2.2. Generation of control, osteogenic and chondrogenic ECM scaffolds
Control scaffolds
Throughout the study, unless specified otherwise, control scaffolds refer to 1:1 collagen/chitosan scaffolds that do not contain any embedded cell-generated ECM. The scaffolds were prepared as per previously published standardized protocols [18].
Osteogenic ECM scaffolds
The osteogenic ECM scaffolds were generated as per previously published protocol [17]. Briefly, HMSCs were embedded within a 1:1 collagen/chitosan matrix as published previously[17]. 24 hours post seeding, osteogenic differentiation was induced by culturing the scaffolds in αMEM basal medium containing 100μg/ml ascorbic acid, 10mM β-glycerophosphate and 10mM dexamethasone for 4 weeks. The scaffolds were then decellularized and processed for further experiments as per our previously published protocols [17, 19, 20].
Chondrogenic ECM scaffolds
To generate chondrogenic scaffolds, HMSCs were embedded within a 1:1 collagen/chitosan matrix as published previously[17]. 24 hours post seeding, chondrogenic differentiation was induced by culturing the scaffolds in αMEM basal medium containing 1μM dexamethasone, 50μg/ml ascorbate-2-phosphate, 1%ITS premix (BD Biosciences), 1%FBS and 10ng/ml TGFβ1 growth factor for 4 weeks. The scaffolds were then decellularized and processed for further experiments as per our previously published protocols [17, 19, 20].
Osteogenic and chondrogenic ECM scaffolds were generated using the same batch of HMSCs to enable direct comparison.
2.3. MRI of decellularized osteogenic and chondrogenic ECM scaffolds
The MRI measurements were performed using a Bruker DRX 500 MHz (11.7 T) microimaging facility controlled by the Bruker imaging software Paravision 4.0. The samples (n=3) were first washed using Hank's balanced salt solution (HBSS) and placed on top of a 1% agarose gel in a 5 mm tube. The agarose gel is used as a biocompatible holder to maintain the center position of the samples. Flourinert oil was added to remove the background signal and to prevent the dehydration of samples. The common experimental parameters for all MRI experiments were: FOV =10 mm × 10 mm, matrix size = 128 × 128, and slice thickness = 0.5 mm. The T2 relaxation time measurements were measured using MSME pulse sequence (multi slice multi echo). The experimental parameters were TE = 7.2 ms, TR = 4000 ms, no. of echoes = 32, FOV =10 mm × 10 mm, matrix size = 128 × 128, slice thickness = 0.5 mm. The apparent diffusion coefficient (ADC) was obtained using a diffusion weighted spin echo MRI sequence. The experimental parameters were TE = 25.6 ms, TR = 5000 ms, δ/Δ = 3/18 ms, b-values (s/mm̂2) = 13, 213, 513, 813, 1212, 1612. The T2 and ADC maps were calculated by fitting voxel-by-voxel signal intensity to the single exponential fitting curve using a custom written Matlab program and selecting region of interests (ROIs) for scaffolds using the T2 weighted images.
2.4. In vitro chondrogenic differentiation HMSCs
1×10⁶ HMSCs were cultured within control and chondrogenic ECM scaffolds for a period of 4 weeks in growth media. To seed the cells on to the ECM scaffolds, the buffer from the scaffolds was removed using a sterile wick. A 100μl cell suspension was added to the ECM scaffolds. The wicking away of the buffer enabled the scaffold to adsorb the cell suspension homogenously. Triplicate experiments were performed for each group. RNA from the scaffolds was isolated as per published protocols [17, 19, 20] and quantitative RT PCR (qRT PCR) was performed using the osteogenesis PCR array (Qiagen).
2.5. Statistical significance
The qPCR data is expressed as fold change in gene expression in the ECM scaffolds with respect to control (non ECM containing) collagen/chitosan scaffolds. Statistical significance was calculated using the software provided by the manufacturer of the PCR arrays (Qiagen) and expressed as a p-value obtained from student's t-test.
2.6. In vitro MRI of chondrogenic ECM scaffolds with HMSCs
Chondrogenic ECM scaffolds (n=3) were seeded with 1×10⁶ HMSCs and cultured in vitro for 4 weeks. MRI was performed periodically to assess the changes in MR properties of the scaffold. The in vitro MRI measurements were performed using a Bruker DRX 500 MHz (11.7 T) micro-imaging facility controlled by the Bruker imaging software Paravision 4.0. At each time point (day0, day1, week1, week2, week3, and week 4), 2-3 samples were placed on top of a 1% agarose gel in a 5 mm tube filled with tissue culture media. The agarose gel is used as a biocompatible holder to maintain the center position of the samples. A 0.8 mm capillary tube filled with 5 mM CUSO4 was used as a standard liquid to standardize the absolute T2, T1rho, and ADC changes over the weeks. The T2 relaxation time was measured using a CPMG sequence based on a manufacturer supplied multi slice multi echo imaging sequence (MSME, Bruker). The T2 acquisition parameters were TR = 5000 ms; TE: 5.8 ms – 448 ms, 64 echoes evenly spacing; FOV = 8 mm × 8 mm; matrix size = 64 × 64; in-plane resolution = 125 μm × 125 μm; axial slice, 1 slices; slice thickness = 0.8 mm. The T1rho relaxation time was measured using a self-compensation preparatory pulse followed by a manufacturer supplied fast spin-echo (FSE) imaging sequence (RARE, Bruker). The self-compensation pulse was used here to correct the artifact induced by imperfect 90° pulse. The T1rho acquisition parameters were TR/TE = 5000/7.5 ms; SL frequency = 500 Hz; spin-lock TSL = 0, 10, 20, 40, 80, and 160 ms; FOV = 8 mm × 8 mm; matrix size = 64 × 64; in-plane resolution = 125 μm × 125 μm; axial slice, 1 slices; slice thickness = 0.8 mm. The ADC was measured using a manufacturer supplied diffusion-weighted spin-echo (DW-SE) imaging sequence. The ADC acquisition parameters were TR/TE = 5000/25 ms; δ/Δ = 3/18 ms, b = 0, 104, 247, 455, 730, 1070, and 1476 s/mm2; FOV = 8 mm × 8 mm; matrix size = 64 × 64; in-plane resolution =125 μm × 125 μm; axial slice, 1 slices. Regions of interest (ROIs) were selected to cover the scaffolds. The T2, T1rho, and ADC values were first calculated by fitting signal intensity to the single exponential fitting curve using a custom written Matlab program based on selected ROIs, then was normalized to that of 5 mM CuSO4 at each time point.
2.7. In vivo implantation experiments
All experiments were performed according to approved UIC animal care protocols (Assurance No: A3460-01). Triplicate control, osteogenic and chondrogenic ECM scaffolds containing 1 million HMSCs per scaffold were implanted subcutaneously on the back of immunocompromised mice. The scaffolds were implanted 1 day post seeding. The osteogenic ECM scaffold and the chondrogenic ECM scaffolds were implanted on either side of the spine of the same mouse with each mouse consisting of 2 scaffolds. The scaffolds were implanted for 2 weeks. The animals were then sacrificed and the scaffolds were removed, fixed in neutral buffered formalin and processed for histology and immunohistochemistry.
2.8. In vivo MRI
The in vivo MRI experiments were performed at the Lynn S. Florsheim MRIS lab at the University of Chicago. The surgeries were performed in accordance with University of Chicago approved animal care protocols (Assurance No: A3523-01). In order to have a built-in control, two scaffolds of the same type were implanted subcutaneously into the left and right flank of a 4-week-old Charles River athymic mouse; one contained 1 million HMSCs and the other did not contain any cells. T2 and T1rho measurements were performed post-implantation at time points of 1, 2, 3, 4, 6, and 8 weeks. Two types of implants were used: Control collagen/chitosan scaffold was one and the other was the chondrogenic ECM scaffold. Overall, there were four groups. The two types of implants with or without embedded HMSCs (1 million per scaffold). The experiments were performed in quadruplicate with each mouse containing 2 scaffolds. The scaffolds were cultured in vitro for 1 day prior to implantation.
The experiments were performed on a 9.4T Bruker BioSpec 33cm horizontal bore scanner using a 72 mm Bruker quadrature volume coil. Low-resolution fast spin-echo (SE) T2 weighted images were acquired first using a rapid acquisition with refocused echoes (RARE) sequence to first localize the implanted scaffolds axially. Next, a CPMG sequence was used to generate T2 relaxation data and avoid diffusion signal loss. 16 echoes were acquired with TR of 5000ms and echo time of 9.167ms. FOV was set at 30×30mm with an in-plane resolution of 117 microns and 1 mm slice thickness.
T1rho measurements were obtained using a preparatory pulse cluster with self-compensation followed by a readout fast SE sequence to minimize B1 and B0 field inhomogeneities. FOV was 30×30mm with an in-plane resolution of 234 microns and a 1mm slice thickness. TR was set to 4000ms and TE was set to 8.159ms. Spin lock time varied from 0.02, 10, 20, 40, and 60ms with spin lock strength of 23μT. T2 and T1rho relaxation times were normalized to local muscle tissue in order to achieve consistency between mice.
2.9. Histology and Immunohistochemistry (IHC)
The samples for histology and IHC were embedded in paraffin and sectioned into 5mm thin sections as per standard protocols. Tissue sections were deparaffinized in xylene, hydrated in graded ethanol solutions and stained with hematoxylin and eosin stains (H&E), safranin O, oil red O and alizarin red as per standard published protocols[18]. The stained sections were imaged using a Zeiss Axiovert inverted microscope equipped with the axiovision imaging software or using an EVOS XL Core microscope from Life Technologies.
For IHC, all sections were depariffinized in xylene, hydrated in graded ethanol solutions and immunostained according to published protocols [17, 18]. The following antibodies were used: Mouse anti tubulin antibody (Sigma, 1/1000), rabbit anti fibronectin antibody (Sigma, 1/200), mouse anti BMP2 antibody (BD Biosciences, 1/100), rabbit anti TGFβ antibody (Santa Cruz biotechnology 1/100), rabbit anti VEGF antibody (Santa Cruz biotechnology 1/100), mouse anti PEDF antibody (Millipore 1/100), rabbit anti MMP2 antibody (Santa Cruz 1/100), mouse anti phosphorylated serine antibody (Sigma, 1/100), mouse anti C-DMP1 antibody (gift from Dr. Qin, University of Texas, 1/2000), mouse anti Runx2 antibody (Abcam 1/100), mouse anti BSP antibody (Abcam 1/100), mouse anti osteopontin antibody (Abcam 1/100), rabbit anti aggrecan antibody (Abcam 1/100), rabbit anti Type II collagen antibody (Abcam 1/250). For all immunohistochemistry experiments with fluorescent secondary antibody labeling, anti-mouse FITC (1/100 Sigma) and anti-rabbit TRITC (1/100, Sigma) antibodies were used. All fluorescently immunostained sections were imaged using a Zeiss LSM 710 META confocal microscope equipped with Zen imaging software. For comparative images, the imaging parameters were maintained constant and the comparative sections were imaged the same day.
2.10. Scanning electron microscopy (SEM)
Control, osteogenic and chondrogenic ECM scaffolds were fixed in 4% neutral buffered formalin, dehydrated in graded ethanol solutions and dried using hexamethyldisilazane (HMDS). The samples were then coated with 5nm of platinum/palladium and imaged using Hitachi S3000N VP SEM in high vacuum mode.
2.11. In vitro proliferation and live/dead cell assay
Proliferation experiment was performed in 96 well assay plates using the AQueous cell-titer reagent (Promega). Briefly, the chondrogenic ECM scaffolds were seeded with 1 million cells per scaffold. 24 hours post seeding, the first batch of scaffolds was incubated with 20μl of the cell-titer reagent for 1 hour at 37°C as per manufacturer's protocol. The absorbance at 490 was then measured using a BioTek microtiter plate reader. The procedure was repeated at weeks 1, 2 and 3 post seeding. The data was normalized for background from the reagent. All experiments were performed in triplicate.
For live/dead cell assay, chondrogenic ECM scaffolds were seeded with 1million HMSCs per scaffold in triplicate. 24 hours post seeding, the scaffolds were incubated with the live (calcein AM)/dead (ethidium homodimer) cell reagent (Life Technologies) as per manufacturer's protocol. The scaffolds were then imaged using a Zeiss LSM 710 Meta confocal microscope equipped with Zen imaging software.
3. Results
3.1. Characterization of chondrogenic ECM scaffolds
We directly compared the presence of several ECM proteins between the osteogenic and chondrogenic ECM scaffolds. Fluorescence IHC was used to analyze the presence of several ECM proteins in the osteogenic and chondrogenic ECM scaffolds. In all these experiments, the sections were stained for tubulin as a negative control for intracellular proteins in the decellularized scaffolds. Fibronectin served as a positive control. DAPI staining was used to rule out the presence of residual cellular DNA. Figure 1A shows representative confocal micrographs from this experiment. Prominent differences were observed between the two types of scaffolds. The most striking difference was the negligible signal generated by vascular endothelial growth factor (VEGF) in the chondrogenic scaffolds and its abundance in the osteogenic scaffold under the same imaging conditions. Pigment-epithelium derived factor (PEDF) is one of the most potent anti angiogenic factors [21]. PEDF was present in greater amounts in the chondrogenic scaffold as opposed to the osteogenic scaffold. Pro osteogenic factors such as dentin matrix protein 1 (DMP1) and bone morphogenic protein 2 (BMP2) were present in reduced amounts in the chondrogenic scaffolds compared to the osteogenic scaffolds. Finally, MMP2, a metalloprotease involved in matrix remodeling during osteogenesis [22], was present in reduced amounts in the chondrogenic scaffolds. Collectively, the results presented in figure 1 show that differences exist between the osteogenic and the chondrogenic ECM scaffolds in terms of their matrix composition, providing a glimpse into their functionality.
Figure 1. Characterization of osteogenic and chondrogenic ECM scaffolds.
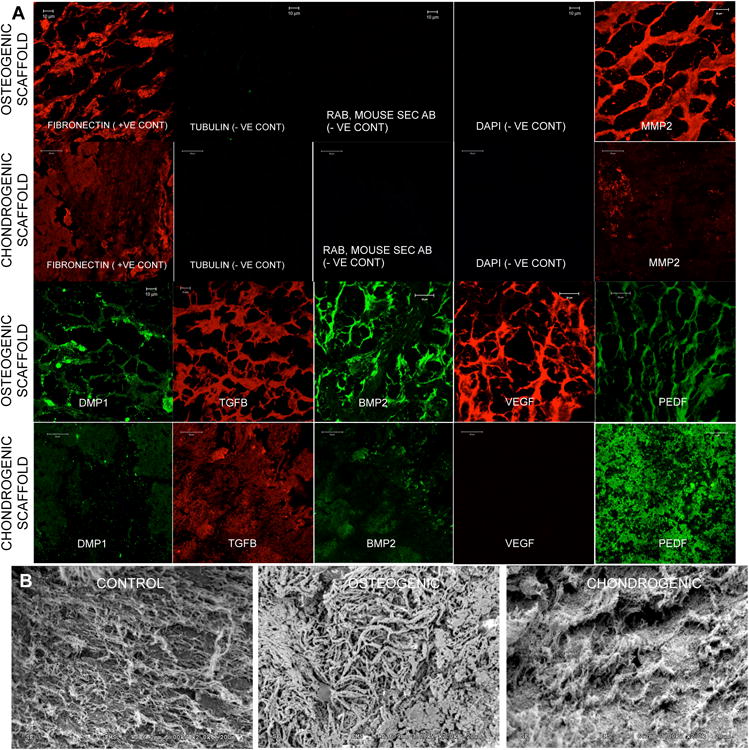
(A) Images are representative confocal micrographs showing expression of different ECM proteins in the osteogenic and chondrogenic ECM scaffolds. Fibronectin was used as a positive control and tubulin was used as a negative control for intracellular proteins. DAPI staining was performed to ensure absence of residual DNA from the cells. Note the difference in expression of different ECM proteins. (B) SEM images of control, osteogenic and chondrogenic ECM scaffolds. Note the difference in morphology of the 3 scaffolds.
Control, osteogenic and chondrogenic scaffolds were then subjected to SEM analysis to look for morphological differences. Results presented in figure 1B show that the control scaffold consists of randomly oriented thin collagen fibrils. The osteogenic scaffolds showed more organized, dense and thicker fibrils of structural proteins. Finally, the chondrogenic scaffolds showed bundles of ECM fibers that were denser than the control scaffolds but did not appear as thick or as reinforced as the osteogenic scaffolds.
3.2. Comparison of MR properties osteogenic and chondrogenic ECM scaffolds
MRI was performed on the control, osteogenic and chondrogenic ECM scaffolds to obtain T2 relaxation times and apparent diffusion coefficient (ADC) measurements. T2 refers to the relaxation time of water protons. The relaxation times depend on the stiffness of the material. As the material stiffness changes, there is a change in the dipolar couplings of the protons and is reflected as change in relaxation times. As the stiffness of the material increases, the T2 relaxation time decreases. Therefore, T2 relaxation times are generally inversely proportional to the stiffness of the material. Although these measurements do not provide absolute stiffness values, they can be used as indicators of change in stiffness of the material. Results presented in figure 2 show the T2 relaxation heat maps and mean relaxation times of the control, osteogenic and chondrogenic ECM scaffolds (n=3). High relaxation times for the control scaffolds (as seen in the table below) indicate that they were significantly less stiff (P<0.05, student's t-test between control and each of the ECM scaffolds) than the ECM scaffolds. The T2 relaxation times for the osteogenic scaffolds were significantly lower than the control scaffolds (P<0.05, student's t-test) and the chondrogenic ECM scaffolds (P<0.05, student's t-test) showing that they were the stiffest of the three scaffolds compared. The T2 relaxation times for the chondrogenic scaffolds were in between the osteogenic and control scaffolds.
Figure 2. MRI characterization of osteogenic and chondrogenic ECM scaffolds.

Images are MRI heat maps of T2 and ADC (apparent diffusion coefficient of water) of control, osteogenic and chondrogenic ECM scaffolds. The table below shows the quantitation of the MRI data.
Native cartilage is avascular and therefore nutrient transfer occurs via diffusion. For successful regeneration of cartilage, diffusion coefficient values for a cartilaginous construct should show good diffusion characteristics. Data presented in figure 2 show that the diffusion coefficient of water within the chondrogenic ECM scaffolds is closer to that of the surrounding buffer (area outside of the boundaries) than the osteogenic ECM scaffolds indicating a high diffusion coefficient that translates into effective nutrient diffusion characteristics.
In summary, results from the MRI experiments showed that the chondrogenic ECM scaffolds are less stiff than the osteogenic scaffolds and support better diffusion.
3.3. In vitro behavior of HMSCs in the chondrogenic ECM scaffolds
The proliferation of HMSCs within chondrogenic ECM scaffolds was analyzed quantitatively by means of a proliferation assay. Results presented in figure 3 show that the HMSCs underwent a burst in proliferation for 1 week after which the proliferation rate slowed down between week 1 and week 3. Qualitative analysis of the cells by live/dead cell assay indicated that this drop in proliferation was not due to increased cell death. Therefore, we hypothesized that the HMSCs were undergoing differentiation during this period. To determine if this was true and if the differentiation was chondrogenic in nature, HMSCs were cultured within the control and chondrogenic ECM scaffolds for 4 weeks in vitro. Table 1 shows the regulation of HMSC gene expression in the ECM scaffold with respect to the control scaffold. Results are presented as mean fold change in gene expression with respect to control (n=3). Statistical significance was assessed using student's t-test. The genes shown in bold are pro osteogenic genes that have been either turned off or down regulated by the influence of the chondrogenic ECM scaffold. Results presented show that the chondrogenic ECM scaffold triggers chondrogenic differentiation of HMSCs as evidenced by positive regulation of genes such as SOX9 and type X collagen. Additionally, chondrogenic differentiation was also evidenced by down regulation of pro osteogenic genes such as RUNX2, DMP1, PHEX and osteocalcin.
Figure 3. Proliferation of HMSCs in the chondrogenic ECM scaffolds.
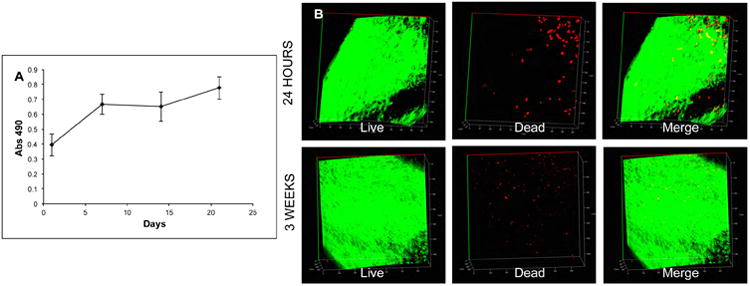
(A) A graphical representation of the proliferation of HMSCs in the chondrogenic ECM scaffolds over 3 weeks of culture in vitro. Note the initial burst in proliferation at week1 followed by slower rate of proliferation up to 3 weeks. (B) Live/Dead cell assay of HMSCs in the chondrogenic ECM scaffolds 24 hours post seeding and after 3 weeks of culture in vitro.
Table 1. HMSC gene regulation in chondrogenic ECM scaffolds.
Table represents mean fold change in gene expression of HMSCs in the chondrogenic ECM scaffolds with respect to control scaffolds (n=3 for each group). Significance was calculated using student's t-test. Note the positive regulation of pro chondrogenic genes such as sox9 and type X collagen and negative regulation/down regulation (indicated by –ve sign) of pro osteogenic genes (marked in bold letters). Genes that showed a Ct value in the control samples, but did not show any expression in the ECM samples are marked as turned off.
| GENE SYMBOL | DESCRIPTION | FOLD CHANGE | P-VALUE (T-TEST) |
|---|---|---|---|
| GROWTH FACTORS | |||
| BMP2 | Bone morphogenetic protein 2 | 6.53 | 0.000033 |
| BMP4 | Bone morphogenetic protein 4 | -4.71 | 0.0446 |
| EGF | Epidermal growth factor | Turned off | |
| FGF2 | Fibroblast derived growth factor 2 | -1.67 | 0.0128 |
| TGFβ1 | Transforming growth factor beta 1 | 1.59 | 0.0376 |
| IGF1 | Insulin like growth factor 1 | -4.4 | 0.11 |
| GDF10 | Growth and differentiation factor 10 | Turned off | |
| TRANSCRIPTION FACTORS | |||
| RUNX 2 | Runt related transcription factor 2 | -1.55 | 0.16 |
| SOX 9 | (Sex determining region Y)-box 9 | 5.32 | 0.0512 |
| ECM PROTEINS | |||
| BGN | Biglycan | 1.67 | 0.016 |
| BGLAP | Osteocalcin | -2.16 | 0.0182 |
| COL10A1 | Type X Collagen | 2.8 | 0.0446 |
| COMP | Cartilage oligomeric matrix protein | 1.38 | 0.147 |
| COL1A1 | Type I collagen | 1.83 | 0.0056 |
| DMP1 | Dentin matrix protein 1 | Turned off | |
| PHEX | Phosphate regulating neutral endopeptidase | Turned off | |
| ADHESION MOLECULES | |||
| ITGA1 | Integrin alpha 1 | -1.64 | 0.0583 |
| CDH11 | Cadherin 11 | -1.47 | 0.0369 |
| VCAM1 | Vascular cell adhesion molecule 1 | -5.37 | 0.0022 |
| MMPs | |||
| MMP2 | Matrix metalloprotease 2 | 1.45 | 0.0546 |
| RECEPTORS | |||
| FGFR2 | Fibroblast growth factor receptor 2 | -2.41 | 0.0352 |
| IGF1R | Insulin like growth factor receptor | -12.09 | 0.0241 |
| CD36 | Thrombospondin receptor | -4.18 | 0.091 |
| OTHER | |||
| B2M | β2 macroglobulin | -8.02 | 0.00007 |
| ACTB | Actin | 4.14 | 0.17 |
Table 2 compares the regulation of a few important genes when HMSCs were cultured within osteogenic and chondrogenic ECM scaffolds. It is to be noted that the HMSCs were cultured within the respective scaffolds in growth media only. No exogenous growth factors or differentiating agents were added to the cultures. From table 2, it is clear that the ECM significantly influences lineage specific differentiation of stem cells in vitro.
Table 2. Comparison of HMSC gene regulation in osteogenic and chondrogenic ECM scaffolds.
Table shows comparison of fold change in gene expression in osteogenic (from our published article [20]) and chondrogenic ECM scaffolds with respect to control scaffolds. Genes that showed a Ct value in the control samples, but did not show any expression in the ECM samples are marked as turned off. A –ve sign denotes down regulation. P-value was calculated using student's t-test.
| GENE | Fold change in OSTEOGENIC scaffold (P-value from t-test) | Fold change in CHONDROGENIC scaffold (P-value from t-test) |
|---|---|---|
| TGFβ1 (Transforming growth factor beta 1) | 7.92 (0.003) | 1.59 (0.036) |
| GDF10 (Growth and differentiation factor 10) | 11.8 (0.016) | Turned off |
| RUNX2 (Runt related transcription factor 2) | 2.35 (0.019) | -1.55 (0.16) |
| BGN (Biglycan) | 3.24 (0.032) | 1.67 (0.017) |
| COLLI (Type I collagen) | 12.06 (0.025) | 1.83 (0.006) |
| FGFR2 (Fibroblast growth factor receptor 2) | 3.89 (0.002) | -2.14 (0.0352) |
| IGF1R (Insulin like growth factor 1 receptor) | 2.02 (0.05) | -12.09 (0.0241) |
| DMP1 (Dentin matrix protein 1) | 3.27 (0.004) | Turned off |
| MMP2 (Matrix metalloproteinase 2) | 5.10 (0.0025) | 1.45 (0.0546) |
3.4. In vitro evaluation of MR properties of chondrogenic scaffolds containing HMSCs
Our results showed the ability of the ECM scaffolds to induce chondrogenic differentiation in vitro. For successful cartilage tissue regeneration, the MR properties of the engineered tissue should resemble that of native tissue. T2 relaxation times of the chondrogenic ECM scaffolds, when seeded with HMSCs should fall within the range of endogenous cartilage (refer to supplementary figure 1 that shows the T2 heat map of bovine cartilage). We measured the T2, T1rho relaxation times and also the diffusion coefficient in the chondrogenic ECM scaffolds seeded with HMSCs over a period of 4 weeks (n=3 for each group). Results presented in figure 4 show that upon addition of HMSCs, the T2 relaxation times of the chondrogenic ECM scaffolds more closely resemble those of native cartilage (supplementary figure 1). Additionally, no significant decrease in either the relaxation times or diffusion coefficient was observed over 4 weeks of culture. This result shows that the ECM scaffold does not lose its characteristics over time in culture. An increase in relaxation times would indicate scaffold degradation leading to loss in stiffness. On the other hand, a reduction in relaxation times would indicate osteogenic differentiation and matrix mineralization leading to increase in stiffness. Our results show that the relaxation times of the chondrogenic ECM scaffolds remained unchanged. In addition to the relaxation times, no significant changes were observed in the diffusion coefficient of water indicating that after 4 weeks in culture, the scaffold maintained its diffusion characteristics although the cell number within the scaffold increased.
Figure 4. MRI evaluation of chondrogenic ECM scaffolds with HMSCs over time.
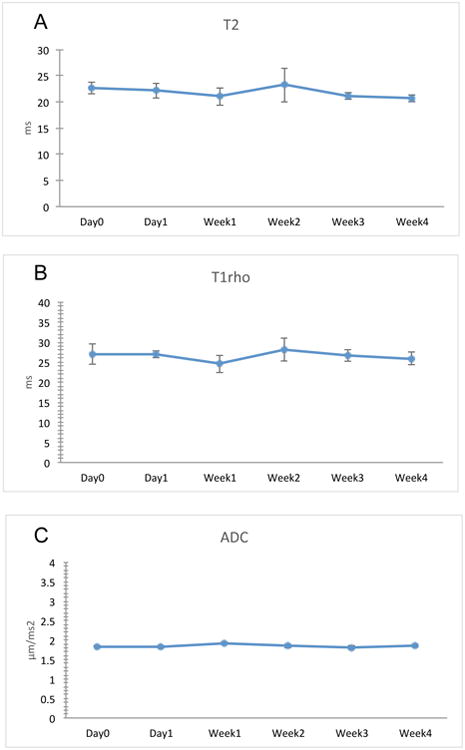
The graphs show quantitation of MRI data representing changes in T2 (A), T1rho (B) and ADC (C) over a period of 4 weeks. Data are represented a mean +/- SD (n=3). Student's t-test was used to assess the statistical difference between the data obtained from different time points to the data obtained at day 0. No statistically significant change could be observed for all parameters.
3.5. In vivo evaluation of osteogenic and chondrogenic ECM scaffolds - Vascularization
The in vivo potential of the chondrogenic ECM scaffolds to inhibit vascularization was assessed. Control, osteogenic and chondrogenic scaffolds were seeded with HMSCs and implanted subcutaneously in immunocompromiced mice (n=3 for each group). The subcutaneous pocket is vascular rich and provides an ideal pro-vascular environment. Results presented in figure 5A shows representative photographs of the three different scaffold groups after 2 weeks of implantation. The arrows in the figure point to visible blood vessels. It is apparent from this figure that the osteogenic ECM scaffolds showed robust vascularization. Control scaffolds were also vascularized, but not to the extent of the osteogenic ECM scaffolds. On the other hand, the chondrogenic ECM scaffolds remained avascular in appearance.
Figure 5. Macroscopic evaluation and H&E staining of scaffold explants.

(A) The figure shows representative control, osteogenic and chondrogenic scaffolds after extraction from their subcutaneous pockets. Black arrows in the image point to blood vessels that can be seen using the naked eye. Note the absence of visible blood vessels in the chondrogenic ECM scaffolds. Scale bar represents 2mm. Images are representative micrographs of H&E stained control (B), osteogenic (C) and chondrogenic (D) scaffold explants. The fluorescence micrographs represent auto fluorescence from the sections in the red channel to observe RBC auto fluorescence. White arrows in the images show positive identification of RBCs. Note the absence of RBCs in the chondrogenic scaffolds. Scale bar represents 2μm in all images. The diffused background red fluorescence observed in the images is auto fluorescence from chitosan.
We performed histological evaluation to further confirm the avascular nature of the chondrogenic scaffolds. Sections from triplicates of each group were stained with H&E and imaged. Figures 5B, 5C and 5D show representative sections from the three groups (control, osteogenic and chondrogenic respectively). The arrows in the images point to red blood corpuscles present as a result of active blood flow and auto fluorescence in the red channel. When imaged, we could observe limited vascularization of the control scaffold (white arrows pointing to RBCs in figure 5B right panel). The osteogenic scaffold showed robust vascularization with the observation of complete blood vessels containing RBCs (white arrows in figure 5C right panel). However, under microscopic examination, the chondrogenic scaffolds remained avascular. In all the images, a diffused red background staining was observed. This is due to auto fluorescence from chitosan as a result of H&E staining. RBCs can be seen as clear punctate concave discs.
Collectively, results presented in figure 5 show that when implanted in a vascular rich environment, the osteogenic scaffold promoted vascularization and the chondrogenic scaffold inhibited vascularization.
3.6. In vivo evaluation of osteogenic and chondrogenic ECM scaffolds - Histology
Histological evaluation of scaffold explants was performed to assess lineage specific differentiation. Safranin-O staining was performed to evaluate the presence of proteoglycans. Alizarin red staining was performed to evaluate the presence of calcium and oil red O staining was performed to evaluate the presence of lipid droplets indicating adipogenic differentiation. Results presented in figure 6 show that compared to the control and chondrogenic scaffolds, the osteogenic ECM scaffolds contained an abundance of calcium deposition (figure 6B). On the other hand, the chondrogenic ECM scaffolds showed an abundance of proteoglycan presence and minimal calcium presence (figure 6A). None of the three scaffolds showed positive staining with oil red O stain indicating the absence of adipogenic differentiation (figure 6C). Polarized light microscopy was employed to analyze the orientation of the collagen fibrils. Results presented in figure 6D show that the osteogenic scaffolds contain thicker and more organized bundles of collagen compared to control scaffolds. On the other hand, the organization in the chondrogenic scaffolds showed a crisscross arrangement of fibrils. This data correlates with the SEM data showing similar ECM orientation. Overall, results from histological analyses suggested that the osteogenic and chondrogenic ECM scaffolds possessed the ability to initiate lineage specific differentiation of HMSCs in vivo.
Figure 6. Histological evaluation of osteogenic and chondrogenic differentiation in vivo.
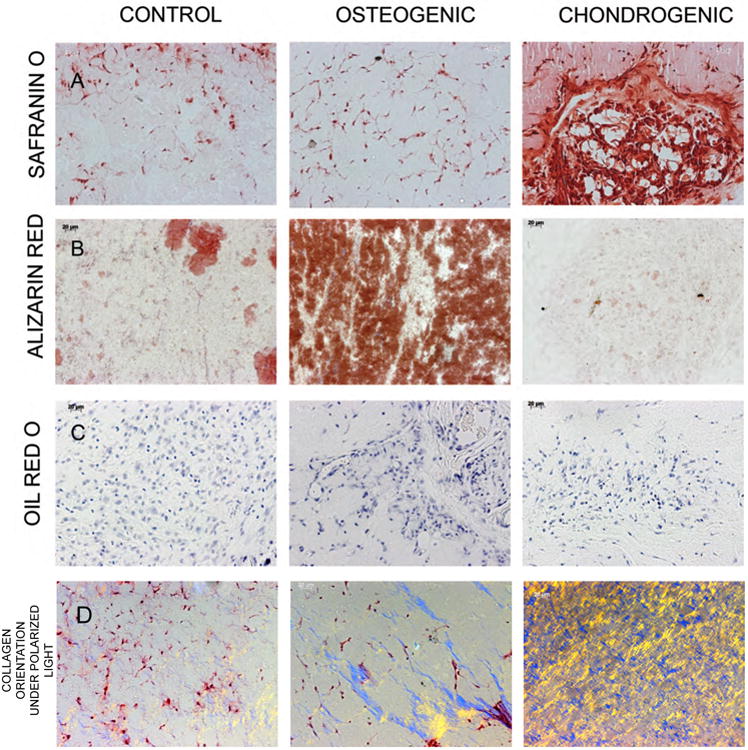
Images are representative micrographs of safranin O (A), alizarin red (B) and oil red O (C) stains of control, osteogenic and chondrogenic ECM scaffolds. The sections for oil red O stains were counter stained with hematoxylin. Note positive alizarin red staining for calcium in the osteogenic scaffolds and the positive safranin O proteoglycan staining in the chondrogenic scaffolds. (D) Images were obtained by polarized light microscopy to observe collagen orientation. Distinct differences in collagen fibril arrangement were observed in the three scaffolds.
3.7. In vivo evaluation of osteogenic and chondrogenic ECM scaffolds - IHC
To further confirm the absence of osteogenic differentiation in chondrogenic scaffolds, we performed IHC to look for osteogenic marker proteins. Explant sections of control, osteogenic and chondrogenic scaffolds were immunostained with antibodies for VEGF, Runx2, bone sialoprotein (BSP), osteopontin (OPN) and phosphorylated serines (pSer). pSer antibody stains all phosphorylated proteins containing phosphorylated serines. Phosphorylated proteins are the source for phosphorus ions required for calcium phosphate mineral nucleation during osteogenic differentiation. Results presented in figure 7 are representative images of this experiment. Results showed that the osteogenic marker proteins were absent in the chondrogenic ECM scaffold containing HMSCs indicating absence of osteogenic differentiation. A reduced amount of phosphorylated proteins was present in the chondrogenic ECM scaffold. However, this amount was lesser even than the control scaffolds (figure 7E). Intracellular signaling mechanism occurs via transfer of phosphate groups. Therefore, we hypothesize that the phosphorylated proteins observed in our experiments in the chondrogenic ECM scaffolds could be the ones involved in signaling cascades and not the secreted phosphoproteins required for matrix mineralization. On the other hand, the osteogenic ECM scaffold showed the presence of all of the marker proteins for osteogenic differentiation. Control scaffolds stained positive for VEGF and for the presence of phosphorylated proteins, but did not show the presence of osteogenic differentiation marker proteins. Taken together, the results from this experiment showed that when implanted subcutaneously in vivo, the chondrogenic ECM scaffolds do not promote osteogenic differentiation of HMSCs.
Figure 7. Fluorescence IHC of scaffold explants.

Images are representative confocal micrographs of control, osteogenic and chondrogenic scaffold explants immunostained for osteogenic marker proteins. Note the absence of positive staining in the chondrogenic scaffold explant sections showing absence of osteogenic differentiation of HMSCs in vivo.
3.8. In vivo MRI and histological evaluation of chondrogenic ECM scaffolds over 8 weeks
Our results show that the biomimetic chondrogenic scaffolds maintain their characteristics in vitro. However, it is important to evaluate their behavior in vivo to confirm their potential. For the results presented in figures 8A, B and C arising from in vivo MRI evaluations, chondrogenic ECM scaffolds without cells served as controls. The rationale was that if we observed degradation of the scaffolds, we would know the role of the HMSCs in that process. On the other hand, if the T2 relaxation times and MR properties show increase in stiffness, we can then correlate the result to osteogenic differentiation of HMSCs.
Figure 8. Live animal MRI of chondrogenic scaffolds.

(A) Shows a representative mouse carrying chondrogenic ECM scaffold alone on the left and chondrogenic ECM scaffold containing HMSCs on the right. The MRI image below shows the presence of both scaffolds in the subcutaneous pocket (2 scaffolds were implanted in each mouse). Graphs B and C show quantitative T2 and T1rho measurements of the implants (n=4 for each group) in the animals measured at different time points up to 8 weeks. The red and blue asterisks represent statistically significant differences between the chondrogenic ECM scaffolds alone and chondrogenic ECM scaffolds containing HMSCs as measured by student's t-test at the different time points with respect to each other. No significant differences were seen within each of the groups at all time points with respect to week 1. The graph in C represents the change in T2 relaxation times of the chondrogenic ECM scaffolds containing HMSCs and control (collagen/chitosan scaffold) scaffolds containing HMSCs after removal of the scaffold T2 relaxation time contribution. * Represents a statistically significant difference (p< 0.01) between the control group and the chondrogenic ECM scaffold group at the specific time point as measured by student's t-test. Note the significant difference between the ECM production within the chondrogenic scaffolds and the control scaffolds over 4 weeks. (E, E1, F, F1, G, G1 and H, H1) Representative images of 8-week explant sections of control (E, F, G and H) and chondrogenic ECM scaffolds (E1, F1, G1, H1) containing HMSCs stained using safranin O (E, E1), alizarin red (F, F1) histological stains and immunostained for aggrecan (G, G1) and Type II collagen (H, H1)
Chondrogenic ECM scaffolds with and without HMSCs were implanted subcutaneously as shown in figure 8A and MRI was performed on the same mice (n=4 for each group) over period of 8 weeks. We measured T2 and T1rho parameters during the imaging. Published reports have shown that these parameters are indicative of changes to the properties of cartilage tissues [23]. Results presented in figures 8B and 8C show that no significant change in the MR properties was observed over 8 weeks in both groups individually. However, a significant difference was observed when the two groups were compared between each other at the same time point showing the direct change caused by HMSCs. Additionally, the T2 relaxation times of scaffolds containing HMSCs corresponded to the MR properties of native cartilage (supplementary figure 1). Overall, the results from this experiment showed that the MR properties of the ECM scaffolds remain unchanged over a period of 8 weeks suggesting that there is no degradation of the scaffolds over time in vivo. Additionally, the results also show the scaffolds did not show MR properties representative of mineralized matrices.
We confirmed the integrity of the chondrogenic ECM scaffolds containing HMSCs with respect to control scaffolds (non ECM containing scaffolds) containing HMSCs by measuring the weight of the scaffolds using a sensitive balance. The average weight of control scaffolds prior to implantation was 0.148g (+/- 0.0034, n=4). After 8 weeks of implantation, the average weight reduced to 0.04475g (+/- 0.0065, n=4). On the other hand, the average weight of chondrogenic ECM scaffolds prior to implantation was 0.0692g (+/-0.00562, n=4). The average weight of the scaffolds 8 weeks post implantation remained at 0.0605g (+/- 0.0024, n=4). This result corresponds to our MR evaluations and validates our claim that the chondrogenic ECM scaffolds do not loose their integrity with time in vivo. The gross MR properties of the scaffold dominate the subtle changes that occur within these scaffolds in vivo. It is possible to track these changes if the scaffold contribution to the MR data is eliminated. We recently published on a methodology to accomplish this using MRI data obtained from scaffolds in vitro [14]. We applied this methodology to the MRI evaluations of the scaffolds in vivo. For these experiments control scaffolds collagen/chitosan scaffolds that do not contain embedded ECM were used as controls. The rationale was that: although the previous experiment showed the direct effect of HMSCs on the MR parameters, it is not possible to evaluate if the HMSCs in the chondrogenic scaffolds generated more ECM than those in the control scaffolds. For this purpose, control and chondrogenic ECM scaffolds containing HMSCs were compared over a period of 4 weeks by in vivo MRI. Results presented in figure 8D show calculated T2 relaxation times after removal of scaffold contributions in control scaffolds and the chondrogenic ECM scaffolds containing HMSCs. Both scaffolds were seeded with the same number of cells initially. The T2 relaxation times for the chondrogenic ECM scaffold containing HMSCs was significantly lower than that of the control scaffold containing HMSCs from week 2 until week 4 (P<0.01, student's t-test). If this change is correlated biologically, the majority of the change can be attributed to increased ECM production by the chondrogenic cells within the chondrogenic scaffold. To further validate this and confirm the chondrogenic differentiation of HMSCs over the 8 weeks, histology and IHC was performed on 8-week explants from control scaffolds (collagen-chitosan scaffolds not containing any ECM) and chondrogenic ECM scaffolds containing HMSCs. Results presented in figures 8E, 8F, 8G and 8H show that the chondrogenic ECM scaffolds triggered increased deposition of proteoglycans by the HMSCs (Figures 8E, 8E1 showing safranin O staining) but no mineralization was observed (figures 8F and 8F1 showing alizarin red staining for calcium). Additionally, IHC with aggrecan (figures 8G, 8G1) and type II collagen (figures 8H, 8H1) antibodies showed that the increased presence of these chondrogenic ECM marker proteins in the chondrogenic ECM scaffolds with respect to the control scaffolds.
4. Discussion
In our previous studies, we have shown that it is possible to achieve lineage specific differentiation of MSCs using target cell specific ECM embedded within a collagen/chitosan framework. Specifically, we have shown that HMSCs can undergo osteogenic [17] or odontogenic [20] differentiation by virtue of a change in ECM environment without the need for external growth factor delivery systems. However, cartilage tissue engineering is uniquely different.
Vascularization is one of the most important factors that contributes to the success of most tissue engineering projects [24]. Vascularization is essential to ensure survival of cells within three-dimensional scaffolds and their integration with the surrounding tissues. However, cartilage is an avascular tissue and one of the primary requirements of tissue-engineered cartilage is to prevent vascularization. In the cartilage tissue, chondrocytes receive their nutrition via diffusion through the perichondrium, synovial fluid and subchondral bone [25, 26]. Therefore, an appropriate scaffold for cartilage tissue regeneration, apart from providing the ideal cues for stem cell differentiation, should have good diffusion characteristics to prevent cellular necrosis. Additionally, such scaffolds should possess appropriate mechanical properties and should integrate well with the surrounding bone tissue [27, 28].
Chondrocytes constitute approximately 5% of the total volume of the cartilage tissue [26, 29]. Therefore, the ECM of cartilage tissues plays a very critical role. In the present study, we have developed an ECM based scaffold for cartilage tissue engineering. This scaffold comprises the ECM of mesenchymal cells that have undergone chondrogenic differentiation. We chose to use this approach for two reasons: Firstly, we selected mesenchymal cells as opposed to chondrocytes because the scaffold would eventually be populated by MSCs and the environment needs to be conducive for MSC attachment and proliferation. Therefore, an MSC environment that is pro-chondrogenic is more favorable. Secondly, chondrocytes possess very poor proliferation capacity in vitro. Therefore, it is difficult to envision mass-production of scaffolds generated using chondrocyte ECM. On the other hand, the ECM scaffolds used in this study can be mass-produced using mesenchymal cell lines in bioreactors and then decellularized. Patient specific MSCs can then be used to populate the scaffold.
We have shown that the chondrogenic ECM scaffolds can trigger chondrogenic differentiation of HMSCs both in vitro and in vivo and at the same time inhibit vascularization and osteogenic differentiation. Quantitative gene expression data showed positive regulation of pro chondrogenic genes such as sox 9 and type X collagen. On the other hand, pro osteogenic genes such as runx2 were negatively regulated showing absence of osteogenic differentiation. When the performance of osteogenic and chondrogenic scaffolds were evaluated in vivo, the osteogenic scaffolds promoted vascularization, induced matrix mineralization and expressed marker proteins that are indicative of osteogenic differentiation. On the other hand, the chondrogenic ECM scaffolds showed no vascularization, absence of osteogenic markers, no significant calcium phosphate nucleation and high proteoglycan presence. Taken together, the in vitro and in vivo results clearly show the potential of chondrogenic ECM scaffolds to inhibit osteogenic differentiation and vascularization and induce chondrogenic differentiation and proteoglycan deposition.
Another important aspect of cartilage tissue engineering is the need for monitoring the status of the engineered tissue periodically. At present, MRI is the preferred non-invasive technology. Unlike X-ray, the use of MRI does not subject the patient to harmful radiation. Therefore, the engineered tissue can be monitored more frequently using this technique. In the present study, we have characterized the MR properties of the chondrogenic ECM scaffold. The diffusion coefficient of water within the chondrogenic scaffolds was the same as control scaffolds and did not reduce as a result of increase in stiffness. We have shown in our published studies that the control scaffolds possess a high diffusion coefficient [17, 18]. This result showed that the chondrogenic ECM scaffold had suitable diffusion characteristics to allow diffusion of nutrients. When monitored in vitro over 4 weeks with HMSCs, no statistically significant change in the MR properties (both T2 and diffusion coefficient values) was observed. Additionally, the MR data revealed that the scaffolds possessed MR properties on par with native cartilage tissue.
In vivo MRI of the chondrogenic ECM scaffolds revealed that the scaffolds containing HMSCs showed increased ECM deposition that can be attributed to proteoglycan presence when observed in tandem with the histology data. Additionally, no degradation was observed over 8 weeks in vivo. We also show that apart from not losing integrity and stiffness over time, the chondrogenic ECM scaffolds also do not promote osteogenic differentiation and calcium phosphate deposition. We reached this conclusion based on the histology data after 8 weeks of implantation and the fact that the T2 and T1rho relaxation times did not drop with time. If the scaffolds had triggered matrix mineralization as a result of vascularization and osteogenic differentiation, the MR properties would have shown an increase in the stiffness of the scaffolds measured by reduction in T2 and T1rho parameters. Overall, our results indicate that it is possible to monitor the progress of our scaffolds in vivo using MRI and that the MR properties of our chondrogenic ECM scaffolds are maintained over time in vitro and in vivo.
5. Conclusion
In this study we have shown that it is possible to achieve and maintain chondrogenic differentiation of HMSCs using biomimetic ECM scaffolds. We have directly compared osteogenic and chondrogenic biomimetic ECM scaffolds to show that the scaffolds induce lineage specific differentiation without the need for addition of external stimulus. This comparison is important to understand scaffold behavior before transitioning into large animal models and load bearing scenarios. We have shown the absence of vascularization and matrix mineralization in these scaffolds in vivo. Finally, we have shown that the scaffolds maintain their integrity and mechanical characteristics as measured by MRI both in vitro and in vivo over a prolonged period of time. We have therefore developed a non-invasive technique to monitor our scaffolds in vivo.
We hypothesize that a combination of our osteogenic ECM scaffold and our chondrogenic ECM scaffold can be used in future studies to generate a dual layered osteochondral construct that can be used in larger animal models. Studies are underway to evaluate such constructs in our laboratory. Future studies will focus on the use of bioreactors to enable mass production of these scaffolds. Based on our results, we envision that our chondrogenic ECM incorporated scaffolds can serve as ideal tools for cartilage tissue regeneration.
Supplementary Material
Supplementary figure 1: Image showing a heat map of T2 relaxation time obtained from MRI of bovine medial femoral condoyle tissue.
Acknowledgments
The work presented in this manuscript was supported by NIH grant R56 DE023806 and UIC Chancellor's Discovery fund award to Dr. Sriram Ravindran. NIH grant DE11657 and the Brodie endowment fund to Dr. Anne George and NIH grant EB007537 to Dr. Magin. We would like to thank Ms. Erica Markiewicz, Mr. Jim Vosicky and Ms. Marta Zamora for their assistance with animal surgery and maintenance during the in vivo MRI experiments at the University of Chicago. We would also like to thank the UIC electron microscopy facility and the confocal microscopy facility for their assistance.
Footnotes
Publisher's Disclaimer: This is a PDF file of an unedited manuscript that has been accepted for publication. As a service to our customers we are providing this early version of the manuscript. The manuscript will undergo copyediting, typesetting, and review of the resulting proof before it is published in its final citable form. Please note that during the production process errors may be discovered which could affect the content, and all legal disclaimers that apply to the journal pertain.
References
- 1.Mow VC, Ratcliffe A, Poole AR. Cartilage and diarthrodial joints as paradigms for hierarchical materials and structures. Biomaterials. 1992;13:67–97. doi: 10.1016/0142-9612(92)90001-5. [DOI] [PubMed] [Google Scholar]
- 2.George A, Ravindran S. Protein Templates in Hard Tissue Engineering. Nano Today. 2010;5:254–66. doi: 10.1016/j.nantod.2010.05.005. [DOI] [PMC free article] [PubMed] [Google Scholar]
- 3.Hwang NS, Varghese S, Li H, Elisseeff J. Regulation of osteogenic and chondrogenic differentiation of mesenchymal stem cells in PEG-ECM hydrogels. Cell Tissue Res. 2011;344:499–509. doi: 10.1007/s00441-011-1153-2. [DOI] [PubMed] [Google Scholar]
- 4.Solchaga LA, Penick KJ, Welter JF. Chondrogenic differentiation of bone marrow-derived mesenchymal stem cells: tips and tricks. Methods Mol Biol. 2011;698:253–78. doi: 10.1007/978-1-60761-999-4_20. [DOI] [PMC free article] [PubMed] [Google Scholar]
- 5.Singh P, Schwarzbauer JE. Fibronectin and stem cell differentiation - lessons from chondrogenesis. J Cell Sci. 2012;125:3703–12. doi: 10.1242/jcs.095786. [DOI] [PMC free article] [PubMed] [Google Scholar]
- 6.Allen JL, Cooke ME, Alliston T. ECM stiffness primes the TGFbeta pathway to promote chondrocyte differentiation. Mol Biol Cell. 2012;23:3731–42. doi: 10.1091/mbc.E12-03-0172. [DOI] [PMC free article] [PubMed] [Google Scholar]
- 7.Choi KH, Choi BH, Park SR, Kim BJ, Min BH. The chondrogenic differentiation of mesenchymal stem cells on an extracellular matrix scaffold derived from porcine chondrocytes. Biomaterials. 2010;31:5355–65. doi: 10.1016/j.biomaterials.2010.03.053. [DOI] [PubMed] [Google Scholar]
- 8.Thakkar S, Ghebes CA, Ahmed M, Kelder C, van Blitterswijk CA, Saris D, et al. Mesenchymal stromal cell-derived extracellular matrix influences gene expression of chondrocytes. Biofabrication. 2013;5:025003. doi: 10.1088/1758-5082/5/2/025003. [DOI] [PubMed] [Google Scholar]
- 9.Benders KE, van Weeren PR, Badylak SF, Saris DB, Dhert WJ, Malda J. Extracellular matrix scaffolds for cartilage and bone regeneration. Trends Biotechnol. 2013;31:169–76. doi: 10.1016/j.tibtech.2012.12.004. [DOI] [PubMed] [Google Scholar]
- 10.Wei B, Jin C, Xu Y, Du X, Yan C, Tang C, et al. Chondrogenic Differentiation of Marrow Clots After Microfracture with BMSC-Derived ECM Scaffold In Vitro. Tissue engineering Part A. 2014;20:2646–55. doi: 10.1089/ten.tea.2013.0662. [DOI] [PMC free article] [PubMed] [Google Scholar]
- 11.Lu H, Hoshiba T, Kawazoe N, Chen G. Autologous extracellular matrix scaffolds for tissue engineering. Biomaterials. 2011;32:2489–99. doi: 10.1016/j.biomaterials.2010.12.016. [DOI] [PubMed] [Google Scholar]
- 12.Kotecha M, Klatt D, Magin RL. Monitoring cartilage tissue engineering using magnetic resonance spectroscopy, imaging, and elastography. Tissue Engineering Part B. 2013;19:470–84. doi: 10.1089/ten.teb.2012.0755. [DOI] [PMC free article] [PubMed] [Google Scholar]
- 13.Pothirajan P, Ravindran S, George A, Magin R, Kotecha M. IEEE-EMBC'14. Chicago: IEEE Xplore; 2014. Magnetic resonance spectroscopy and imaging can differentiate between engineered bone and engineered cartilage. in press. [DOI] [PubMed] [Google Scholar]
- 14.Pothirajan P, Dorcemus DL, Nukavarapu S, Kotecha M. True MRI assessment of stem cell chondrogenesis in a tissue engineered matrix. In: Ying L, editor. IEEE-EMBC'14. Chicago: IEEE Xplore; 2014. in press. [DOI] [PubMed] [Google Scholar]
- 15.Kotecha M, Schmid TM, Odintsov B, Magin R. IEEE-EMBC'14. Chicago: IEEE Xplore; 2014. Reduction of water diffusion coefficient with increased engineered cartilage matrix growth observed using MRI. in press. [DOI] [PubMed] [Google Scholar]
- 16.Sharma B, Fermanian S, Gibson M, Unterman S, Herzka DA, Cascio B, et al. Human Cartilage Repair with a Photoreactive Adhesive-Hydrogel Composite. Science Translational Medicine. 2013;5:167ra6. doi: 10.1126/scitranslmed.3004838. [DOI] [PMC free article] [PubMed] [Google Scholar]
- 17.Ravindran S, Gao Q, Kotecha M, Magin RL, Karol S, Bedran-Russo A, et al. Biomimetic extracellular matrix-incorporated scaffold induces osteogenic gene expression in human marrow stromal cells. Tissue engineering Part A. 2012;18:295–309. doi: 10.1089/ten.tea.2011.0136. [DOI] [PMC free article] [PubMed] [Google Scholar]
- 18.Ravindran S, Song Y, George A. Development of three-dimensional biomimetic scaffold to study epithelial-mesenchymal interactions. Tissue engineering Part A. 2010;16:327–42. doi: 10.1089/ten.tea.2009.0110. [DOI] [PMC free article] [PubMed] [Google Scholar]
- 19.Ravindran S, Zhang Y, Huang CC, George A. Odontogenic induction of dental stem cells by extracellular matrix-inspired three-dimensional scaffold. Tissue engineering Part A. 2014;20:92–102. doi: 10.1089/ten.tea.2013.0192. [DOI] [PMC free article] [PubMed] [Google Scholar]
- 20.Ravindran S, Huang CC, George A. Extracellular matrix of dental pulp stem cells: applications in pulp tissue engineering using somatic MSCs. Frontiers in physiology. 2014;4:395. doi: 10.3389/fphys.2013.00395. [DOI] [PMC free article] [PubMed] [Google Scholar]
- 21.Becerra SP, Notario V. The effects of PEDF on cancer biology: mechanisms of action and therapeutic potential. Nature reviews Cancer. 2013;13:258–71. doi: 10.1038/nrc3484. [DOI] [PMC free article] [PubMed] [Google Scholar]
- 22.Filanti C, Dickson GR, Di Martino D, Ulivi V, Sanguineti C, Romano P, et al. The expression of metalloproteinase-2, -9, and -14 and of tissue inhibitors-1 and -2 is developmentally modulated during osteogenesis in vitro, the mature osteoblastic phenotype expressing metalloproteinase-14. Journal of bone and mineral research : the official journal of the American Society for Bone and Mineral Research. 2000;15:2154–68. doi: 10.1359/jbmr.2000.15.11.2154. [DOI] [PubMed] [Google Scholar]
- 23.Menezes NM, Gray ML, Hartke JR, Burstein D. T2 and T1rho MRI in articular cartilage systems. Magnetic resonance in medicine : official journal of the Society of Magnetic Resonance in Medicine / Society of Magnetic Resonance in Medicine. 2004;51:503–9. doi: 10.1002/mrm.10710. [DOI] [PubMed] [Google Scholar]
- 24.Kaully T, Kaufman-Francis K, Lesman A, Levenberg S. Vascularization--the conduit to viable engineered tissues. Tissue engineering Part B, Reviews. 2009;15:159–69. doi: 10.1089/ten.teb.2008.0193. [DOI] [PubMed] [Google Scholar]
- 25.Leddy HA, Guilak F. Site-specific effects of compression on macromolecular diffusion in articular cartilage. Biophysical journal. 2008;95:4890–5. doi: 10.1529/biophysj.108.137752. [DOI] [PMC free article] [PubMed] [Google Scholar]
- 26.Lee CH, Marion NW, Hollister S, Mao JJ. Tissue formation and vascularization in anatomically shaped human joint condyle ectopically in vivo. Tissue engineering Part A. 2009;15:3923–30. doi: 10.1089/ten.tea.2008.0653. [DOI] [PMC free article] [PubMed] [Google Scholar]
- 27.Mao JJ. Stem-cell-driven regeneration of synovial joints. Biology of the cell / under the auspices of the European Cell Biology Organization. 2005;97:289–301. doi: 10.1042/BC20040100. [DOI] [PubMed] [Google Scholar]
- 28.Grayson WL, Chao PH, Marolt D, Kaplan DL, Vunjak-Novakovic G. Engineering custom-designed osteochondral tissue grafts. Trends in biotechnology. 2008;26:181–9. doi: 10.1016/j.tibtech.2007.12.009. [DOI] [PMC free article] [PubMed] [Google Scholar]
- 29.Archer CW, Dowthwaite GP, Francis-West P. Development of synovial joints. Birth defects research Part C, Embryo today : reviews. 2003;69:144–55. doi: 10.1002/bdrc.10015. [DOI] [PubMed] [Google Scholar]
Associated Data
This section collects any data citations, data availability statements, or supplementary materials included in this article.
Supplementary Materials
Supplementary figure 1: Image showing a heat map of T2 relaxation time obtained from MRI of bovine medial femoral condoyle tissue.