Abstract
Quantitative susceptibility mapping (QSM) is a novel MRI technique for measuring tissue magnetic susceptibility in 3D. While there are numerous algorithms developed to solve this ill-posed inverse problem, estimating susceptibility maps with a wide range of values is still problematic. In cases such as large veins, contrast agent uptake, and intracranial hemorrhages, extreme susceptibility values in focal areas cause severe streaking artifacts. To enable the reduction of these artifacts while preserving subtle susceptibility contrast, a two-level QSM reconstruction algorithm (STAR-QSM) was developed in this study by tuning a regularization parameter to automatically reconstruct both large and small susceptibility values. Compared to current state-of-the-art QSM methods such as iLSQR, STAR-QSM significantly reduced streaking artifacts while preserving sharp boundaries for blood vessels of mouse brains in vivo and fine anatomical details of high resolution mouse brains ex vivo. Brain image data from patients with cerebral hematoma and multiple sclerosis further illustrated the superiority of this method in reducing streaking artifacts caused by large susceptibility sources while maintaining sharp anatomical details. STAR-QSM is implemented in STI Suite, a comprehensive shareware for susceptibility imaging and quantification.
Keywords: Quantitative susceptibility mapping, Streaking artifacts reduction, Cerebral hematoma, Multiple sclerosis
Introduction
With the advancement in phase processing techniques, the signal phase of gradient echo (GRE) MRI has become both more informative and useful (1–4). GRE phase provides better contrast between brain gray-white matter tissues than the corresponding magnitude images (5) and exceptionally high contrast at the boundaries of strong susceptibility sources (3,6–8), e.g., intracerebral hemorrhages. Despite their promise, phase values are non-local, i.e., the phase at one location not only depends on the local tissue properties but also depends on the neighboring magnetic susceptibility distribution. Quantitative susceptibility mapping (QSM) addresses this limitation by computing the spatial distribution of the underlying source of the phase, i.e., magnetic susceptibility (9–19). QSM deconvolves the measured magnetic field (derived from phase data) with a dipole kernel. This inverse problem is ill-posed as the dipole kernel becomes zero on a conical surface ( ) in k-space (6,10,14,20,21). The imperfect inversion on and near the conical surface results in streaking artifacts in the computed susceptibility maps (22,23). Different methods have been proposed to solve this problem. In one approach, phase images are acquired in multiple orientations relative to the magnetic field (COSMOS) (24) to yield susceptibility maps free of streaking artifacts. For data acquired in single orientation, various regularization schemes have been used to mitigate such artifacts (12,25,26). While numerous single-orientation algorithms have shown promise in various applications, estimating susceptibility maps with large dynamic range (approximately > 0.3 ppm) remains challenging. Focal areas of large susceptibility sources tend to generate severe streaking artifacts without over regularization being implemented, which unfortunately reduces image contrast and detail.
Previously, we developed an iLSQR method for estimating and removing streaking artifacts for QSM (23). Specifically, iLSQR first uses a sparse linear equation and least-squares (LSQR)-algorithm-based method to firstly derive an initial estimation of the susceptibility map, then uses a fast QSM method (23) to estimate the susceptibility boundaries, and finally uses an iterative approach to estimate the streaking artifacts from ill-conditioned k-space regions only. This is done with a fixed set of parameters for the initial susceptibility estimation and subsequent streaking artifact estimation and removal, which results in significantly reduced streaking artifacts in both healthy brains and multiple sclerosis (MS) patients comparable to those of COSMOS. However, in cases of large, sparsely distributed susceptibility values such as those from micro-hemorrhage, cerebral hematoma, highly paramagnetic veins and gadolinium-based contrast agents, it remains very difficult to suppress the associated streaking artifacts with iLSQR or other existing QSM algorithms (17).
The goal of this study was to develop an algorithm to enable further streaking artifacts reduction in QSM (STAR-QSM) especially for susceptibility maps with large dynamic ranges. The algorithm we developed was based on the widely accepted optimization formulation of L2 + L1 with L2 being the data consistency term and L1 being the regularization term, specifically a total variation (TV) term. This type of formulation has been broadly applied in the optimization literature including applications in MRI (27,28) and QSM (11,25,26,29). STAR-QSM was partially presented at the 3rd International Workshop on MRI Phase Contrast and Quantitative Susceptibility Mapping (30), and improves susceptibility map calculations by reducing streaking artifacts using a two-level regularization approach to reconstruct large and small susceptibility values. In particular, STAR-QSM isolates and calculates strong susceptibility sources automatically by using a large TV weighting parameter (denoted as λ). The dipole field of these sources are then calculated with the forward equation and subtracted from the total phase. The remaining phase is then used to solve for the relatively weaker susceptibility sources by using a smaller TV weighting parameter, β. The result is superimposed onto the strong susceptibility distribution, improving the quality of QSM. This process is automated and does not require human interaction to manually identify locations of large susceptibility values. We tested STAR-QSM extensively with phantom experiments, ex vivo and in vivo mouse experiments, intracerebral hematoma patients and MS patients. STAR-QSM provided improved delineation of blood vessel for in vivo mouse brain, negligible streaking artifacts for the Gd-perfused ex vivo mouse brain, sharp boundaries between the lesions and normal tissues in intracerebral hematoma patients, and improved delineation of white matter lesions in MS patients.
Materials and Methods
QSM algorithms
Given an applied magnetic field (H0), the normalized phase (ψ = φ/γμ0H0TE, with φ being the measured phase at a given TE) and magnetic susceptibility distribution (χ) can be related using the following equation (31,32):
| [1] |
where γ, μ0, H0, and TE are the gyromagnetic ratio, vacuum permeability, applied magnetic field, and echo time, respectively; FT means Fourier transform; and the discrete form of the magnetic dipole convolution kernel, D2, can be calculated from the Fourier transform of the magnetic dipole determined from image space (24,31–33):
| [2] |
where r refers to the vector position, ri are spatial coordinates, Δri are the voxel dimensions, and Ĥ is the applied magnetic field vector.
In essence, the proposed method solves the following equation:
| [3] |
where ψ is the normalized phase with background phase removed and χ is the unknown susceptibility map. The L1 norm computes the total variation of the weighted gradient. λ is a regularization parameter that weights the relative emphasis of data consistency and spatial smoothness.
The L1 norm of the gradient or total variation term is given by:
| [4] |
Gx, Gy, Gz, are gradient operators; the WGx, WGy, WGz are weighting factors derived using the invert-sign Fast QSM estimates (23) for brain tissue without very large susceptibility variation. For the proposed method, Eq. [3] is solved using a SpaRSA solver (34). We refer to this single step method as one-level susceptibility estimation.
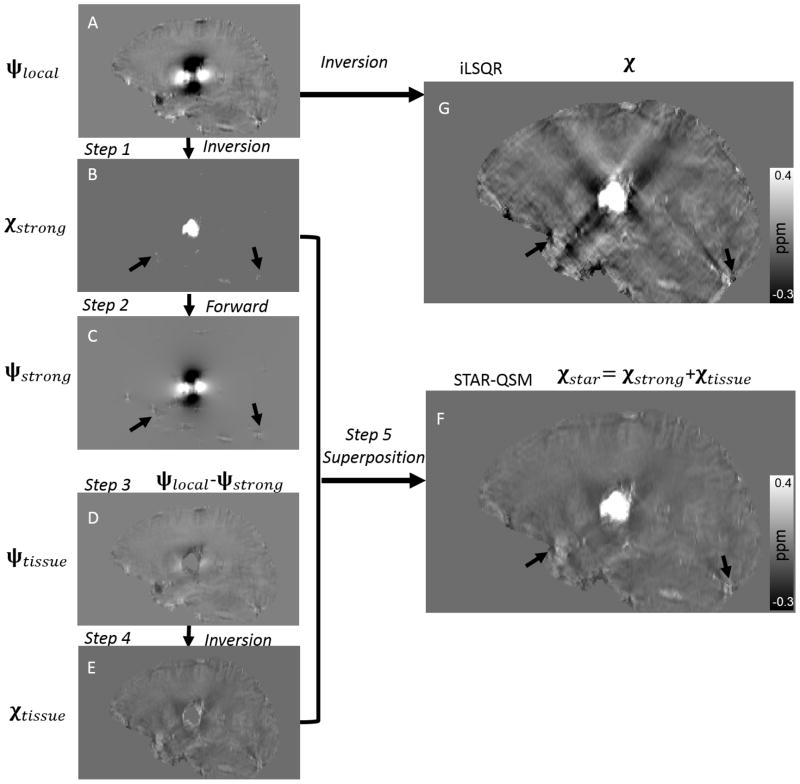
However, a single choice of the regularization parameter λ does not accommodate the potential large variations in susceptibility values. In Eq. [3], λ determines the smoothness of the reconstructed susceptibility map: larger values yield smoother images while smaller values can give better estimations of subtle susceptibility variations. Varying the regularization parameter allows us to control the scale of spatial feature present in the QSM calculation. Therefore, we propose a two-level susceptibility estimation method as illustrated in Fig. 1. ψlocal is the filtered tissue phase, which in this case is calculated with V-SHARP (11). In step 1, Eq. [3] is solved with a large λ, which results in an estimation of the strong susceptibility sources (Fig. 1B). In step 2, the dipole field (Fig. 1C) corresponding to the strong susceptibility sources is obtained by a forward calculation following Eq. [1]. In step 3, this strong dipole field is subtracted from the total phase (Fig. 1D). In step 4, the susceptibility map corresponding to the residual phase is obtained after inversion with a typical, small TV weighting parameter, β (Fig. 1E). Finally, the strong susceptibility (Fig. 1B) is superimposed onto the remaining brain susceptibility (Fig. 1E), yielding the final QSM results in Fig. 1F. We refer to this two-level susceptibility estimation as streaking artifacts reduction for QSM with large dynamic range (STAR-QSM).
Figure 1.
Illustration of the streaking artifact reduction method for QSM (STAR-QSM) accomplished by two-level reconstruction. A: Local field map. B: Strong susceptibility estimation. C: Dipole field corresponding the strong susceptibility in (B). D: Remaining dipole field without strong susceptibility. E: Susceptibility of the remaining brain inverted from (D). F: Final QSM by extracting strong susceptibility (B) and superimposing onto (E). G: QSM of all brain regions inverted from (A) using iLSQR.
Phantom
To evaluate the quantitative accuracy of STAR-QSM, a cylindrical phantom with a known susceptibility distribution was constructed. Gd solutions (ProHance, Bracco Diagnostics Inc, Princeton, NJ) were prepared at 0.25%, 0.5%, 1% and 2% of the raw solution, leading to susceptibilities of 0.4, 0.81, 1.63, and 3.26 ppm at room temperature, assuming a molar susceptibility of 326 ppm L/mol at 293 K (20). A 10 ml volume of each solution was poured into long latex balloons, each with an 8-mm diameter and a 30-cm length. The balloons were embedded in a cylindrical container filled with water (diameter 10-cm; height 30-cm). The wall thickness of the balloons (100-μm) was smaller than one pixel to make sure that the susceptibility effects created by the balloons were minimal. The balloons were fixed to the bottom of the container using super glue. The four balloons were separated by a plastic disk with four holes designed to keep the balloons straight in the container.
Imaging was conducted using a birdcage coil on a GE MR750 3 T scanner (GE Healthcare, Waukesha, WI). The phantom was placed vertically on the patient table. A multiecho 3D spoiled-gradient-recalled (SPGR) sequence was performed with the following parameters: flip angle (FA) = 10°, TE1/ΔTE/TE2 = 3.00/2.12/5.12 ms, TR = 34 ms, field of view (FOV) = 192×192×124 mm3, 1 mm isotropic resolution, and readout bandwidth of 62.5 kHz.
Animal imaging
Image data from an ex vivo mouse brain perfused with 50 mM of Gd-HP-DO3A (ProHance; Bracco Diagnostics, Princeton, NJ) in phosphate-buffered saline (PBS) was acquired using a 9.4 T (400 MHz) 8.9-cm vertical bore Oxford magnet with shielded gradients of 2200 mT/m. The perfusion and fixation procedure followed (35). The specimen was scanned using a 3D SPGR sequence with the following scan parameters: FOV = 22×11×11 mm3, matrix size = 512×256×256 with 43-μm isotropic resolution, TE = 9 ms, TR = 100 ms, FA = 60°. Total acquisition time was 1 hour 49 minutes.
An in vivo mouse brain experiment was performed on a 7 T, 20-cm-bore magnet (Bruker BioSpec 70/20 USR, Billerica, MA, USA) interfaced to an Avance III system. The scanner has actively shielded gradients (440 mT/m amplitude) with integrated shims up to second order. A high-sensitivity, cryogenic radiofrequency coil was used for transmission and reception (Bruker CryoProbe). The mouse was scanned using a 3D SPGR sequence with multiecho acquisition and the following scan parameters: TE1/ΔTE/TE10 = 3.72/5.52/53.4 ms, TR = 250 ms, FA = 35°, FOV = 19.2×14.4×9.6 mm3 with 87 μm isotropic resolution. Data acquisition was respiratory gated with typically two pulse sequence repetitions per respiratory cycle. The first of the two repetitions began immediately after exhalation and the second immediately prior to inspiration to minimize motion artifacts. Total acquisition time was about 90 minutes.
Human Brain MR Imaging
Five cerebral hematoma patients were scanned using a GE Signa HDxt 3 T scanner (GE Healthcare, Waukesha, WI) equipped with an 8-channel head coil. Phase images with whole-brain coverage were acquired using a standard flow-compensated 3D SPGR sequence with the following parameters: TE1/ΔTE/TE16 = 3.16/4.85/75.9 ms, TR = 43 ms, FA = 12°, FOV = 220×220×132 mm3, matrix size = 256×256×66. This protocol resulted in an isotropic in-plane resolution (0.86×0.86 mm2) with 2 mm slice thickness. Total acquisition time was about 12 minutes.
In vivo brain image data from 4 patients with multiple sclerosis were acquired on a GE MR750 3.0T scanner using the 3D SPGR sequence with the following parameters: TE1/ΔTE/TE16 = 3.00/4.18/65.7 ms, TR = 54 ms, FA = 12°, FOV = 220×220×132 mm3, matrix size = 256×256×132, spatial resolution = 0.86×0.86×1 mm3. All experiments were approved by the local institutional review boards. Total acquisition time was about 30 minutes.
Image Analysis
Human brain data were interpolated to an isotropic resolution of 0.86×0.86×0.86 by zero padding in k-space. The raw phase was unwrapped using Laplacian-based phase unwrapping. The normalized phase ψ was calculated as:
| [5] |
where n is the number of echoes. The normalized background phase was removed by V-SHARP (11,23). The magnitude image was used for extracting the brain tissue. The magnetic susceptibility was determined using STAR-QSM and compared with iLSQR. The iterative solver was terminated when the relative residual norm was less than 0.01 (200 iterations maximum). All of the programs were written using Matlab R2011b (Mathworks, Natick, MA).
Results
Algorithm parameter optimization
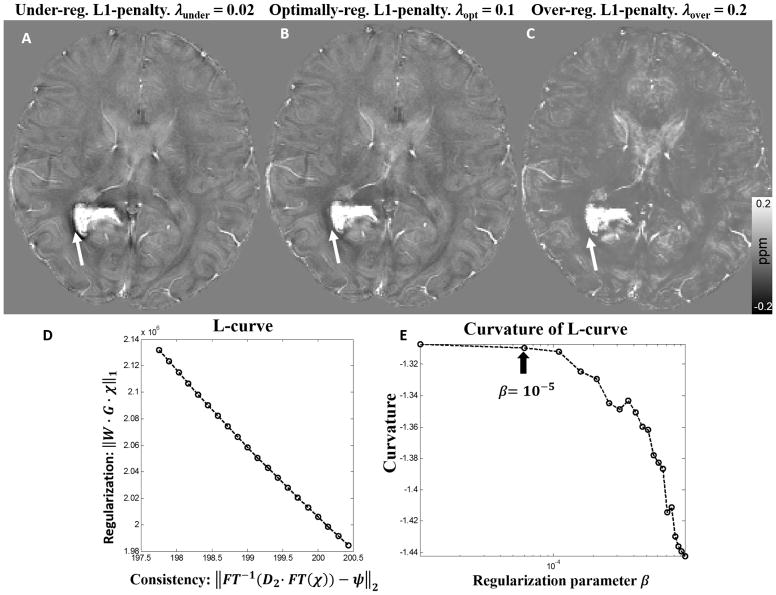
The goal of parameter optimization for STAR-QSM is to select the parameter for each level of reconstruction in order to achieve both effective streaking artifact removal and accurate susceptibility quantification. The large regularization parameter, λ, was used in the first-level reconstruction to detect the strong susceptibility sources and separate them from the surrounding tissues. In the ideal case, strong susceptibility source regions would be perfectly isolated. However, the larger λ is, the smaller the detected strong susceptibility volume. Fig. 2 shows the susceptibility maps provided by different levels of regularization on a hematoma patient. Choosing a parameter that is too small, such as 0.02, results in the under-regularized QSM image seen in Fig. 2A, wherein the hematoma boundary is contaminated by artifacts. Conversely, choosing a parameter that is too large, such as 0.2, results in an over-regularized solution (Fig. 2C), wherein artifacts are suppressed, but the normal gray-white matter contrast drops significantly. When the proper regularization parameter (0.1) was selected (Fig. 2B), the QSM image is without obvious artifacts, and white and gray matter regions are clearly distinguished. Once the strong susceptibility source was detected from the first-level reconstruction, the corresponding dipole field was then removed from the remaining brain regions. The second-level reconstruction then calculated the susceptibility of the remaining brain regions without the strong susceptibility source. This step fully inverted the remaining dipole field as shown by step 4 in Fig. 1. The optimization for the relative small regularization parameter can be determined by maximizing the curvature of the L-curve. Each point on the L-curve was reconstructed using 200 iterations of the L1 regularization. In order to distinguish it from the first-level parameter (λ), the second-level regularization parameter was referred to as β. The corner of the L-curve is not obvious (Fig. 2D), however, the optimum regularization parameter can be determined from the curvature with β < 10−5 (Fig. 2E). Therefore, 10−5 was selected as the optimal parameter in the second step reconstruction. This parameter was fixed for the QSM reconstruction of the tissues with narrow susceptibility range. Therefore, for STAR-QSM, the regularization parameter λ in the first-level reconstruction is the only user-defined parameter.
Figure 2.
(A–C). Comparison of reconstructed cerebral hematoma susceptibility maps obtained using different L1 penalties (λ) in the first level reconstruction. A: Under-regularized, B: optimally regularized, C: over-regularized susceptibility maps. (D, E): The L-curve determined the L1 penalty in the second level reconstruction. The parameter that maximized the curvature was β = 10−5.
Gadolinium Phantom
Results of the phantom experiments are shown in Fig. 3. Both the coronal and sagittal cross sections of the QSM showed severe streaking artifacts for the iLSQR method. However, the susceptibility maps calculated using the proposed method were essentially artifact free with the regularization parameter λ = 0.2. A plot of estimated versus true susceptibility for the four tubes gives a slope of 0.96 and 0.98 for iLSQR and STAR-QSM, respectively. For each Gd concentration, the standard errors were 8%, 3%, 3%, and 5% for iLSQR while 6%, 2.5%, 3%, and 6% for STAR-QSM, respectively. The results calculated using both methods showed good agreement with ground truth susceptibility values. The increase in susceptibility as a function of Gd concentration can be seen in the coronal view for both reconstruction methods.
Figure 3.
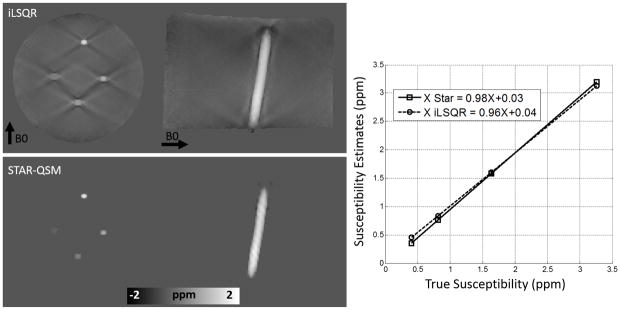
Comparison between iLSQR and STAR-QSM reconstructions on a gadolinium solution phantom. First row: iLSQR results. Second row: STAR-QSM results with reduced streaking artifacts. Right: The linear relationship between increasing susceptibility contrast and increasing gadolinium concentration is more accurately calculated for the STAR-QSM results.
Ex Vivo Mouse Brain Perfused with Gadolinium
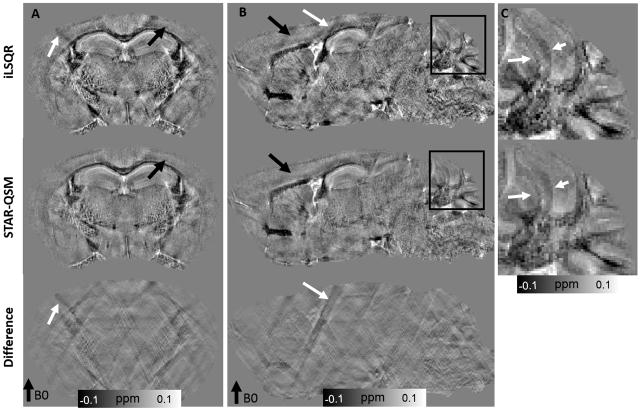
As shown in Fig. 4, the computed magnetic susceptibility showed substantial contrast in the ex vivo mouse brain perfused with Gd. Even though the susceptibility contrast between gray and white matter was already high in the iLSQR reconstruction, this contrast was better revealed by STAR-QSM with the regularization parameter λ = 0.1 and β = 1.0×10⁻⁵. The streaking artifacts caused by the hyper-intense (Gd-filled) ventricles with strong magnetic susceptibility (white arrow in Fig. 4B) were suppressed by using STAR-QSM. Streaking artifact reduction also improved image contrast and clearly delineated the white matter regions. Cortical layers were more clearly observed in the data produced by STAR-QSM compared to iLSQR as indicated by the black arrows in Fig. 4A and Fig. 4B. Furthermore, clearer image contrast between multiple cerebellar layers (Fig. 4C) was observed in the susceptibility map computed from STAR-QSM.
Figure 4.
Coronal and sagittal views of ex vivo mouse brain susceptibility maps comparing iLSQR and STAR-QSM. First row: susceptibility maps obtained using iLSQR. Second row: susceptibility maps obtained using STAR-QSM. Third row: the susceptibility difference between iLSQR and STAR-QSM. C: zoomed regions of the cerebellum corresponding to the black boxes in (B). The intensity scale of the susceptibility maps represent diamagnetic regions (such as white matter) as dark pixels and paramagnetic regions (such as the Gd-filled ventricles) as bright pixels.
In Vivo Mouse Brain
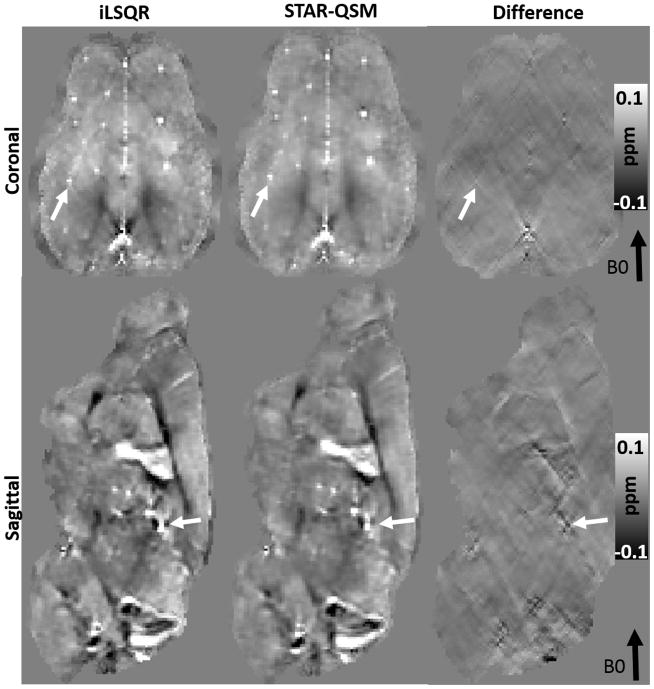
The iLSQR and STAR-QSM methods were applied to the mouse brain data acquired in vivo. The representative susceptibility maps and the difference between the two methods are shown in Fig. 5. For the iLSQR method, the blood vessels with strong susceptibility values showed streaking artifacts in the coronal image plane. These artifacts were largely eliminated by the STAR-QSM method (examples indicated by the arrows, λ = 0.1, β = 1.0×10⁻⁵). From the difference map (right column), there were negligible susceptibility differences related to blood vessels between iLSQR and STAR-QSM. In contrast, the artifacts in white matter generated by the blood vessels do appear in the difference maps. This suggested that STAR-QSM produced similar susceptibility values to iLSQR while significantly reduced streaking artifacts, which was consistent with the phantom results (Fig. 3). While the accuracy of the two methods applied to these data was difficult to assess due to the complicated structure and small diameters of the blood vessels, the STAR-QSM offered excellent, sharp boundaries for these structures, as can be seen in both the coronal and sagittal views.
Figure 5.
Coronal and sagittal views of susceptibility image data comparing each QSM method in the in vivo mouse brain. First column: susceptibility using iLSQR. Second column: susceptibility using STAR-QSM. Third column: the susceptibility difference between iLSQR and STAR-QSM.
Cerebral Hematoma
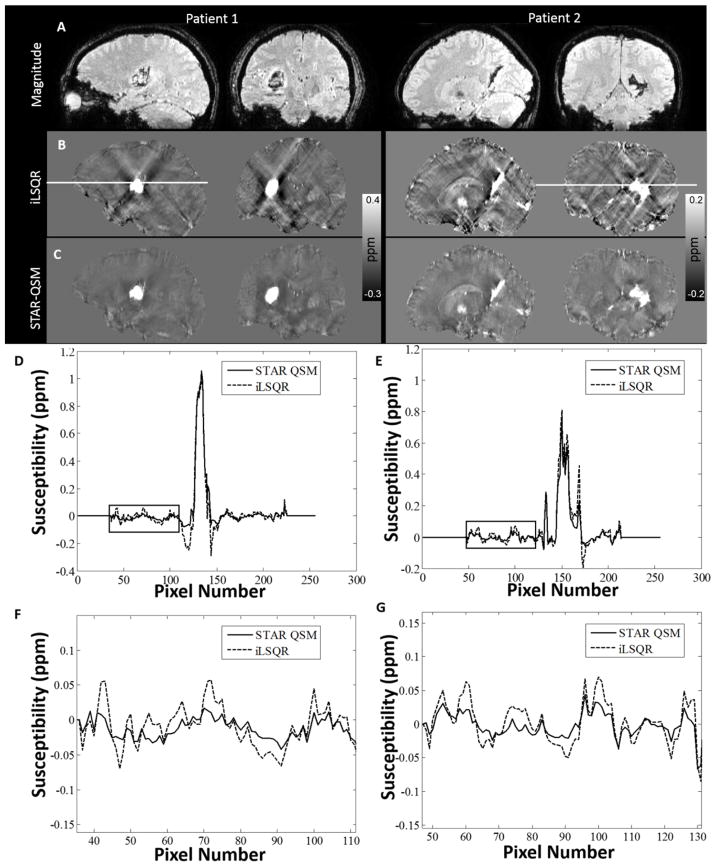
Magnitude and QSM images from two hematoma patients (patient 1 with large and patient 2 with relatively small hemorrhages) were shown in Fig. 6. Large streaking artifacts in the iLSQR reconstruction degraded the image quality throughout the whole brain. For patient 1, tissue susceptibility values near the hematoma were severely affected by artifacts (hypo-intense pixels), with some surrounding regions completely obscured. STAR-QSM, on the other hand, highly suppressed streaking artifacts caused by the strong susceptibility of the hematoma, resulting in cleaner and sharper boundaries between hematoma lesions and surrounding tissues. For patient 2 (smaller hematoma lesions), not only were the surrounding tissues affected by streaking artifacts, but also the lesions themselves. The QSM images computed by iLSQR showed streaking artifacts in the hematoma lesions. With STAR-QSM (λ = 0.1, β = 1.0×10⁻⁵), the shadowing artifacts associated with the hematoma were successfully removed, allowing for clear delineation of lesion regions. Fig. 6D–E compare a representative line profile through the magnetic susceptibility maps calculated from the two methods. For patient 1, the susceptibility profiles were relatively consistent between the two methods in the majority of the normal tissue, although some small differences exist at edge of the brain (Fig. 6F–G). In contrast, the susceptibility values of the tissues surrounding the hemorrhage lesions show large differences due to the shadowing artifacts (black arrows, Fig. 6D–E).
Figure 6.
Comparison of QSM reconstructed by the two methods on two intracerebral hematoma patients. A: magnitude image. B: susceptibility maps computed by iLSQR. C: susceptibility maps computed by STAR-QSM. D: Profile plots corresponding to the white line on the sagittal view between iLSQR and STAR-QSM on patient 1. E: Profile plots corresponding to the white line on the coronal view on patient 2. F, G: Amplified susceptibility profile corresponding to the black boxes in D, E. (Patient 1: 46-year-old female. Patient 2: 15-year-old male).
MS patients
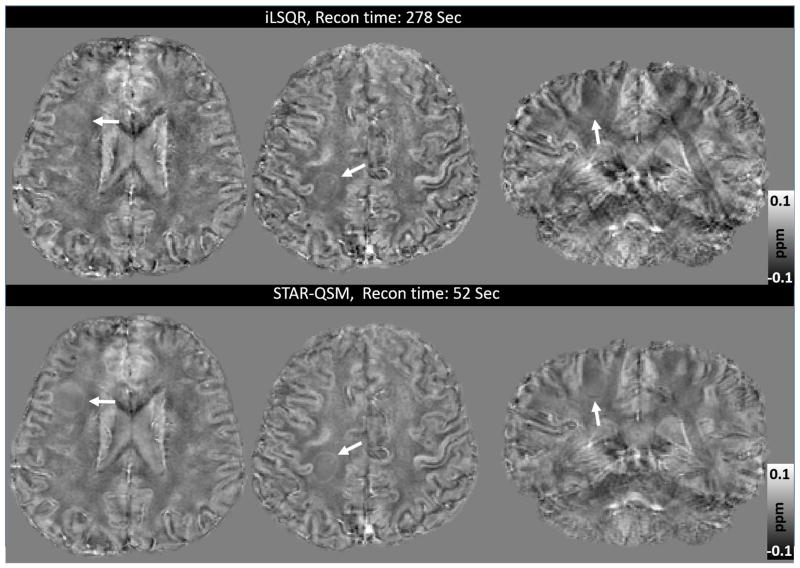
Similar improvements to image quality were observed when the STAR-QSM method (λ = 0.1, β = 1.0×10⁻⁵) was applied to the MS patient data. The iLSQR-computed susceptibility maps exhibited artifacts and noisy signal inside the lesions, as shown in Fig. 7. STAR-QSM removed both the artifacts and noise, accurately distinguished the geometrical shape of MS lesions, and provided much better visualization of white matter lesions. This may allow for the differentiation of lesions from the surrounding normal white matter tissues with higher accuracy.
Figure 7.
Representative lesions in an MS patient demonstrate the difference between the susceptibility maps provided by iLSQR and STAR-QSM. Top row: susceptibility computed by iLSQR. Bottom row: susceptibility computed by STAR-QSM. The lesions are more clearly delineated in the images reconstructed provided by STAR-QSM. (Patient: 45-year-old female).
Another advantage of STAR-QSM is the fast computation; this reconstruction is done several times faster than iLSQR. This is because STAR-QSM benefits from the soft thresholding used in the L1-regularization that is very suitable for 3D QSM reconstruction applications. Both computations were performed on a desktop with an Intel Core i7-4770 ™ CPU and 16GB RAM, and the computation time for each dataset are shown in Table 1.
Table 1.
Reconstruction times for iLSQR and STAR-QSM performed on data from the four different experiments.
| In vivo mouse brain | Ex vivo mouse brain | Hematoma patient | MS patient | |
|---|---|---|---|---|
| Matrix size | 220×166×110 | 512×256×256 | 256×256×154 | 256×256×132 |
| iLSQR (sec) | 220 | 580 | 292 | 278 |
| STAR-QSM (sec) | 41 | 118 | 55 | 52 |
Discussion
In this study, we presented a novel two-level reconstruction method to reduce the streaking artifacts in QSM. Specifically, this method first estimated regions with strong susceptibility automatically by using the large TV weighting parameter. Then the dipole field caused by strong susceptibility sources was estimated with the forward equation and removed from the total tissue phase. The remaining phase was then used to solve for the relatively weaker susceptibility sources and the result is superimposed onto the strong susceptibility distribution, resulting in an improved quality of QSM. This two-level reconstruction method is referred to as the STAR-QSM method. Compared to iLSQR, STAR-QSM demonstrated improved quantification of a wide range of susceptibility sources, as verified by the agreement with the ground truth in the phantom study. Additionally, the proposed method markedly improved image quality with negligible streaking artifacts for various applications in small animal and human brain experiments. STAR-QSM is implemented in STI Suite and can be downloaded at http://people.duke.edu/~cl160/.
Susceptibility inversion is a highly ill-posed problem. Small phase error can be substantially amplified in the resulting QSM and cause large streaking artifacts (11,23,30). In order to remove streaking artifacts effectively while maintaining accurate susceptibility quantification using STAR-QSM, it is necessary to determine the appropriate regularization parameters for each level of reconstruction. The larger regularization parameter, λ, was used in the first level to detect strong susceptibility sources and separate them from the surrounding tissues. For example, in Fig. 1C, not only the hematoma lesions, but also blood vessels at the brain edges can be isolated from the total phase as indicated by the arrows. The resulting QSM has improved artifact suppression at the brain edges and can be observed in Fig. 1F. One potential limitation here is that the challenge of selecting the regularization parameter λ without a priori knowledge of the range of underlying susceptibility values. The regularization parameter needs to be adjusted with respect to the extreme susceptibility values. In this study, for example, the regularization parameter λ was 0.2 for the phantom and 0.1 for the in vivo mouse brain, ex vivo mouse brain perfused with Gd, cerebral hematoma, and MS patients. The mean strong susceptibility values were about 1.6 ppm for the phantom and 0.9 ppm for hematoma patients. As a result, the regularization parameter λ was larger for phantom data than for hematoma.
The proposed two-level reconstruction method differs from the previous study (36) using threshold-based k-space/image domain iterative reconstruction approach to reduce the streaking artifacts, which uses geometric information from the susceptibility map as a constraint to overcome the ill-posed nature introduced by the inverse filter. In that approach, the authors iteratively replace k-space values associated with the susceptibility map near the singularities to obtain an almost artifact-free QSM. On the other hand, the proposed STAR-QSM operates in image space and seeks to separate susceptibility sources with much larger dynamic range, such as those seen in hematoma patients.
Though STAR-QSM significantly improved image quality by reducing the streaking artifacts, such artifacts could not be completely removed from regions surrounding particularly large lesions (Fig. 1F). In some types of hematoma, the signal decays very rapidly in and near the hematoma due to a short T2*, which results in the errors in phase measurements. Streaking artifacts may also spawn from imperfectly unwrapped phase and residual background phase. Eliminating such artifacts completely will require greater understanding of error sources, improved phase processing, and more robust susceptibility reconstruction techniques.
The enhanced image quality provided by STAR-QSM may be especially helpful for imaging intracerebral hematoma since susceptibility maps generated using this method not only have clear boundaries between the hematoma and the surrounding tissue, but also can provide the quantitative susceptibility values of the hematoma produced by blood. Current MRI techniques for imaging cerebral hematoma are generally not quantitative, whereas, treating the hematoma may require volume measurement (37,38). Particularly, QSM with reduced streaking artifact around hematoma would allow more accurate quantification of susceptibility values produced by the blood, permitting potential staging of the bleeding. The application of standard QSM methods to hematoma volume measurement and susceptibility quantification is limited in that susceptibility values in the central hematoma can be affected by the complicated boundary shape (9). Similar susceptibility values were found inside the lesions between iLSQR and STAR-QSM performed on patient 1, in which the hematoma region was round. On the other hand, the susceptibility values from iLSQR and STAR-QSM differed substantially inside the hematoma in patient 2 likely due to the complicated lesion geometry and the streaking artifacts in iLSQR. The apparent higher contrast of the susceptibility profile outside the hematoma lesions computed by iLSQR is contributed by two sources. One is the streaking artifacts created not only by the hematoma itself but also by the strong susceptibility sources (i.e., veins) near the brain edges (black arrows in Fig. 1G). The other is noise amplification, a major issue in the ill-posed inverse calculation, which manifests itself as streaking artifacts and quantification errors in QSM. On the other hand, STAR-QSM incorporates a total variation term as a regularizer in Eq. [3], which can effectively suppress noise amplification (11). Using the two level QSM reconstruction, the streaking artifacts were significantly reduced. Although the phantom experiment illustrated the accuracy of STAR-QSM compared to the ground truth, it remains to be determined if the TV term reduces normal tissue contrast even with the small regularization parameter chosen (β = 1.0×10⁻⁵)”. The representative line profiles (Fig. 6D–E) showed the reduced susceptibility errors around the hematoma when using the proposed method. It is acknowledged that the actual accuracy of each method is difficult to assess since no “ground truth” information is available. However, STAR-QSM enables clear delineation of the hematoma boundaries with less artifact contamination. Such evidence reinforces that the susceptibility quantification provided by our new two-level reconstruction method was satisfactorily accurate.
The enhanced image quality with lower noise level performed on the MS patients provided by STAR-QSM may be especially helpful for imaging MS. Although there are no obvious large susceptibility sources within the MS lesions themselves, veins near the brain edges generally appear highly paramagnetic. Such strong sources will create numerous streaking artifacts throughout the whole brain. As a result, not only the white matter MS lesions, but also the normal brain tissue will be degraded by such artifacts (shown by the black arrows in Fig. 1B, C, G, F). STAR-QSM can estimate the strong susceptibility sources and remove the resulting streaking artifacts. This artifact reduction allows for clearer visualization of MS lesions and normal brain tissues. Furthermore, incorporating the total variation term as a regularization term in the core function of STAR-QSM in Eq. [3], alleviates the amplified noise propagation of the ill-posed inverse calculation and improves the quality of the susceptibility map. Specifically, this regularization yields clearer MS lesions boundaries and lower noise levels compared to iLSQR.
Conclusion
In this article, we proposed a new QSM reconstruction method, STAR-QSM, for reducing streaking artifacts caused by strong suceptibility sources. The dipole fields of the strong susceptibility sources was determined and then separated from the total phase to remove streaking artifacts. Phantom, in vivo and ex vivo mouse brain, and cerebral hematoma and MS patient data showed significantly reduced streaking artifacts with improved image quality. The enhancement is helpful for various applications, particularly imaging human intracerebral hematoma.
Supplementary Material
Acknowledgments
This study was supported in part by the National Institutes of Health through grants NIBIB P41EB015897, NIBIB T32EB001040, NIMH R01MH096979, NINDS R01NS079653, NIMH R24MH106096 and NHLBI R21HL122759, and by the National Multiple Sclerosis Society through grant RG4723.
Abbreviations used
- QSM
quantitative susceptibility mapping
- STAR-QSM
streaking artifacts reduction for QSM
- GRE
gradient echo
- MS
multiple sclerosis
- TV
total variation
- SPGR
spoiled-gradient-recalled
- FA
flip angle
- FOV
field of view
References
- 1.Abduljalil AM, Schmalbrock P, Novak V, Chakeres DW. Enhanced gray and white matter contrast of phase susceptibility-weighted images in ultra-high-field magnetic resonance imaging. J Magn Reson Imaging. 2003;18:284–290. doi: 10.1002/jmri.10362. [DOI] [PubMed] [Google Scholar]
- 2.Haacke EM, Xu Y, Cheng Y-CN, Reichenbach JR. Susceptibility weighted imaging (SWI) Magn Reson Med. 2004;52:612–618. doi: 10.1002/mrm.20198. [DOI] [PubMed] [Google Scholar]
- 3.Wycliffe ND, Choe J, Holshouser B, Oyoyo UE, Haacke EM, Kido DK. Reliability in detection of hemorrhage in acute stroke by a new three-dimensional gradient recalled echo susceptibility-weighted imaging technique compared to computed tomography: A retrospective study. J Magn Reson Imaging. 2004;20:372–377. doi: 10.1002/jmri.20130. [DOI] [PubMed] [Google Scholar]
- 4.Rauscher A, Sedlacik J, Barth M, Mentzel HJ, Reichenbach JR. Magnetic susceptibility-weighted MR phase imaging of the human brain. Am J Neuroradiol. 2005;26:736–742. [PMC free article] [PubMed] [Google Scholar]
- 5.Duyn JH, van Gelderen P, Li T-Q, de Zwart Ja, Koretsky AP, Fukunaga M. High-field MRI of brain cortical substructure based on signal phase. Proc Natl Acad Sci U S A. 2007;104:11796–11801. doi: 10.1073/pnas.0610821104. [DOI] [PMC free article] [PubMed] [Google Scholar]
- 6.Shmueli K, de Zwart Ja, van Gelderen P, Li T-Q, Dodd SJ, Duyn JH. Magnetic susceptibility mapping of brain tissue in vivo using MRI phase data. Magn Reson Med. 2009;62:1510–1522. doi: 10.1002/mrm.22135. [DOI] [PMC free article] [PubMed] [Google Scholar]
- 7.Fukunaga M, Li T-Q, van Gelderen P, et al. Layer-specific variation of iron content in cerebral cortex as a source of MRI contrast. Proc Natl Acad Sci U S A. 2010;107:3834–3839. doi: 10.1073/pnas.0911177107. [DOI] [PMC free article] [PubMed] [Google Scholar]
- 8.Lee J, Shmueli K, Fukunaga M, van Gelderen P, Merkle H, Silva AC, Duyn JH. Sensitivity of MRI resonance frequency to the orientation of brain tissue microstructure. Proc Natl Acad Sci U S A. 2010;107:5130–5135. doi: 10.1073/pnas.0910222107. [DOI] [PMC free article] [PubMed] [Google Scholar]
- 9.Li N. Magnetic susceptibility quantification for arbitrarily shaped objects in inhomogeneous fields. Magn Reson Med. 2001;46:907–916. doi: 10.1002/mrm.1276. [DOI] [PubMed] [Google Scholar]
- 10.Li W, Wu B, Liu C. Quantitative susceptibility mapping of human brain reflects spatial variation in tissue composition. NeuroImage. 2011;55:1645–1656. doi: 10.1016/j.neuroimage.2010.11.088. [DOI] [PMC free article] [PubMed] [Google Scholar]
- 11.Wu B, Li W, Guidon A, Liu C. Whole brain susceptibility mapping using compressed sensing. Magn Reson Med. 2012;67:137–147. doi: 10.1002/mrm.23000. [DOI] [PMC free article] [PubMed] [Google Scholar]
- 12.De Rochefort L, Liu T, Kressler B, Liu J, Spincemaille P, Lebon V, Wu J, Wang Y. Quantitative susceptibility map reconstruction from MR phase data using bayesian regularization: Validation and application to brain imaging. Magn Reson Med. 2010;63:194–206. doi: 10.1002/mrm.22187. [DOI] [PubMed] [Google Scholar]
- 13.Wharton S, Schäfer A, Bowtell R. Susceptibility mapping in the human brain using threshold-based k-space division. Magn Reson Med. 2010;63:1292–1304. doi: 10.1002/mrm.22334. [DOI] [PubMed] [Google Scholar]
- 14.Liu T, Wisnieff C, Lou M, Chen W, Spincemaille P, Wang Y. Nonlinear formulation of the magnetic field to source relationship for robust quantitative susceptibility mapping. Magn Reson Med. 2013;69:467–476. doi: 10.1002/mrm.24272. [DOI] [PubMed] [Google Scholar]
- 15.Schweser F, Deistung A, Sommer K, Reichenbach JR. Toward online reconstruction of quantitative susceptibility maps: Superfast dipole inversion. Magn Reson Med. 2013;69:1582–1594. doi: 10.1002/mrm.24405. [DOI] [PubMed] [Google Scholar]
- 16.Sun H, Wilman AH. Background field removal using spherical mean value filtering and Tikhonov regularization. Magn Reson Med. 2014;71:1151–1157. doi: 10.1002/mrm.24765. [DOI] [PubMed] [Google Scholar]
- 17.Chen W, Zhu W, Kovanlikaya I, Kovanlikaya A, Liu T, Wang S, Salustri C, Wang Y. Intracranial calcifications and hemorrhages: characterization with quantitative susceptibility mapping. Radiology. 2014;270:496–505. doi: 10.1148/radiol.13122640. [DOI] [PMC free article] [PubMed] [Google Scholar]
- 18.Bonekamp D, Barker PB, Leigh R, van Zijl PCM, Li X. Susceptibility-based analysis of dynamic gadolinium bolus perfusion MRI. Magn Reson Med. 2014;554:544–554. doi: 10.1002/mrm.25144. [DOI] [PMC free article] [PubMed] [Google Scholar]
- 19.Balla DZ, Sanchez-Panchuelo RM, Wharton SJ, Hagberg GE, Scheffler K, Francis ST, Bowtell R. Functional quantitative susceptibility mapping (fQSM) NeuroImage. 2014;100:112–124. doi: 10.1016/j.neuroimage.2014.06.011. [DOI] [PubMed] [Google Scholar]
- 20.De Rochefort L, Brown R, Prince MR, Wang Y. Quantitative MR susceptibility mapping using piece-wise constant regularized inversion of the magnetic field. Magn Reson Med. 2008;60:1003–1009. doi: 10.1002/mrm.21710. [DOI] [PubMed] [Google Scholar]
- 21.Wen Y, Wang Y, Liu T. Enhancing k-space quantitative susceptibility mapping by enforcing consistency on the cone data (CCD) with structural priors. Magn Reson Med. 2015 doi: 10.1002/mrm.25652. Epub Ahead. [DOI] [PMC free article] [PubMed] [Google Scholar]
- 22.Schweser F, Sommer K, Deistung A, Reichenbach JR. Quantitative susceptibility mapping for investigating subtle susceptibility variations in the human brain. Neuroimage. 2012;62:2083–2100. doi: 10.1016/j.neuroimage.2012.05.067. [DOI] [PubMed] [Google Scholar]
- 23.Li W, Wang N, Yu F, Han H, Cao W, Romero R, Tantiwongkosi B, Duong TQ, Liu C. A method for estimating and removing streaking artifacts in quantitative susceptibility mapping. NeuroImage. 2015;108:111–122. doi: 10.1016/j.neuroimage.2014.12.043. [DOI] [PMC free article] [PubMed] [Google Scholar]
- 24.Liu T, Spincemaille P, De Rochefort L, Kressler B, Wang Y. Calculation of susceptibility through multiple orientation sampling (COSMOS): A method for conditioning the inverse problem from measured magnetic field map to susceptibility source image in MRI. Magn Reson Med. 2009;61:196–204. doi: 10.1002/mrm.21828. [DOI] [PubMed] [Google Scholar]
- 25.Bilgic B, Pfefferbaum A, Rohlfing T, Sullivan EV, Adalsteinsson E. MRI estimates of brain iron concentration in normal aging using quantitative susceptibility mapping. NeuroImage. 2012;59:2625–2635. doi: 10.1016/j.neuroimage.2011.08.077. [DOI] [PMC free article] [PubMed] [Google Scholar]
- 26.Langkammer C, Bredies K, Poser Ba, Barth M, Reishofer G, Fan AP, Bilgic B, Fazekas F, Mainero C, Ropele S. Fast quantitative susceptibility mapping using 3D EPI and total generalized variation. NeuroImage. 2015 doi: 10.1016/j.neuroimage.2015.02.041. Epub Ahead. [DOI] [PubMed] [Google Scholar]
- 27.Lustig M, Donoho D, Pauly JM. Sparse MRI: The application of compressed sensing for rapid MR imaging. Magn Reson Med. 2007;58:1182–1195. doi: 10.1002/mrm.21391. [DOI] [PubMed] [Google Scholar]
- 28.Liang D, Wang H, Chang Y, Ying L. Sensitivity encoding reconstruction with nonlocal total variation regularization. Magn Reson Med. 2011;65:1384–1392. doi: 10.1002/mrm.22736. [DOI] [PubMed] [Google Scholar]
- 29.Bilgic B, Fan AP, Polimeni JR, Cauley SF, Bianciardi M, Adalsteinsson E, Wald LL, Setsompop K. Fast quantitative susceptibility mapping with L1-regularization and automatic parameter selection. Magn Reson Med. 2013;1459:1444–1459. doi: 10.1002/mrm.25029. [DOI] [PMC free article] [PubMed] [Google Scholar]
- 30.Wei H, Li W, Wang N, Liu C. Streaking Artifact Reduction for QSM. 3rd Int. Work. MRI Phase Contrast Quant. Susceptibility Mapping; Durham, NC, USA. Oct. 6–8, 2014. [Google Scholar]
- 31.Salomir R, De Senneville BD, Moonen CTW. A fast calculation method for magnetic field inhomogeneity due to an arbitrary distribution of bulk susceptibility. Concepts Magn Reson Part B Magn Reson Eng. 2003;19:26–34. [Google Scholar]
- 32.Marques JP, Bowtell R. Application of a fourier-based method for rapid calculation of field inhomogeneity due to spatial variation of magnetic susceptibility. Concepts Magn Reson Part B Magn Reson Eng. 2005;25:65–78. [Google Scholar]
- 33.Wharton S, Bowtell R. Whole-brain susceptibility mapping at high field: A comparison of multiple- and single-orientation methods. Neuroimage. 2010;53:515–525. doi: 10.1016/j.neuroimage.2010.06.070. [DOI] [PubMed] [Google Scholar]
- 34.Wright SJ, Nowak RD, Figueiredo MaT. Sparse reconstruction by separable approximation. IEEE Trans Signal Process. 2009;57:2479–2493. [Google Scholar]
- 35.Dibb R, Li W, Cofer G, Liu C. Microstructural origins of gadolinium-enhanced susceptibility contrast and anisotropy. Magn Reson Med. 2014;1711:1702–1711. doi: 10.1002/mrm.25082. [DOI] [PMC free article] [PubMed] [Google Scholar]
- 36.Tang J, Liu S, Neelavalli J, Cheng YCN, Buch S, Haacke EM. Improving susceptibility mapping using a threshold-based K-space/image domain iterative reconstruction approach. Magn Reson Med. 2013;69:1396–1407. doi: 10.1002/mrm.24384. [DOI] [PMC free article] [PubMed] [Google Scholar]
- 37.Christoforidis Ga, Slivka A, Mohammad Y, Karakasis C, Avutu B, Yang M. Size matters: Hemorrhage volume as an objective measure to define significant intracranial hemorrhage associated with thrombolysis. Stroke. 2007;38:1799–1804. doi: 10.1161/STROKEAHA.106.472282. [DOI] [PubMed] [Google Scholar]
- 38.Zimmerman RD, Maldjian Ja, Brun NC, Horvath B, Skolnick BE. Radiologic estimation of hematoma volume in intracerebral hemorrhage trial by CT scan. Am J Neuroradiol. 2006;27:666–670. [PMC free article] [PubMed] [Google Scholar]
Associated Data
This section collects any data citations, data availability statements, or supplementary materials included in this article.


