

Abstract
Our aim was to investigate the relation between PBDEs and fetal growth or newborn anthropometry in a Spanish cohort (2003–2008). PBDE congeners (BDE-47, -99, -153, -154, and -209) were determined in serum of 670 mothers at gestational week 12 and in 534 umbilical cord samples. Abdominal circumference (AC), estimated fetal weight (EFW), femur length (FL), and biparietal diameter (BPD) during gestation were measured by ultrasounds. At birth, weight (BW), head circumference (HC), and length (BL) were also measured. We assessed growth in the intervals between 12–20 and 20–34 weeks of gestation and size at birth by standard deviation (SD)-scores adjusted for constitutional characteristics. We conducted multivariate linear regression analyses between PBDE congeners and their sum (ΣPBDEs) and outcomes. We found statistically significant inverse associations between ΣPBDEs and AC, EFW, and BPD at weeks 20–34 and HC at birth. Regarding congeners, the association was clearer with BDE-99, with inverse associations being found with AC, EFW, and BPD at weeks 20–34, and with BW and HC at delivery. These outcomes decreased between 1.3% and 3.5% for each 2-fold PBDE increase. Concerning matrices, we found statistically significant inverse associations with BPD, HC, and BW when using maternal serum, and for AC and EFW with cord serum. In conclusion, PBDEs may impair fetal growth in late pregnancy and reduce birth size.
Introduction
Polybrominated diphenyl ethers (PBDEs) are flame retardants which were commonly used in the manufacture of many types of household and commercial products.1 The commercial Penta- and OctaBDE were added to the list of persistent organic pollutants under the Stockholm Convention in 2009.2 The commercial production and use of DecaBDE has been restricted in Europe and phased out in the United States. However, its production and use are still going on in other parts of the world.3,4 Humans are exposed to these pollutants via several sources, including diet and indoor environments.5,6 PBDEs can cross the placenta and have been found in cord blood of different birth cohorts worldwide.7,8
Even though PBDEs have been widely used for several decades and humans are exposed to them on a daily basis, little is known about their possible effects on development. Epidemiological reports on fetal growth are scarce, have chosen anthropometrical size at birth as a proxy measure of in utero development, and have failed to yield conclusive results. Specifically, some of these PBDE studies have reported an inverse association with birth weight (BW),9−12 birth length (BL),10 or adverse birth outcomes (defined as low birth weight, prematurity, or still birth),13 whereas others found no association with BW,14,15 head circumference (HC),9,10 or BL.9,13 In addition, one study on birth size found associations in both directions depending on the PBDE congener studied.16
The possible biological mechanisms underlying the potential effects of PBDEs on fetal growth are not yet known, but could involve impairments in the endocrine system, since these pollutants may alter human levels of insulin-like growth factors and thyroid hormones during pregnancy,17−19 which play vital roles in fetal growth and development.
Fetal growth is a good determinant of perinatal and postnatal health. In fact, the “fetal programming” hypothesis proposed by Barker20 suggests that impaired fetal growth leads to small but permanent deficits in childhood development and is also a risk factor of some chronic diseases in adulthood, such as diabetes, hypertension, and heart disease.21 Consequently, the possible impact of PBDEs on fetal growth is a matter of public concern and more studies are warranted.
The aim of the present study was to investigate the relation between maternal and cord concentrations of PBDEs (BDE-47, -99, -153, -154, and -209, and their sum [ΣPBDEs]) and fetal growth (at 12–20 and 20–34 weeks of gestation) and birth size. This work was undertaken within the INMA (INfancia y Medio Ambiente – Environment and Childhood) Project in Spain.
Experimental Section
Study Design
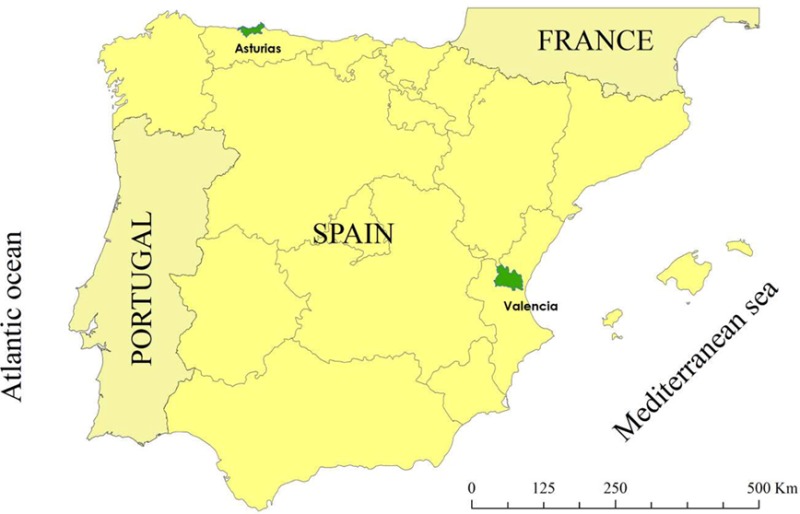
The INMA Project is a mother-and-child cohort study established in different areas of Spain following a common protocol.22 This study included the INMA cohorts of Asturias and Valencia, since serum samples were only available for PBDE determinations in these cohorts. The Ethics Committees of the San Agustin Hospital in Aviles and La Fe Hospital in Valencia approved the research protocol, and all mothers gave their written informed consent prior to inclusion.
We recruited a total of 1349 eligible women (≥16 years, singleton pregnancy, enrolment at 10–13 weeks of gestation, nonassisted conception, delivery scheduled at the reference hospital, and no communication impairment) in the first trimester of pregnancy. After excluding the women who withdrew from the study, were lost to follow-up, with induced or spontaneous abortions or fetal deaths, and with only one valid ultrasound, 1264 (94%) women were followed up to delivery (2003–2008). In the present study, the sample size was 686 mothers and their newborns with at least two valid ultrasounds and samples for PBDE determinations in maternal (n = 670) and/or umbilical cord (n = 534) serum. A flowchart of the study population is available in the Supporting Information (Figure S1).
Around 98% of the women from the Asturias cohort were included in the present study and population characteristics did not differ between included and excluded women (data not shown). A total of 28% of the women from the Valencia cohort were included and no differences in characteristics were found either, except in the case of a lower proportion of participants with a rural residence (3%) and not working during pregnancy (12%) compared to nonincluded women (7% and 19%, respectively) (Table S1). In Valencia, the lower proportion of available samples for PBDE determinations was due to logistic reasons.
PBDE Concentrations
We analyzed concentrations of 14 PBDEs using gas chromatography coupled to a mass spectrometer, as described previously.23 In this study, we present the results of those PBDEs with maternal or/and cord concentrations with a detection frequency of >50% (BDE-47, -99, -153, and -154). In addition, we include analyses with BDE-209 because detection frequency was close to 50% in maternal serum, it is the only congener still in use in Europe4 (so concentrations in environmental samples are very likely to increase), and available data on prenatal BDE-209 exposure and their health effects are scarce (mainly because of analytical difficulties).24 The detection limits (LODs) for BDE-47, -99, -153, -154, and -209 were 2.59, 2.38, 1.24, 2.78, and 9.12 pg/mL in Asturias, and 2.30, 2.10, 1.19, 0.43, and 5.94 pg/mL in Valencia. LODs were calculated as three times the standard deviation (SD) of the procedural blank levels.23 Samples were analyzed in two different batches, one per cohort, and therefore LODs were somewhat different for each cohort. The laboratory complies with the Arctic Monitoring and Assessment Program (AMAP) for persistent organic pollutants in human serum (Centre de Toxicologie, Institut National de Santé Publique du Québec).
We used enzymatic techniques to determine total cholesterol and triglycerides, and total serum lipid concentrations were calculated as described by Phillips et al.25 Means ± SDs of total lipid contents in maternal (n = 473) and cord (n = 486) serum were 5.8 ± 1.3 and 2.6 ± 0.5 mg/mL, respectively.
Fetal Outcomes
Specialized obstetricians performed ultrasound examinations in routinely scheduled antenatal care visits in gestational weeks 12, 20, and 34. We also had access to any other ultrasound scans performed during pregnancy at the same hospital. From two to eight valid ultrasound measurements were obtained per subject between the seventh and 41st weeks of gestation. Of a total of 1264 women from Asturias and Valencia INMA cohorts providing ultrasound data, 107 (9%) had two examinations, 901 (71%) had three, 214 (17%) had four, and 42 (3%) had five or more. Therefore, a total of 3991 ultrasound examinations were used to construct longitudinal growth curves for fetal parameters.
The fetal parameters were abdominal circumference (AC), biparietal diameter (BPD: the transverse diameter of the head), and femur length (FL). Additionally, we calculated estimated fetal weight (EFW) using the Hadlock algorithm.26 An early crown–rump length (CRL) measurement was also obtained and used for pregnancy dating. Gestational age was based on the self-reported date of the last menstrual period, but an estimation based on the CRL measurement was considered if the self-reported and estimated dates differed by ≥7 days.27 Women with a difference of ≥3 weeks were excluded from the study (n = 8). Data of fetal parameters outside the range of the mean ± 4 SDs for each gestational age were also eliminated to avoid the influence of extreme values (n ≤ 5 for all parameters). Detailed information on ultrasound measures and gestational age is included in Table S2.
We used linear mixed models28 separately in each cohort to obtain longitudinal growth curves for the four fetal parameters. Models were adjusted for those available covariates known to influence the growth potential of the fetus: parental anthropometric characteristics, sex of the fetus, parity, maternal age, and country of birth of the mother. These customized models provide individual rather than population-based fetal growth standards that are expected to reduce misclassification in the detection of “small for gestational age” by excluding constitutionally small fetuses and including those within normal population limits who should have reached a greater size.29
Fetal growth curves provided predictions for weeks 12, 20, and 34, and we used these predictions to calculate unconditional and conditional SD-scores. Unconditional SD-scores describe the size of a fetus at a given time point, while conditional SD-scores describe the fetal growth between two time points, i.e., they evaluate the size at the final time point according to the size at the starting time point by means of conditional probability.30,31 We calculated unconditional SD-scores at 12, 20, and 34 weeks of gestation, and conditional SD-scores for the intervals 12–20 and 20–34 weeks of gestation. A brief description of the parametrization of the models and calculation of SD-scores is included in the Supporting Information (section on fetal growth curves and calculation of SD-scores), and detailed information has been previously published.32
Newborn Outcomes
Newborns were weighed (g) at birth by the midwife in the delivery room, and the head circumference (cm) and length (cm) were measured within the first 12 h of life by a nurse in the hospital ward. We established gestational age following the same procedure defined for ultrasounds. Neonatal outcome variables were gestational age-specific SD-scores for BW, HC, and BL. We adjusted a linear mixed model following a procedure similar to that for ultrasounds.28 But in this case the data for each parameter were analyzed jointly, thereby allowing for random effects by cohort on intercept and covariate effects. We also calculated these SD-scores according to a customized model that takes into account parental anthropometric characteristics, sex of the newborn, parity, maternal age, country of birth of the mother, and gestational age at birth.29,33 As in the fetal procedure, these models allow us to discriminate between constitutionally small babies and babies with reduced growth. A brief description of the newborn size modeling is included in the Supporting Information (section on calculation of SD-scores for neonatal parameters), and more detailed information has been published previously.34
Covariates
At weeks 10–13 and 28–32 the pregnant women completed two detailed in-person questionnaires on anthropometric and socio-demographic characteristics and lifestyle variables, and two semiquantitative food frequency questionnaires (FFQs), as further described elsewhere.35
We considered a priori the following maternal variables for their possible inclusion in the models: cohort, age (years), height (cm), prepregnancy body mass index (BMI, kg/m2), country of origin (Spain and other), zone of residence (rural and nonrural), education (till primary, secondary, and university studies), employment during pregnancy (yes and no), social class defined according to the most privileged occupation during pregnancy of the mother or the father using a widely employed Spanish adaptation of the international ISCO88 coding system (class I: managerial jobs, senior technical staff, and commercial managers; class II: skilled nonmanual workers; and class III: manual workers), parity (none and ≥1 births), consumption of tobacco at week 12 of pregnancy (yes and no), passive smoking in at least two environments from among the home, workplace, and restaurants/leisure areas (yes and no), season of last menstrual period, previous lactation (none, <6 months, and ≥6 months), total energy intake (kcal/day), beverages containing alcohol (yes and no), and intake of eggs, oils and fats, fish and shellfish, and meat products (all expressed in servings/week). We also considered paternal height (cm) and BMI (kg/m2), as well as the sex of the fetus.
In addition, we had information on a number of variables related to PBDE exposure:1 carpets at home (yes and no), curtains at home (yes and no), type of mattress (foam, box spring, latex, and other types), frequency of housekeeping (<1, 1, and >1 times/week), vacuum cleaner use (yes and no), resident density at home, and television use (number of hours per week).
Finally, concentrations of polychlorinated biphenyls (PCB congeners: 153, 138, and 180) and hexachlorobenzene (HCB) were measured in maternal (week 12 of pregnancy) and cord serum samples by gas chromatography with electron capture detection.32
Statistical Analysis
For descriptive purposes, we present numbers (percentages) for categorical variables, means ± SDs for continuous variables, and percentiles (P25, P50, and P75) for PBDEs. Pollutant concentrations were expressed in pg/mL and in ng/g lipid (using individual total lipid values to calculate PBDE concentrations on a lipid content basis). We used cohort-adjusted Pearson’s partial correlations to describe pairwise relationships between levels of log2(lipids) and log2(PBDEs) and between log2(PBDEs) measured in both matrices. PBDE values <LOD were replaced by 1/2 LOD in descriptive and correlation analyses.
We conducted multivariate linear regression analyses to study the relation between log2(PBDE) concentrations (on a fresh-weight basis and log2-transformed to account for right-skewed distributions) and outcomes. First, we built a core model for each SD-score and each exposure window by using the significant covariates at the p < 0.2 level in crude analyses (only adjusted by cohort). Variables not related at p < 0.1 (F test) were excluded following a backward procedure. Each exposure variable was then incorporated and potential confounders (included in the section of covariates) were added and retained to the final models if the contaminant coefficient changed by >10% after inclusion of this variable. Any possible confounder was previously selected if variables were associated with log2(PBDE) concentrations at the p < 0.2 level in Tobit regression analyses. Finally, we assessed the homoscedasticity and normality of regression residuals, and we excluded extreme outliers (Studentized residuals ≥4) or highly influential observations (Cook’s distance >0.5) from the final models. These models are the complete case analyses (i.e., models restricted to subjects with complete data in covariates and replacing PBDE values <LOD with 1/2 LOD value).
We used multiple imputation with chained equations36 to deal with missing values in covariates and with values <LOD in PBDEs (assuming a log-normal distribution of the contaminants and conditioning the imputation to the range [0, LOD]). A total of 50 complete data sets were generated by using the mice package for R.37 To impute PBDE values <LOD, we defined an additional function for bootstrap multiple imputation of interval censored variables. Final models of the complete case analyses were replicated in the multiple imputed data sets, and estimates on each data set were combined using Rubin’s rules for multiple imputation.38 Details about this procedure are available in the Supporting Information and Table S3.
We present as main analysis the results of the multiple imputation. Parameter estimates were expressed as the percent change in the outcome with respect to the mean, and its 95% confidence interval (CI) associated with a 2-fold increase in PBDE concentrations. For a detailed list of covariates included in each model see the Supporting Information (Table S4).
We performed different sensitivity analyses to evaluate the robustness of the results. First, we compared the main analysis (i.e., multiple imputation) with the complete case analysis. We reran more analyses including the following in the main analysis: (i) maternal weekly gestational weight gain (GWG) measured from week 12 onward (categorized as low, adequate, and high in accordance with the Institute of Medicine39); (ii) lipid levels (as a separate term); (iii) the sum of the three PCBs (∑PCBs) plus lipids; and (iv) HCB plus lipids. The latter two sensitivity analyses were conducted since these pollutants were previously associated with fetal growth in the same cohort.32 Maternal PBDE analyses were adjusted for maternal levels of either ∑PCBs or HCB and maternal lipids, and cord PBDE analyses for these two contaminants and lipids measured in cord serum. Finally, we also investigated differences by sex including the interaction of this variable with the contaminants in the main analysis.
We used the statistical software R 3.1.1.40 Where associations are referred to as statistically or marginally significant associations, this implies a p-value <0.05 or <0.1, respectively.
Results
Study Population
Table 1 shows the socio-demographic characteristics of the study population. Most of the women (94%) were born in Spain and the mean age was 31 ± 4.6 years.
Table 1. Characteristics of the Study Population: The INMA Cohort, 2003–2008 (Spain)a.
| variable | Asturias (n = 467) |
Valencia (n = 219) |
overall (n = 686) |
|---|---|---|---|
| Maternal Characteristics | |||
| age (years) | 31.5 ± 4.4 | 29.7 ± 4.7 | 30.9 ± 4.6 |
| height (cm) | 162.3 ± 6.1 | 161.8 ± 6.7 | 162.2 ± 6.3 |
| BMI (kg/m2) | 23.9 ± 4.3 | 24.0 ± 4.6 | 23.9 ± 4.4 |
| adequate GWGb | 170(37) | 85(40) | 255(38) |
| born in Spain | 450(96) | 195(89) | 645(94) |
| till primary ed. | 85(48) | 78(36) | 163(24) |
| workingc | 339(73) | 193(88) | 532(78) |
| social class IIId | 216(46) | 109(50) | 325(47) |
| rural residence | 59(13) | 6(3) | 65(10) |
| primiparous | 287(62) | 121(55) | 408(60) |
| smokingc | 125(28) | 83(38) | 208(32) |
| passive smoking | 213(48) | 155(73) | 368(56) |
| alcohol intake | 29(6) | 36(16) | 65(10) |
| Paternal Characteristics | |||
| height (cm) | 175.4 ± 6.9 | 175.8 ± 7.1 | 175.5 ± 6.9 |
| BMI (kg/m2) | 26.6 ± 3.5 | 26.0 ± 3.4 | 26.4 ± 3.5 |
| Child Characteristics | |||
| sex (male) | 249(53) | 123(56) | 372(54) |
| Values are n (%) or mean ± SD. | |||
BMI: body mass index before pregnancy; ed.: education; GWG: gestational weight gain.
Adequate GWG during the 2nd and 3rd trimester according to the prepregnancy BMI: 0.44–0.58, 0.35–0.50, 0.23–0.33, and 0.17–0.27 kg/week for underweight, normal, overweight, and obese women, respectively.39
At week 12 of pregnancy.
Social Class III: manual workers.
PBDE Concentrations and Pearson’s Correlations
Table 2 shows the descriptive analyses of the contaminants. Congeners were above LOD in a range from 40 to 90%, except BDE-154 (25%) and -209 (28%) in cord serum. BDE-153 and -154 were the most commonly detected congeners (90% and 81%, respectively) in maternal serum. Congener frequency of detection in the cord serum samples tended to decrease at higher numbers of bromine substituents. Median concentrations (pg/mL) of all congeners were lower in umbilical cord than in maternal serum, except for BDE-47 (Table 2).
Table 2. PBDE Concentrations and Pearson’s Correlations between PBDEs (pg/mL) and Lipids (mg/mL): The INMA Cohort, 2003–2008 (Spain)a.
| >LOD | concentration
(pg/mL) |
concentration
(ng/g lipid) |
correlations
between PBDEs and lipids |
||||||
|---|---|---|---|---|---|---|---|---|---|
| PBDE | (%) | P25 | P50 | P75 | P25 | P50 | P75 | r | P |
| Maternal serum | n = 670 | n = 473 | n = 473 | ||||||
| BDE-47 | 40.3 | <LOD | <LOD | 10.71 | <LOD | <LOD | 2.01 | –0.03 | 0.49 |
| BDE-99 | 57.9 | <LOD | 6.55 | 16.74 | 0.22 | 1.14 | 3.19 | –0.03 | 0.47 |
| BDE-153 | 90.2 | 7.34 | 12.48 | 21.19 | 1.18 | 2.19 | 3.68 | 0.05 | 0.25 |
| BDE-154 | 81.0 | 3.96 | 9.96 | 22.07 | 0.65 | 1.91 | 4.09 | –0.01 | 0.89 |
| BDE-209 | 47.8 | <LOD | <LOD | 17.24 | <LOD | <LOD | 3.22 | 0.01 | 0.82 |
| ∑PBDEs | 33.70 | 57.05 | 98.93 | 6.28 | 10.74 | 19.13 | 0.01 | 0.87 | |
| Umbilical cord serum | n = 534 | n = 486 | n = 486 | ||||||
| BDE-47 | 59.0 | <LOD | 4.43 | 11.55 | <LOD | 1.73 | 4.73 | –0.02 | 0.65 |
| BDE-99 | 51.7 | <LOD | 2.82 | 8.85 | <LOD | 1.05 | 3.80 | –0.09 | 0.04 |
| BDE-153 | 50.4 | <LOD | 1.42 | 5.20 | <LOD | 0.56 | 2.10 | 0.05 | 0.30 |
| BDE-154 | 25.3 | <LOD | <LOD | 1.42 | <LOD | <LOD | 0.76 | 0.06 | 0.16 |
| BDE-209 | 27.5 | <LOD | <LOD | 6.81 | <LOD | <LOD | 2.79 | 0.01 | 0.81 |
| ∑PBDEs | 9.05 | 18.89 | 41.94 | 4.00 | 7.51 | 17.52 | 0.004 | 0.93 | |
LOD: detection limit; P: percentile; PBDE: polybrominated diphenyl ether; r: Pearson’s coefficient adjusted for cohort; ∑: sum.
Table 2 also shows a low (from −0.09 to 0.06) and nonsignificant (p > 0.05 except for cord BDE-99) Pearson’s correlation between log2(PBDE) and log2(lipid) levels. Therefore, the main analyses were not adjusted for lipid content, but, we did conduct sensitivity analyses including this variable (Figures 2 and S2–S6) to make results comparable with previous studies. Finally, Pearson’s correlations between maternal and cord log2(PBDEs) in pg/mL were low (0.18, 0.06, 0.04, 0.09, and 0.07 for BDE-47, -99, -153, -159, and -209, respectively) with a p-value >0.05 in all cases except for BDE-47 and -154 (data not shown).
Figure 2.

Sensitivity analysis of the association between prenatal concentrations of ∑PBDEs and fetal growth measurements or newborn size: The INMA Cohort, 2003–2008 (Spain). Percent change in fetal (shaded white) or newborn (shaded gray) measurements associated with a 2-fold increase in ∑PBDE concentrations. AC: abdominal circumference; BL: birth length; BW: birth weight; BPD: biparietal diameter; EFW: estimated fetal weight; HC: head circumference; HCB: hexachlorobenzene; FL: femur length; ∑PCBs: sum of PCB 138, 153, and 180; ∑PBDEs: sum of polybrominated diphenyl ethers. Main analysis: results from multiple imputation. Complete case: excluded cases with missing values in covariates and fixed imputation of values <LOD in PBDEs with 1/2 LOD. Gestational weight gain: main analysis adjusted for this variable. Lipids: main analysis adjusted for lipid levels. ∑PCBs + lipids or HCB + lipids: main analysis adjusted for either ∑PCBs and lipids or HCB and lipids.
Associations between PBDEs and Fetal Growth or Newborn Size
Figure 1 shows the association between log2(PBDE) concentrations and SD-scores of outcomes. Regarding possible windows of vulnerability, clear patterns were not found during the period between 12 and 20 weeks of pregnancy. Clearer inverse associations were found at 20–34 weeks of gestation and at birth. Concerning matrices, statistically significant associations with BPD, HC, and BW were found when using maternal serum, while with AC and EFW they were found with cord serum.
Figure 1.

Association between prenatal PBDE concentrations and fetal growth measurements or newborn size: The INMA Cohort, 2003–2008 (Spain). Percent change in fetal (shaded white) or newborn (shaded gray) measurements associated with a 2-fold increase in PBDE concentrations. +p-value <0.1; * p-value <0.05; ** p-value <0.01. AC: abdominal circumference; BL: birth length; BPD: biparietal diameter; BW: birth weight; EFW: estimated fetal weight; FL: femur length; HC: head circumference; PBDE: polybrominated diphenyl ether; ∑: sum.
During the period between 20 and 34 weeks of pregnancy, inverse associations were found between cord ΣPBDEs and both AC (−2.9%[−4.8, −0.9]) and EFW (−2.6%[−4.5, −0.6]), and between maternal ΣPBDEs and BPD (−3.5%[−6.1, −0.9]). Regarding individual congeners, the statistically significant inverse associations were clearer with BDE-99 concentrations following patterns similar to those of ΣPBDEs. Specifically, cord BDE-99 was associated with both AC (−1.9%[−3.5, −0.4]) and EFW (−1.8%[−3.4, −0.2]), and maternal BDE-99 were associated with BPD (−1.3%[−2.5, −0.02]) at 20–34 weeks of gestation. In addition, cord concentrations of BDE-47 (−1.8%[−3.9, 0.3]), BDE-153 (−1.4%[−3.0, 0.2]), and BDE-209 (−1.3%[−2.7, 0.1]) were marginally associated with AC at weeks 20–34, and cord BDE-153 (−1.4%[−3.1, 0.3]) and maternal BDE-47 (−0.9%[−1.9, 0.1]) were marginally associated with EFW at 20–34 weeks of gestation (Figure 1).
At birth, maternal ΣPBDEs and BDE-99 were statistically inversely associated with HC (−2.9%[−5.5, −0.3] and −2.1%[−3.4, −0.8], corresponding to a decrease of approximately 1.0 and 0.7 cm relative to the mean HC at birth), and maternal BDE-99 was inversely associated with BW (−1.4%[−2.7, −0.2], corresponding to a mean difference of approximately 46.8 g). Finally, a marginally significant association between maternal BDE-47 and HC (−1.0%[−2.2, 0.1]) also emerged (approximately 0.34 cm) (Figure 1).
Figures 2 and S2–S6 show the sensitivity analyses between PBDEs and outcomes. The estimates of the main analysis (i.e., analysis imputing missing information in covariates and imputing a value between 0 and LOD for undetected values of PBDEs) were quite similar to those of the complete case analysis (i.e., analysis restricted to the data set without missing information in covariates and imputing 1/2 LOD for PBDE values <LOD), or the main analysis including GWG or lipids or other pollutants plus lipids. The main differences were found in the complete case analysis with wider CIs. Finally, there were no consistent interactions with sex (data not shown), and only two interactions were statistically significant. Specifically, maternal BDE-154 and BPD growth at weeks 20–34 (females: −2.3%[−4.6, 0.0], males: 1.4%[−0.7, 3.4], p-interaction = 0.03) and cord BDE-47 and BL (females: 2.0%[−1.1, 5.0], males: −1.4%[−4.4, 1.6], p-interaction = 0.04).
Discussion
Our results suggest an inverse association between prenatal exposure to PBDEs and EFW, AC, and BPD in late pregnancy (i.e., 20–34 weeks of gestation) and these associations were visible at birth for HC and to a lesser extent for BW. Concerning matrices, we found more robust associations with head-related outcomes when using maternal serum, while the associations with the rest of the outcomes were clearer with cord serum. Finally, clear results suggesting a differential effect between sexes were not found.
In the present study, cord ∑PBDE concentrations were associated with decreases in EFW and AC at 20–34 weeks of pregnancy. Regarding congeners, the association was clearer with BDE-99, since we found an inverse significant association between cord concentrations of this congener and EFW and AC at 20–34 weeks of gestation, and between maternal BDE-99 and weight at birth. To our knowledge, there are no previous studies assessing fetal growth by using ultrasound data with which to compare our results, but the findings of preceding studies on newborn reproductive outcomes have a certain consistence with the results found here. Thus, a previous research showed that concentrations of BDE-47, -99, and -209 were higher in the maternal milk (collected within 2 weeks after pregnancy) of Taiwanese mothers whose newborns weighed ≤3050 g at birth compared to the rest (n = 20).10 In this study, chest circumference was also investigated and an inverse association with the three contaminants emerged as well.10 Concentrations of BDE-47 and -99 at 26 weeks of pregnancy in South California (n = 286),9 and cord BDE-99 in Canada (n = 97)12 were also associated with decreases in BW. In the first of these two studies, associations with these contaminants were slightly reduced and were no longer statistically significant after adjusting for GWG, as was the case in the present study. Finally, a Swedish study (n = 413) also found an inverse association between the sum of BDE-47, -99, -100, and -153 in milk collected 3 weeks after delivery and BW once the analyses were adjusted for gestational length. However, analyses with individual congeners were not presented in this study.11 In contrast, two studies performed in Indianapolis, IN (n = 12),14 and Western Australia (n = 164)15 did not find a statistically significant association between this outcome and maternal PBDE concentrations, and a study conducted in Texas and Michigan (USA) found a positive and significant association between preconceptional maternal BDE-99 concentrations and BW among boys but not in girls.16
Maternal ∑PBDE concentrations, especially BDE-99, were inversely associated with decreases in BPD at 20–34 weeks of gestation and HC at birth. Therefore, although the head outcomes measured are not exactly the same, and comparisons ought to be made with caution, the associations found during pregnancy seem to continue to prevail at birth. Regarding previous reports, a positive association of BDE-99 in relation to HC among boys was reported.16 Two other studies evaluated this potential link at delivery, and although the direction of the associations was negative, none was statistically significant.9,10
Higher PBDE concentrations were not statistically associated with drops in FL or BL in the present study. One10 out of the four9,10,13,16 previous studies measuring the impact of these compounds on BL found higher milk BDE-99 and -209 concentrations in newborns with a BL ≤50 cm, although the sample size was small (n = 20). Another study found a positive association between BDE-99 and BL among boys.16
Regarding concentrations, we found associations at lower or similar levels compared with previous studies. Thus, maternal BDE-99 serum concentrations were lower in the present study (median: 1.1 ng/g lipid) than in Canada and USA (median range: 3.8–17.9 ng/g lipid)9,12,14 and slightly higher than those in Australia (median: 0.9 ng/g lipid).15
We hypothesized that the associations between maternal PBDEs and head-related outcomes in late pregnancy and at birth may be indicating an impairment of placental function. The development of the placenta is especially susceptible to pathology and, if disrupted, current and later placental function can be impaired. One study41 in fact reported changes in umbilical blood flow during the third trimester due to infections that had taken place before week 20 of gestation. This suggests that the response to early exposure might be observed quite some time later, which is in line with the pattern of our results. We found significant associations between cord PBDEs and fetal weight (i.e., EFW) or adiposity (i.e., AC) during the third trimester. This could be due to the fact that late pregnancy is the period where the greater part of the increase in fetal body mass occurs. However, clear associations between PBDEs and BW were not found except for maternal BDE-99. Nevertheless, these hypotheses should be taken with caution since this is the first study on PBDEs and fetal growth during pregnancy, and therefore more studies are warranted to compare with our results.
Regarding the possible long-term consequences, preceding studies in other birth cohorts concluded that slower growth in weight and head from mid to late pregnancy was a predictor of a higher risk of delayed infant development regardless of postnatal growth.42 In addition, infants with reduced growth and adiposity in early childhood may have a greater tendency to experience a later catch-up growth, and this is known to be strongly related to metabolic disorders such as obesity and insulin resistance.43 Also, infants with poor prenatal head growth were at a higher risk of impairment of brain development.44 Fetal growth retardation may also be associated with adverse health effects later in life, such as childhood obesity and cardiovascular diseases.21 Therefore, a possible inverse association between PBDE exposure and fetal growth might be of public concern.
There are some shortcomings in the present study to be considered. One is the possibility of selection bias due to the inclusion criteria, but at the same time this criterion is aimed at obtaining a more homogeneous population and reducing the potential for confounding. Additionally, we did not observe significant differences in the main study variables between the excluded women belonging to the cohort and the subsample included in the present study, with only a slightly larger proportion of mothers excluded from the Valencia cohort with a rural residence and without a job during pregnancy. Moreover, cord serum levels of PBDEs are a measure of the exposure posterior to the timing of the fetal growth measurement. However, we considered it interesting to study associations with this matrix since cord concentrations might be a good proxy of the prenatal PBDE exposure, since levels in cord are the ones that have passed through the placenta and reached the fetus and correlations between maternal and cord serum in this population were found to be low (range: 0.04–0.18) and not significant except for the case of BDE-47 and -154. Finally, due to the high number of statistical tests conducted, there is the possibility of potential random associations. The estimates of the coefficients and their confidence intervals should be taken as a global picture of the pattern of the relations between the variables involved in the study.45
To the best of our knowledge, this is the first report on the relation between serum PBDE concentrations and fetal growth during pregnancy, and the largest study on newborn size conducted to date. The availability of information on fetal growth during pregnancy and at delivery is an advantage, since reproductive outcomes at birth may be indirect delayed measures of growth that are unable to identify critical periods within gestation. Other important advantages are the use of repeated measurements of fetal growth and the use of models adjusted for maternal and fetal constitutional factors in order to compare the expected versus real growth of each fetus. Other strengths are the prospective design, low rate of drop-outs from recruitment to delivery, individual information on potential confounders, the use of multiple imputation to deal with undetected values in the exposure variables and missing values in the covariates,36 the adjustment for other contaminants, and the study of the association by using PBDE concentrations in two different matrices collected at two different moments, since each matrix could be representing a different window of exposure during pregnancy.
In conclusion, our results showed a decrease in EFW, AC, and BPD in late pregnancy associated with PBDEs and these associations were also visible at birth for HC and to a lesser extent for BW. The estimated mean difference in these outcomes ranged from −3.5% to −1.3% for each 2-fold increase in PBDE concentrations. There are no previous studies with which to compare our results and, therefore, studies on this topic are warranted. Regarding birth size, our results match the findings of some previous studies as regards a possible inverse association between some PBDEs and BW. Limited data have been published on HC and BL that can be contrasted with our results. More studies on this topic are therefore warranted.
Acknowledgments
The authors are grateful to mothers who participated in the study and to San Agustin Hospital in Aviles and La Fe Hospital in Valencia. This work was supported by grants from the European Union (FP7-ENV-2011 cod 282957 and HEALTH.2010.2.4.5-1), and grants from the Instituto de Salud Carlos III in Spain (Red INMA G03/176, CB06/02/0041, and FIS-FEDER PI03/1615, PI04/1509, PI04/1112, PI04/1931, PI04/2018, PI05/1079, PI05/1052, PI06/1213, PI07/0314, PI09/02647, PI09/02311, PI11/01007, PI11/02591, PI11/02038, MS11/0178, PI13/1944, PI13/02429, PI14/00891, and PI14/01687), Conselleria de Sanitat of the Generalitat Valenciana, Obra Social Cajastur and University of Oviedo.
Supporting Information Available
The Supporting Information is available free of charge on the ACS Publications website at DOI: 10.1021/acs.est.5b01793.
Supplementary text, figures, and tables about scheme of the study population, differences between included and excluded women from the Valencia cohort, fetal growth curves, calculation of SD-scores during pregnancy and at birth, details on ultrasound measures and neonatal parameters, details on the multiple imputation modeling, covariates of adjustment in multivariate regression models, and sensitivity analyses between PBDEs congeners and fetal growth measurements or newborn size (PDF)
Author Contributions
⊥ Authors M.J. L.-E. and O.C. contributed equally.
The authors declare no competing financial interest.
Supplementary Material
References
- Alaee M.; Arias P.; Sjodin A.; Bergman A. An overview of commercially used brominated flame retardants, their applications, their use patterns in different countries/regions and possible modes of release. Environ. Int. 2003, 296683–689 10.1016/S0160-4120(03)00121-1. [DOI] [PubMed] [Google Scholar]
- SCOPS. Stockholm Convention on Persistent Organic Pollutants (POPs); 2010. http://chm.pops.int/Programmes/NewPOPs/The9newPOPs/tabid/672/language/en-US/Default.aspx (Accessed 30 May 2015).
- U.S. EPA. DecaBDE phase-out initiative; 2012. http://www.epa.gov/oppt/existingchemicals/pubs/actionplans/deccadbe.html (Accessed 30 May 2015).
- EBFRIP. European Brominated Flame Retardant Industry Panel. The RoHS Directive and Deca-BDE; 2009. http://www.ebfrip.org/main-nav/european-regulatory-centre/rohs-directive-restriction-of-the-use-of-certain-hazardous-substances-in-electricaland-electronic-equipment/the-rohs-directive-and-deca-bde/ (Accessed 30 May 2015).
- Domingo J. L.; Marti-Cid R.; Castell V.; Llobet J. M. Human exposure to PBDEs through the diet in Catalonia, Spain: temporal trend. A review of recent literature on dietary PBDE intake. Toxicology 2008, 248125–32 10.1016/j.tox.2008.03.006. [DOI] [PubMed] [Google Scholar]
- Wilford B. H.; Shoeib M.; Harner T.; Zhu J.; Jones K. C. Polybrominated diphenyl ethers in indoor dust in Ottawa, Canada: implications for sources and exposure. Environ. Sci. Technol. 2005, 39187027–7035 10.1021/es050759g. [DOI] [PubMed] [Google Scholar]
- Vizcaino E.; Grimalt J. O.; Carrizo D.; Lopez-Espinosa M. J.; Llop S.; Rebagliato M.; Ballester F.; Torrent M.; Sunyer J. Assessment of prenatal exposure to persistent organohalogen compounds from cord blood serum analysis in two Mediterranean populations (Valencia and Menorca). J. Environ. Monit. 2011, 132422–432 10.1039/C0EM00483A. [DOI] [PubMed] [Google Scholar]
- Vizcaino E.; Grimalt J. O.; Fernandez-Somoano A.; Tardon A. Transport of persistent organic pollutants across the human placenta. Environ. Int. 2014, 65, 107–115 10.1016/j.envint.2014.01.004. [DOI] [PubMed] [Google Scholar]
- Harley K. G.; Chevrier J.; Schall R. A.; Sjodin A.; Bradman A.; Eskenazi B. Association of prenatal exposure to polybrominated diphenyl ethers and infant birth weight. Am. J. Epidemiol. 2011, 1748885–892 10.1093/aje/kwr212. [DOI] [PMC free article] [PubMed] [Google Scholar]
- Chao H. R.; Wang S. L.; Lee W. J.; Wang Y. F.; Papke O. Levels of polybrominated diphenyl ethers (PBDEs) in breast milk from central Taiwan and their relation to infant birth outcome and maternal menstruation effects. Environ. Int. 2007, 332239–245 10.1016/j.envint.2006.09.013. [DOI] [PubMed] [Google Scholar]
- Lignell S.; Aune M.; Darnerud P. O.; Hanberg A.; Larsson S. C.; Glynn A. Prenatal exposure to polychlorinated biphenyls (PCBs) and polybrominated diphenyl ethers (PBDEs) may influence birth weight among infants in a Swedish cohort with background exposure: a cross-sectional study. Environ. Health 2013, 12, 44. 10.1186/1476-069X-12-44. [DOI] [PMC free article] [PubMed] [Google Scholar]
- Foster W. G.; Gregorovich S.; Morrison K. M.; Atkinson S. A.; Kubwabo C.; Stewart B.; Teo K. Human maternal and umbilical cord blood concentrations of polybrominated diphenyl ethers. Chemosphere 2011, 84101301–1309 10.1016/j.chemosphere.2011.05.028. [DOI] [PubMed] [Google Scholar]
- Wu K.; Xu X.; Liu J.; Guo Y.; Li Y.; Huo X. Polybrominated diphenyl ethers in umbilical cord blood and relevant factors in neonates from Guiyu, China. Environ. Sci. Technol. 2010, 442813–819 10.1021/es9024518. [DOI] [PubMed] [Google Scholar]
- Mazdai A.; Dodder N. G.; Abernathy M. P.; Hites R. A.; Bigsby R. M. Polybrominated diphenyl ethers in maternal and fetal blood samples. Environ. Health Perspect. 2003, 11191249–1252 10.1289/ehp.6146. [DOI] [PMC free article] [PubMed] [Google Scholar]
- Stasinska A.; Heyworth J.; Reid A.; Callan A.; Odland J. O.; Trong Duong P.; Van Ho Q.; Hinwood A. Polybrominated diphenyl ether (PBDE) concentrations in plasma of pregnant women from Western Australia. Sci. Total Environ. 2014, 493, 554–561 10.1016/j.scitotenv.2014.06.001. [DOI] [PubMed] [Google Scholar]
- Robledo C. A.; Yeung E.; Mendola P.; Sundaram R.; Maisog J.; Sweeney A. M.; Barr D. B.; Louis G. M. Preconception maternal and paternal exposure to persistent organic pollutants and birth size: the LIFE study. Environ. Health Perspect. 2015, 123188–94 10.1289/ehp.1308016. [DOI] [PMC free article] [PubMed] [Google Scholar]
- Xu X.; Yekeen T. A.; Xiao Q.; Wang Y.; Lu F.; Huo X. Placental IGF-1 and IGFBP-3 expression correlate with umbilical cord blood PAH and PBDE levels from prenatal exposure to electronic waste. Environ. Pollut. 2013, 182, 63–69 10.1016/j.envpol.2013.07.005. [DOI] [PubMed] [Google Scholar]
- Shy C. G.; Huang H. L.; Chao H. R.; Chang-Chien G. P. Cord blood levels of thyroid hormones and IGF-1 weakly correlate with breast milk levels of PBDEs in Taiwan. Int. J. Hyg. Environ. Health 2012, 2153345–351 10.1016/j.ijheh.2011.10.004. [DOI] [PubMed] [Google Scholar]
- Chevrier J.; Harley K. G.; Bradman A.; Gharbi M.; Sjodin A.; Eskenazi B. Polybrominated diphenyl ether (PBDE) flame retardants and thyroid hormone during pregnancy. Environ. Health Perspect. 2010, 118101444–1449 10.1289/ehp.1001905. [DOI] [PMC free article] [PubMed] [Google Scholar]
- Barker D. J. P.Mothers, Babies and Health in Later Life; Churchill Livingstone: Edinburgh, UK, 1998. [Google Scholar]
- Osmond C.; Barker D. J. Fetal, infant, and childhood growth are predictors of coronary heart disease, diabetes, and hypertension in adult men and women. Environ. Health Perspect. 2000, 108Suppl 3545–553 10.1289/ehp.00108s3545. [DOI] [PMC free article] [PubMed] [Google Scholar]
- Guxens M.; Ballester F.; Espada M.; Fernandez M. F.; Grimalt J. O.; Ibarluzea J.; Olea N.; Rebagliato M.; Tardon A.; Torrent M.; Vioque J.; Vrijheid M.; Sunyer J. Cohort Profile: the INMA--INfancia y Medio Ambiente--(Environment and Childhood) Project. Int. J. Epidemiol. 2012, 414930–940 10.1093/ije/dyr054. [DOI] [PubMed] [Google Scholar]
- Vizcaino E.; Arellano L.; Fernandez P.; Grimalt J. O. Analysis of whole congener mixtures of polybromodiphenyl ethers by gas chromatography-mass spectrometry in both environmental and biological samples at femtogram levels. J. Chromatogr. A 2009, 1216255045–5051 10.1016/j.chroma.2009.04.049. [DOI] [PubMed] [Google Scholar]
- Vizcaino E.; Grimalt J. O.; Lopez-Espinosa M. J.; Llop S.; Rebagliato M.; Ballester F. Polybromodiphenyl ethers in mothers and their newborns from a non-occupationally exposed population (Valencia, Spain). Environ. Int. 2011, 371152–157 10.1016/j.envint.2010.08.011. [DOI] [PubMed] [Google Scholar]
- Phillips D. L.; Pirkle J. L.; Burse V. W.; Bernert J. T. Jr.; Henderson L. O.; Needham L. L. Chlorinated hydrocarbon levels in human serum: effects of fasting and feeding. Arch. Environ. Contam. Toxicol. 1989, 184495–500 10.1007/BF01055015. [DOI] [PubMed] [Google Scholar]
- Hadlock F. P.; Harrist R. B.; Sharman R. S.; Deter R. L.; Park S. K. Estimation of fetal weight with the use of head, body, and femur measurements--a prospective study. Am. J. Obstet. Gynecol. 1985, 1513333–337 10.1016/0002-9378(85)90298-4. [DOI] [PubMed] [Google Scholar]
- Westerway S. C.; Davison A.; Cowell S. Ultrasonic fetal measurements: new Australian standards for the new millennium. Aust. N. Z. J. Obstet. Gynaecol. 2000, 403297–302 10.1111/j.1479-828X.2000.tb03338.x. [DOI] [PubMed] [Google Scholar]
- Pinheiro J. C., Bates D. M.. Mixed-Effects Models in S and S PLUS. Statistics and Computing; Springer-Verlag Inc: New York, 2000. [Google Scholar]
- Mamelle N.; Cochet V.; Claris O. Definition of fetal growth restriction according to constitutional growth potential. Biol. Neonate 2001, 804277–285 10.1159/000047157. [DOI] [PubMed] [Google Scholar]
- Royston P. Calculation of unconditional and conditional reference intervals for foetal size and growth from longitudinal measurements. Stat. Med. 1995, 14131417–1436 10.1002/sim.4780141303. [DOI] [PubMed] [Google Scholar]
- Gurrin L. C.; Blake K. V.; Evans S. F.; Newnham J. P. Statistical measures of foetal growth using linear mixed models applied to the foetal origins hypothesis. Stat. Med. 2001, 20223391–3409 10.1002/sim.891. [DOI] [PubMed] [Google Scholar]
- Lopez-Espinosa M. J.; Murcia M.; Iniguez C.; Vizcaino E.; Costa O.; Fernandez-Somoano A.; Basterrechea M.; Lertxundi A.; Guxens M.; Gascon M.; Goni-Irigoyen F.; Grimalt J. O.; Tardon A.; Ballester F. Organochlorine Compounds and Ultrasound Measurements of Fetal Growth in the INMA Cohort (Spain). Environ. Health Perspect. 2015, 10.1289/ehp.1408907. [DOI] [PMC free article] [PubMed] [Google Scholar]
- Iniguez C.; Ballester F.; Estarlich M.; Esplugues A.; Murcia M.; Llop S.; Plana A.; Amoros R.; Rebagliato M. Prenatal exposure to traffic-related air pollution and fetal growth in a cohort of pregnant women. Occup. Environ. Med. 2012, 6910736–744 10.1136/oemed-2011-100550. [DOI] [PubMed] [Google Scholar]
- Iniguez C.; Esplugues A.; Sunyer J.; Basterrechea M.; Fernandez-Somoano A.; Costa O.; Estarlich M.; Aguilera I.; Lertxundi A.; Tardon A.; Guxens M.; Murcia M.; Lopez-Espinosa M. J.; Ballester F. Prenatal Exposure to NO and Ultrasound Measures of Fetal Growth in the Spanish INMA Cohort. Environ. Health Perspect. 2015, 10.1289/ehp.1409423. [DOI] [PMC free article] [PubMed] [Google Scholar]
- Llop S.; Ballester F.; Vizcaino E.; Murcia M.; Lopez-Espinosa M. J.; Rebagliato M.; Vioque J.; Marco A.; Grimalt J. O. Concentrations and determinants of organochlorine levels among pregnant women in Eastern Spain. Sci. Total Environ. 2010, 408235758–5767 10.1016/j.scitotenv.2010.07.085. [DOI] [PubMed] [Google Scholar]
- Sterne J. A.; White I. R.; Carlin J. B.; Spratt M.; Royston P.; Kenward M. G.; Wood A. M.; Carpenter J. R. Multiple imputation for missing data in epidemiological and clinical research: potential and pitfalls. BMJ. 2009, 338, b2393. 10.1136/bmj.b2393. [DOI] [PMC free article] [PubMed] [Google Scholar]
- Van Buuren S.; Groothuis-Oudshoorn K. Mice: Multivariate Imputation by Chained Equations in R. J. Stat. Software 2011, 4531–67. [Google Scholar]
- Little R. J. A., Rubin D. B.. Statistical Analysis With Missing Data; John Wiley & Sons: Hoboken, NJ, 2002. [Google Scholar]
- Rasmussen K. M.; Yaktine A. L.. Weight Gain During Pregnancy: Reexamining the Guidelines; Institute of Medicine, National Research Council, and Committee to Reexamine IOM Pregnancy Weight Guidelines; National Academies Press: Washington, DC, 2009. [PubMed] [Google Scholar]
- R Core Team. R: A language and environment for statistical computing. R Foundation for Statistical Computing: Vienna, Austria, 2014. http://www.R-project.org/ (Accessed 1 December 2014).
- Griffin J. B.; Lokomba V.; Landis S. H.; Thorp J. M. Jr.; Herring A. H.; Tshefu A. K.; Rogerson S. J.; Meshnick S. R. Plasmodium falciparum parasitaemia in the first half of pregnancy, uterine and umbilical artery blood flow, and foetal growth: a longitudinal Doppler ultrasound study. Malar. J. 2012, 11, 319. 10.1186/1475-2875-11-319. [DOI] [PMC free article] [PubMed] [Google Scholar]
- Henrichs J.; Schenk J. J.; Barendregt C. S.; Schmidt H. G.; Steegers E. A.; Hofman A.; Jaddoe V. W.; Moll H. A.; Verhulst F. C.; Tiemeier H. Fetal growth from mid- to late pregnancy is associated with infant development: the Generation R Study. Dev. Med. Child Neurol. 2010, 527644–651 10.1111/j.1469-8749.2009.03513.x. [DOI] [PubMed] [Google Scholar]
- Crume T. L.; Scherzinger A.; Stamm E.; McDuffie R.; Bischoff K. J.; Hamman R. F.; Dabelea D. The long-term impact of intrauterine growth restriction in a diverse U.S. cohort of children: the EPOCH study. Obesity 2014, 222608–615 10.1002/oby.20565. [DOI] [PMC free article] [PubMed] [Google Scholar]
- Yanney M.; Marlow N. Paediatric consequences of fetal growth restriction. Semin. Fetal Neonatal Med. 2004, 95411–418 10.1016/j.siny.2004.03.005. [DOI] [PubMed] [Google Scholar]
- Rothman K. J. No adjustments are needed for multiple comparisons. Epidemiology 1990, 1143–46 10.1097/00001648-199001000-00010. [DOI] [PubMed] [Google Scholar]
Associated Data
This section collects any data citations, data availability statements, or supplementary materials included in this article.