Abstract
Chondrosarcoma is the most common primary malignant bone tumor in adults, has no effective systemic treatment, and patients with this disease have poor survival. Altered expression of microRNA (miR) is involved in tumorigenesis, however its role in chondrosarcoma is undetermined. MicroRNA-181a is overexpressed in high grade chondrosarcoma, is upregulated by hypoxia, and increases VEGF expression. Here, the purpose was to determine the mechanism of miR-181a regulation of VEGF, determine if miR-181a overexpression promotes tumor progression, and to evaluate an antagomir-based approach for chondrosarcoma treatment. Therapeutic inhibition of miR-181a decreased expression of VEGF and MMP1 in vitro, and angiogenesis, MMP1 activity, tumor growth, and lung metastasis, all by more than 50%, in a xenograft mouse model. A target of miR-181a is regulator of G-protein signaling 16 (RGS16), a negative regulator of CXC chemokine receptor 4 (CXCR4) signaling. CXCR4 signaling is increased in chondrosarcoma, its expression is also increased by hypoxia, and is associated with angiogenesis and metastasis, however, receptor blockade is only partially effective. RGS16 expression is restored after miR-181a inhibition and partially accounts for the anti-angiogenic and anti-metastatic effects of miR-181a inhibition. These data establish miR-181a as an oncomiR that promotes chondrosarcoma progression through a new mechanism involving enhancement of CXCR4 signaling by inhibition of RGS16.
Keywords: Angiogenesis, Metastasis, Noncoding RNAs, G-protein coupled receptors, Bone cancer
Introduction
Chondrosarcoma is the only primary bone cancer without an effective systemic treatment. Conventional cytotoxic chemotherapy is not effective, and targeted therapeutics have yet to be developed. Chondrosarcoma is highly metastatic and patients typically succumb to pulmonary metastases. The ability to induce sustained angiogenesis is a necessary condition for the two most important traits of cancer: unrestrained growth and development of metastases(1). Angiogenesis is usually a tightly regulated process which becomes dysregulated during neoplasia(2). Angiogenesis and invasion are intimately connected processes and are amplified by hypoxia. In chondrosarcoma, angiogenesis, invasion, and metastasis are a result of CXCR4 signaling, VEGF and MMP1 expression, HIF-1, and potentially microRNA. We have demonstrated that grade II and III chondrosarcomas have more microvascularity and VEGF expression than benign or grade I tumors(3;4). Vascularity correlates with clinical behavior, since it is primarily grade II and III chondrosarcomas that metastasize(5). Accordingly, inhibition of tumor angiogenesis could decrease tumor growth and metastasis(6), and therefore we are interested in pathways regulating these processes.
Hypoxia, which develops as tumors outgrow their blood supply, is an important factor that drives angiogenesis and aggressive behavior in cancer(7). Hypoxia inducing factor one (HIF-1) is the primary transcription factor that mediates changes in gene expression during hypoxia(8). We and others have shown that HIF-1 expression is higher in grades II and III chondrosarcoma than in low grade cartilage tumors(3;9;10). We have also shown that in chondrosarcoma cells HIF-1 both directly increases VEGF expression, and indirectly increases VEGF expression by upregulating CXCR4 expression and signaling(11;12). CXCR4 signaling also increases MMP1 expression, which notably(13;14).
A posttranscriptional mechanism regulating angiogenesis and metastasis in chondrosarcoma could involve microRNA. MicroRNAs are short, endogenous, non-coding RNAs that negatively regulate gene expression by promoting mRNA degradation or by translational repression through complementarity with sequences in the 3’ UTR. In cancer, microRNAs can function analogous to tumor suppressors or as oncogenes (oncomiRs) when over- or underexpressed, the net effect dependent on the target genes. MicroRNAs may be master regulators of the malignant phenotype(15). They have been implicated in angiogenesis(16) and specific microRNAs are upregulated by hypoxia (17). We have identified miR-181a as a potential oncomiR that is upregulated by hypoxia in chondrosarcoma that also regulates VEGF expression(18) and hypothesize that its overexpression contributes to angiogenesis and metastasis by amplifying CXCR4 signaling.
Materials and methods
Primary Human Chondrosarcoma Tissue
Human chondrosarcoma (HCS) from twenty-three patients and twelve normal articular cartilage specimens were obtained at surgery and either preserved in RNAlater Solution (Applied Biosystems, Foster City, CA) or snap frozen in liquid nitrogen for later use. The 23 chondrosarcoma included 7 grade I and 16 grade II and grade III tumors. We previously reported overexpression in one of the grade II and one of the grade III tumors(18)
Cell lines and cell culture
Human chondrocytes isolated from normal adult articular cartilage, and chondrosarcoma cell line JJ (a gift from Dr. Joel Block, Rush Medical School, Chicago, IL) were cultured in complete medium (40% DMEM, 40% MEM, 20% F12) and CS-1 (a gift from Dr. Francis Hornicek, Harvard Medical School, Boston, MA) was cultured in Gibco RPMI 1640 Medium (Life Technologies, Grand Island, NY), all with 10% FBS in a humidified incubator (NuAire Inc, Plymouth, MN) under 5% CO2 and either normoxia (ambient oxygen) or hypoxia (2% O2)(11). JJ was derived from a human grade II chondrosarcoma (19), CS-1 was derived from human grade III chondrosarcoma and metastasizes in a xenograft mouse model(20). In studies involving CXCR4 signaling, SDF1 (R&D Systems, Minneapolis, MN) 10-20ng/ml was added to the media. The JJ cell line was authenticated using short tandem repeat (STR) profiling (ATCC, Manassas, VA) and was performed on the source cell line in 1999, 2007, and repeated in 2012. There is 94% similarity between the different time points, the cells are human, and there are no matches with any cell lines in the ATCC data base. The CS-1 cell line was also authenticated using short tandem repeat (STR) profiling (ATCC, Manassas, VA) and was performed in September 2012 and matched the STS profiling performed by the source laboratory in 2011, and there were no matches in the ATCC data base.
RNA Isolation
Total RNA including microRNA was extracted from HCS tissue, cartilage, chondrocytes, JJ and CS-1 cells using miRNeasy Mini Kit (Qiagen, Valencia, CA). The concentration and quality of total RNA were determined with a NanoDrop 2000C spectrophotometer (Thermo Fisher Scientific, Waltham, MA). Samples with purity of 1.8-2 and integrity over 1.6 were used for analysis of miRNA expression.
cDNA synthesis and qPCR
Total RNA was reverse transcribed using the miScript Reverse Transcription kit (Qiagen, Valencia, CA). Quantification of the ubiquitously expressed miRNA, U17a, was used as an internal control which expresses consistently in normoxia and hypoxia. A reaction mixture (20µl) containing the SYBR Green Master Mix (Qiagen), 2ng of cDNA template plus miScript Universal primer and miScript Primer Assay (miR specific primer for miR-181a) in a 96-well plate was used for real-time PCR using miScript SYBR Green PCR kit (Qiagen). The reactions were done in triplicate on the DNA engine Opticon 2 PCR amplification system (Bio-Rad, Hercules, CA). PCR conditions: an initial step at 95 °C for 10 min, followed by 40 cycles of amplification at 94 °C for 10 s, 55 °C for 30s, then 70°C for 30s. To determine the expression level of RGS16, total RNA was analyzed using the Reverse Transcription System (Bio-Rad) followed by real-time PCR with SYBR Green Master Mix (Qiagen). 18S and B2M were used as internal controls(21;22). The primers for RGS16 and 18s have been previously published (23;24). The primers for B2M were 5’-GTGGAGCATTCAGACTTGTCTT-3’ and 5’-GCGGCATCTTCAAACCTCC-3’, respectively. The data analysis was performed as previously described(23;25).
Transfection and transduction
Transient miR-181a knockdown or overexpression was achieved with syn-hsa-miR-181a miScript miRNA mimic, control miR, anti-hsa-miR-181a miScript miRNA inhibitor, and miScript inhibitor negative control (Applied Biosystems). Transfections were performed with GenMute transfection reagent (SignaGen Laboratories, Gaithersburg, MD). pmiRZIP lentivector expressing anti-miR-181a or control sequence (SBI, Mountain View, CA) was used for permanent miR-181a knockdown experiments. Transduction-ready FIV-based pseudoviral particles were generated using pPACK-H1 Lentivector Packaging System together with 293TN cell line (SBI), at a titer of 1.06 × 10⁹ IFU/ml. Control was Lenti-scramble Hairpin control pseudoviral particles at a titer of 1 × 10⁹ IFU/ml. Cells were cultured in 12-well plates at a density of 1× 10⁵/well for 1 day, infected by pseudoviral particles (using a multiplicity of infection of 100 viruses per cell) and cultured for 72 hrs, then selected for puromycin (5µg/ml) resistance for stable cell lines. Stably transduced cells were used for vitro and in vivo experiments. Cells were transfected with human regulator of G-protein signaling 16 cDNA (RGS16, NM_002928) cloned into a pCMV vector (pReceiver-M02) and negative control Vector (EX-NEG-M02) (GeneCopoeia, Rockville, MD) and selected for neomycin resistance.
Western Blot
Cell membrane proteins were isolated using hypertonic buffer (Active Motif, Carlsbad, CA), centrifugation at 40,000 rpm for 40 min and proteins from whole cell lysates were suspended in 2× loading buffer. Equal amounts of proteins in cell lysates were separated with SDS-PAGE and probed with antibodies for anti-RGS16,(Abcam, Cambridge, MA), or VEGF (VEGFA), MMP-1, and actin (Santa Cruz Biotechnology, Santa Cruz, CA). The fluorescent signals were detected using a fluorescently-labeled secondary goat anti-rabbit antibody (Alexa Fluor 680) (Molecular Probes, Eugene, OR) and analyzed on Licor Odyssey Scanner (LI-COR Biosciences, Lincoln, NE).
ELISA Assay
Lysates from homogenized xenograft tumors and conditioned media (CM) from cultured cells were used. Cells were cultured for one day, then the medium was changed to 1% FBS O/N, and the conditioned media (CM) were collected for ELISA to measure VEGF and pro-MMP1 concentration (R&D system, Minneapolis, MN)(12;13). Each sample was measured in duplicate and each experiment was repeated at least 3 times. VEGF and MMP1 were normalized to the lysate protein concentration as determined by Quick Start Brandford protein assay (Bio-Rad, Hercules, CA).
Luciferase Assay
A luciferase reporter construct (0.5 µg) with RGS16 3’ UTR wild type or mutant (GeneCopoeia, Gene Accession: NM_002928.3, UTR length: 1668 bp) was cotransfected with 20 nM miR-181a into JJ cells using GeneMut transfection reagent (SignaGen Laboratories, Rockville, MD), and cultured for 48 hr. The sequence for the miR-181a binding site is 1495 ACC AGA CTC TAC CTCTGAATGTG. RGS16 3’ UTR-mut was derived by mutating the miR-181a binding site to 1495 ACC AGA CTC TAC CTCTATCAGTG. Luciferase assays were performed using Luc-pair™ miR Luciferase Assay kit per the manufacture’s instruction (GeneCopoeia). Briefly, firefly luciferase activity was measured first, followed by Renilla luciferase activity and data was recorded in a GLOMAX 20/20 luminometer (Promega, Madison, WI). Firefly luciferase activity was normalized to Renilla luciferase activity in the same well(23).
Invasion assay
Invasive activity of CS cells was analyzed with matrigel coated BD Falcon Cell Culture Inserts (BD Biosciences, Bedford, MA) as previously described (13). Briefly, 180 µl of BD Matrigel Matrix Growth Factor Reduced (BD Biosciences, Bedford, MA) diluted 1:3 with serum-free medium was used to coat 12-well inserts and incubated at 37°C for 2 h. 800 µl of cells (106/ml) in complete medium containing 1% FBS were added to the upper wells. 1.5 ml of 5% FBS complete medium containing recombinant SDF-1 (50 ng/ml, R&D Systems) was added to the lower wells. After incubating for 72 hrs in hypoxia, cells that invade across the membrane were stained with Cell Stain Solution (Millipore), washed, photographed, then lysed and cell number quantitated by absorbance at 560nm on a standard microplate reader. The invasion index was calculated by normalizing to the number of cells invading when the lower well had no SDF1 and no FBS.
Proliferation assay
Cells were cultured for 72 hrs and cell proliferation was measured by CellTiter 96®AQueous One Solution reagent (Promega, Madison, WI). Briefly, cells (5,000 cells per well) were seeded in 96-well culture plates, four replicate wells were used for each condition. At the indicated time points, 20 µl of CellTiter 96®AQueous One Solution reagent was added to each well and the plates were incubated for 4 h. The absorbance at OD490 was measured using SpectraMax 190 Absorbance microplate reader (Molecular Devices, Downingtown, PA).
Mouse model, bioimaging, tumor growth, metastasis analysis
Xenograft tumors in nude mice were generated as previously described(12). Briefly, 1 × 10⁶ cells in 100 μL culture medium were mixed with 300 μL Matrigel™ (BD Biosciences, San Jose, CA) and injected subcutaneously in the back of nude mice (nu/nu 6-8 week old, female, Charles River Laboratory, Wilmington, MA).
In vivo bioimaging with fluorescence-based tomography (FMT, PerkinElmer, Waltham, MA) was performed at three weeks after injection of tumor cells. Twenty-four hours before imaging, mice were injected via tail vein with 2 nmol MMPSense 680 and Angiosense 750 (PerkinElmer, Waltham, MA). Mice were anesthetized with ketamine (ip) during FMT imaging. FMT is acquired with a continuous wave-type scanner capable of acquiring transillumination, reflectance and absorption data at 680 nm excitation and 700 nm emission or 750 nm excitation and 780 nm emission (PerkinElmer). AngioSense and MMPSense content in xenograft tumors was determined by region of interest analysis as previously described (12).
Primary tumor analysis
Tumor size was measured with calipers in 3 dimensions and volumes were calculated with the formula: height × width × length × 0.52. Weight was determined after five weeks of growth at the time of excision. Part of the tumor was fixed in 10% formalin overnight, paraffin embedded, and used for H&E staining and immunostaining with CD34 antibody. Immunostained slides were photographed with a Spot RT™ camera (Diagnostic Imaging, Sterling Heights, MI, USA) and Nikon E800 microscope at 200× to determine microvascularity in the tumor as previously described(4;12). Some of the tumor was stored in RNAlater or lysis buffer for protein extraction.
Lung Analysis
Lungs were analyzed with microscopy after fixation in 10% formalin. Transverse sections were made at 100µm intervals, yielding 12-15 sections per lung. H&E stained slides were scanned with an Aperio Scanscope (Aperio Technologies, Inc.). Each slide was examined for metastases and metastatic burden was quantified as the number of slides with metastases per lung.
Study approval
All animal studies were approved by the IACUC at Rhode Island Hospital and were carried out in accordance with the National Institutes of Health Guide for the Care and Use of Laboratory Animals, (eighth edition). Human tissue specimens were collected and processed under approved IRB protocols from the Rhode Island Hospital.
Statistics
All experiments were repeated at least 3 times. Statistical analysis was performed with GraphPad Prism, v 5.0 (GraphPad Software, San Diego, CA). Experiments with two groups (qRT-PCR, invasion assay, and tumor weight) were analyzed with the Student’s t-test. Experiments with three or more groups (qRT-PCR, ELISA, luciferase activity) were compared with one-way ANOVA, followed by the Student’s t-test with Bonferroni correction for individual comparisons. The number of lung sections with metastases were compared with the Mann-Whitney U test. The null hypothesis of no difference was rejected at a significance level of 5%.
Results
miR-181a is a hypoxia responsive microRNA overexpressed in chondrosarcoma
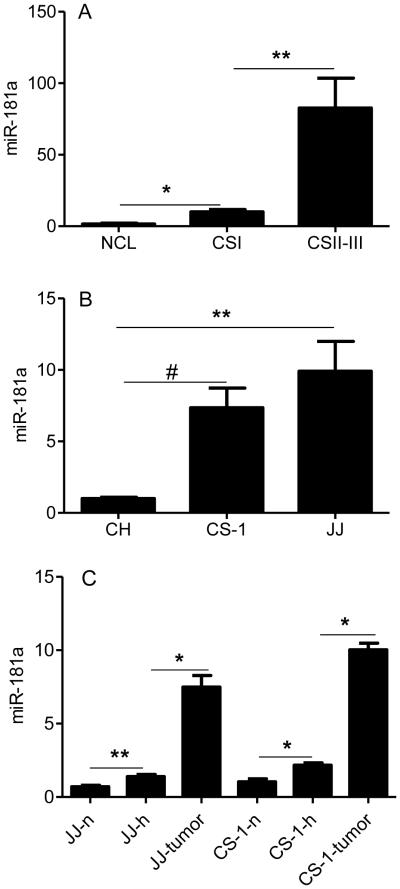
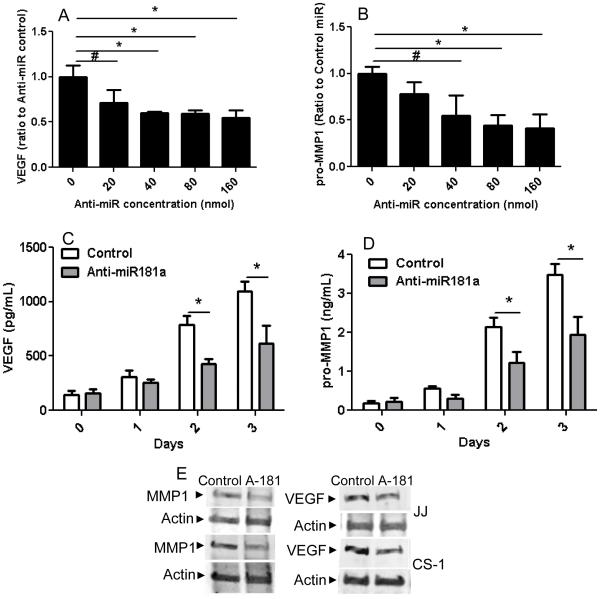
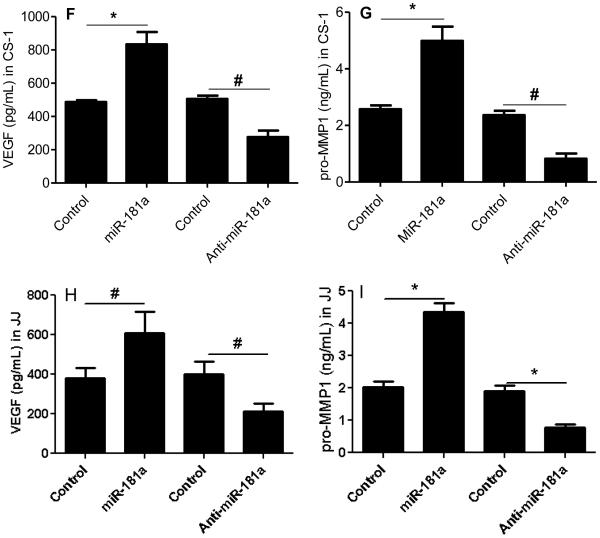
Multiple studies have identified overexpressed microRNAs in cancer that are related to the malignant phenotype. Some of these microRNAs are also induced by hypoxia, a condition that enhances aggressive tumor behavior. Since chondrosarcoma lacks effective systemic treatments and since strategies to block the effects of hypoxia are also limited, we analyzed microRNA expression in chondrosarcoma with the goal of identifying microRNAs that could potentially lead to a targeted therapy. miR-181a was identified as an overexpressed microRNA in chondrosarcoma by screening of human tumors by microRNA array and chondrosarcoma cell lines for hypoxia regulated microRNAs(18). An additional criterion was that the overexpressed microRNA increased expression of VEGF and MMP1. In order to validate miR-181a as an oncomiR in chondrosarcoma, a series of primary tumors was analyzed for miR-181a expression. Overexpression of miR-181a was confirmed with qRT-PCR in a series of twenty-three primary human grade I, II, and III chondrosarcoma. Expression of miR-181a correlated with tumor grade: eight-fold higher in grade II/III compared to grade I tumors, and six-fold higher in grade I tumors than in cartilage (Figure 1A). In chondrosarcoma cell lines JJ and CS-1, miR-181a expression was elevated compared to chondrocytes (Figure 1B). In the tumor cell lines miR-181a expression was more highly expressed in xenograft tumors than in vitro in hypoxic conditions (Figure 1C). Transfection with an antagomir to miR-181a inhibited VEGF and MMP-1 in a dose dependent manner (Figure 2 A,B). Time course analysis showed an increasing effect of the antagomir on VEGF and MMP-1 expression (Figure 2 C,D). Western blot on cell lysates from both cell lines from day two confirmed the ELISA results (Figure 2E). We engineered JJ and CS-1 cells to express anti-miR-181a via transduction with a lentivirus construct and this also decreased secreted VEGF and MMP1 into conditioned media. Further overexpression of miR-181a had the opposite effect, increasing VEGF and MMP1 (Figure 2 F-I).
Figure 1. miR-181a expression is correlated with chondrosarcoma grade.
miR-181a expression was evaluated with real-time PCR with normalization to U17a as described in Methods. (A) articular cartilage, human chondrosarcoma grade I, and grades II and III, (B) chondrocytes, CS-1 (derived from grade III tumor) and JJ cell lines, (C) cell lines cultured in normoxia, hypoxia, and as xenograft tumors. NCL: articular cartilage (N = 12), CSI: human chondrosarcoma grade I (N = 7), CSII-III: human chondrosarcoma grades II and III (N = 16), CH: chondrocytes, CS-1, JJ: chondrosarcoma cell lines, n: normoxia; h: hypoxia (2% O2); JJ-tumor, CS-1-tumor: xenograft tumors. Levels of mRNA are shown as mean ± SD for 3 replicate determinations, * p<0.001, ** p<0.01, # p<0.05.
Figure 2. miR-181a knockdown inhibits VEGF and MMP1 secretion in vitro.
VEGF and pro-MMP1 in conditioned media was analyzed with ELISA and Western blotting as described in Methods. (A, B) CS-1 cells were transfected with anti-miR-181a at various concentrations and VEGF and MMP1 in conditioned media measured after two days. (C,D) CS-1 cells were transfected with 40nM anti-miR-181a and VEGF and MMP1 were measured for three days with ELISA and on day two with Western blotting (E). CS-1 cells (F, G) and JJ cells (H, I) were transfected with miR-181a or control or lenti virus expression construct with anti-miR-181a or control and VEGF and MMP1 concentration measured two days after transfection. * p<0.001, ** p < 0.01.
Anti-miR-181a inhibits angiogenesis, tumor growth, MMP1 activity, and metastasis in a xenograft model
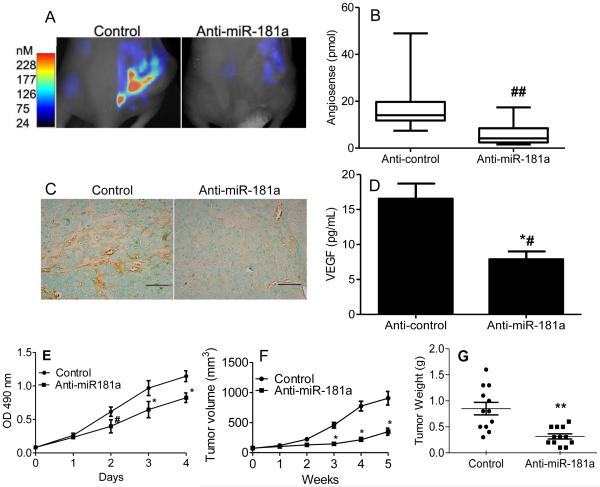
In order to evaluate whether anti-miR-181a has similar effects in vivo as it does in vitro, and thereby to assess a therapeutic antagomir approach, the metastatic chondrosarcoma cell line CS-1 was transduced with a lentivirus expression construct for anti-miR-181a or control prior to implantation in nude mice. Knockdown of miR-181a expression in xenograft tumors was > 80% (data not shown). Bioimaging of mice bearing xenograft tumors was performed at three weeks with Fluorescence-based Tomography (FMT) using AngioSense and MMPSense probes, indicators of angiogenesis and MMP activity. Angiogenesis in xenograft tumors was inhibited by anti-miR-181a (Figure 3A & B) and this result was confirmed with immunohistochemistry using CD34 antibody (Figure 3C). VEGF in xenograft tumors was also decreased (Figure 3D). miR-181a knockdown inhibited cell proliferation in vitro (Figure 3E) and xenograft tumor volume and weight (Figure 3F,G).
Figure 3. Anti-miR-181a inhibits angiogenesis and tumor growth.
CS-1 cells were transduced with lenti virus expression construct with control sequence or anti-miR-181a and used for xenograft tumors as described in Methods. (A) After three weeks of tumor growth, bioimaging with Fluorescence-based Tomography was performed with AngioSense 750 probe. Representative imaging is shown. (B) Summary of imaging data with AngioSense probe, N=12, ## p<0.004. Graphs represent the median, box represents 25th-75th percentiles, bars represent range. (C) Representative xenograft tissue sections stained with CD34 antibody. Bar=100µm. (D) VEGF content in xenograft tumors was analyzed with ELISA as described in Methods, *# p < 0.003, N=8/group. (E) Cell proliferation assay, mean ± SD, N = 4, * p<0.001, # p<0.01. (F) tumor volume (n=12, * p<0.001), (G) tumor weight (N=12, ** p<0.0004).
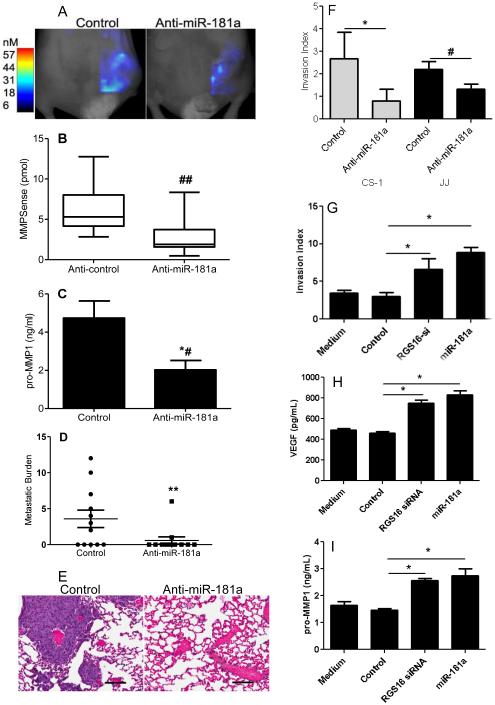
MMP activity evaluated with FMT was also decreased in xenograft tumors by miR-181a knockdown (Figure 4 A, B) as was MMP-1 content in xenograft tumors (Figure 4C). Most importantly, knockdown of miR-181a decreased lung metastases (Figures 4 D, E). Anti-miR-181a also decreased in vitro invasion in both cell lines (Figure 4 F).
Figure 4. Anti-miR181a inhibits chondrosarcoma invasion and metastasis.
CS-1 cells expressing either control or anti-miR181a were used for in vitro invasion assay and for xenograft tumors as described in Methods. After 3 weeks, xenograft tumors were evaluated with Fluorescence-based Tomography using the MMPSense probe and after 5 weeks lung metastatic burden was determined. (A) Representative imaging with MMPsense probe is shown. (B) Summary of imaging data with MMPSense probe, graphs represent the median, box represents 25th-75th percentiles, bars represent range. N=12/group, ## p<0.004. (C) MMP1 content in xenograft tumors was measured by ELISA, N=8/group, *# p <0.02. (D) metastatic burden was quantified as the number of lung sections per mouse with metastases. N=12 mice/group, ** p<0.03. (E) H&E stained lung demonstrating metastases. (F) In vitro invasion index results are shown for CS-1 and JJ cells (* p<0.001, N=9; # p<0.01) N=4/group). CS-1 cells were transfected with either control siRNA and control miR (control), siRNA RGS16, or miR-181a. Results of invasion assay (G), and ELISA for VEGF (H) and MMP1 (I) in conditioned media are shown. * p < 0.001, N = 4.
RGS16 is a target of miR-181a
To identify potential target genes of miR-181a, we performed a bioinformatics search using three different algorithms, TargetScan (http://www.targetscan.org), miRBase (http://www.mirbase.org), and miRanda (http://www.microrna.org). The latter predicted RGS16 as a target of miR-181a. RGS16 is a negative regulator of CXCR4 activity. Since we have previously reported increased CXCR4 signaling in chondrosarcoma, we pursued miR-181a and RGS16 as another mechanism that might explain increased CXCR4 signaling in this tumor(12).
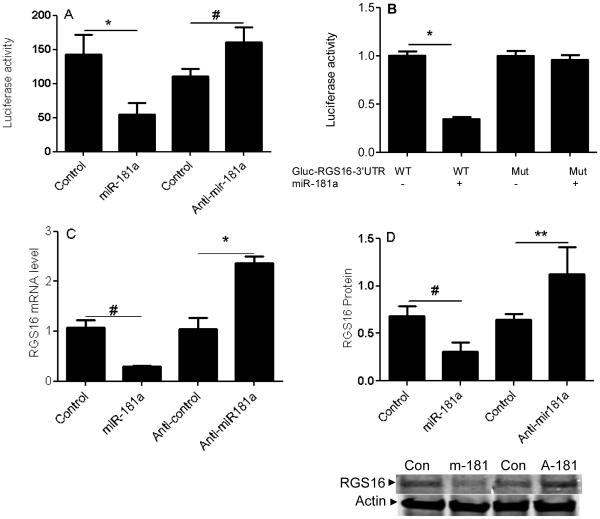
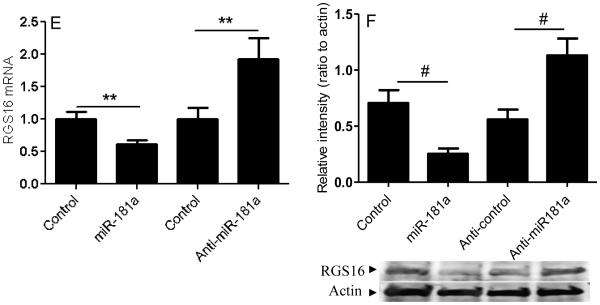
The predicted seeding site for miR-181a is in the RGS16-3’UTR, which is evolutionarily conserved across different species. miR-181a transfection and RGS16 knockdown have similar effectiveness at increasing invasion, and VEGF and MMP-1 expression (Figure 4 G-I). To confirm the prediction that miR-181a targets RGS16, we created a luciferase reporter construct containing luciferase and the WT or mutated RGS16 3’UTR. The results show that miR-181a transfection inhibits WT RGS16 3’UTR, while knockdown with anti-miR-181a had the opposite effect (Figure 5A). There was no effect of miR-181a with the mutated RGS16 3’UTR (Figure 5B). We then analyzed the effect of miR-181a transfection and knockdown on RGS16 expression in both cell lines. qRT-PCR showed the expected effects if RGS16 was the target: miR-181a overexpression decreased RGS16 mRNA and knockdown of miR-181a increased RGS16 mRNA (Figure 5C, E). Western blotting was consistent with the PCR results (Figure 5D, F).
Figure 5. miR-181a regulates RGS16 expression.
RGS16 expression and luciferase reporter activity were evaluated in CS-1 cells after transfection with miR-181a, anti-miR-181a, or control. (A) Luciferase activity of WT construct after miR-181a, anti-miR-181a, or control transfection. (B) Luciferase activity of wild type and mutated RGS16 constructs after miR-181a transfection. RGS16 mRNA (C, E) and protein (D, F) were quantified relative to B2M with real-time PCR and actin in CS-1 and JJ cells as described in Methods. Data are shown as mean ± SD , N=3. Data are mean ± SEM. * p<0.001, # p<0.05, ** p<0.01.
RGS16 is underexpressed in chondrosarcoma and transfection counteracts the effect of miR-181a overexpression
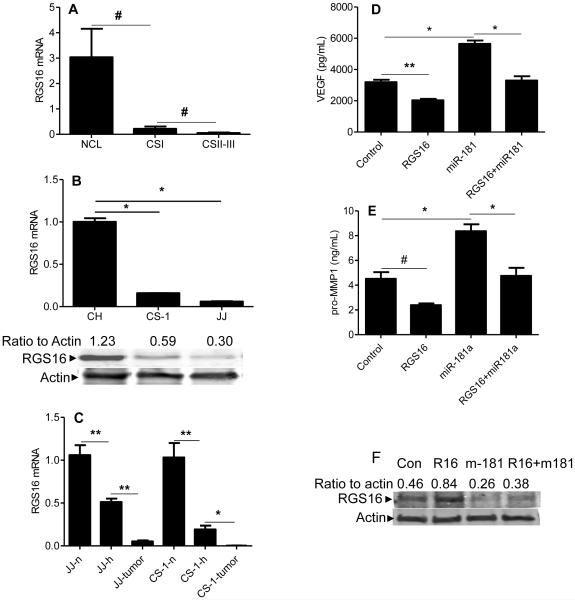
We analyzed RGS16 expression in human and xenograft tumors, cell lines, and during hypoxic conditions, and found that the expression pattern is opposite to that of miR-181a. That is, RGS16 expression was decreased in human tumors compared to cartilage (Figure 6A); chondrosarcoma cell lines compared to chondrocytes (Figure 6B), and further decreased by hypoxia and in xenograft tumors (Figure 6C).
Figure 6. RGS16 expression is decreased in chondrosarcoma and RGS16 transfection counteracts the effects of miR-181a on VEGF and MMP1 expression.
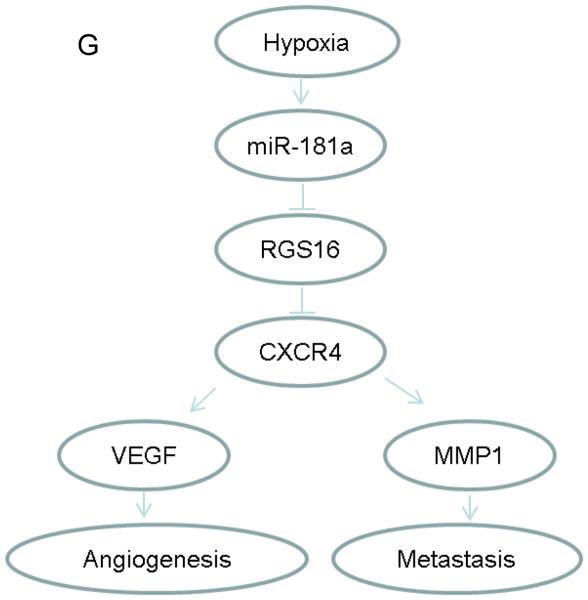
RGS16 was evaluated with real-time PCR and Western blotting; VEGF and MMP1 were quantitated with ELISA as described in Methods. (A) articular cartilage and human chondrosarcoma, (B) chondrosarcoma cell lines compared to chondrocytes, (C) xenograft tumors compared to cell lines in vitro. NCL: articular cartilage (N = 12), CSI: human chondrosarcoma grade I (N = 7), CSII-III: human chondrosarcoma grades II and III (N= 16), CH: chondrocytes; JJ, CS-1: chondrosarcoma cell lines (CS-1 derived from grade III tumor), n: normoxia; h: hypoxia (2% O2); JJ-tumor, CS-1-tumor: xenograft tumors. Levels of mRNA are shown as mean ± SD, N = 3. CS-1 cells were transfected with control, RGS16 cDNA construct, miR-181a mimic, or both RGS16 cDNA construct and miR-181a, as described in Methods. VEGF (D) and MMP1 (E) in conditioned media after 2 days in hypoxic culture. # p< 0.05, * <0.001, ** p<0.01. (F) Western blot confirming the effect of RGS16 transfection and miR-181a on RGS16 protein levels. (G) Schematic representation illustrating the role of miR-181a in chondrosarcoma angiogenesis and metastasis.
To establish a functional relationship between miR-181a and RGS16, CS-1 cells were transfected with RGS16 cDNA construct, miR-181a mimic, or both. The effect of RGS16 transfection on RGS16 protein levels was confirmed with Western blotting (Figure 6 F) and RGS16 transfection decreased VEGF and MMP1, and cotransfection of RGS16 and miR-181a reversed the increase in VEGF and MMP1 in conditioned media after miR-181a transfection alone (Figure 6 D, E).
Discussion
In this study we show that in vivo growth in a xenograft chondrosarcoma model increases expression of miR-181a even more than hypoxic cell culture conditions and that expression of miR-181a correlates with tumor grade. We have previously reported that miR-181a increases expression of VEGF in vitro. Here we report that miR-181a also increases MMP1 and at least part of the mechanism by which miR-181a overexpression increases expression of VEGF and MMP1 is by inhibiting RGS16, a negative regulator of CXCR4. miR-181a directly targets RGS16 through binding to the 3’UTR resulting in decreased RGS16 mRNA and protein. We have previously reported that HIF-1 directly increases CXCR4 expression in chondrosarcoma, resulting in an indirect mechanism of increased VEGF and MMP1 expression(12;13). Hypoxia regulated transcription of microRNA is yet another mechanism driving the expression of these factors in chondrosarcoma by inhibiting an inhibitor of CXCR4 signaling. miR-181a knockdown restored RGS16 expression and decreased VEGF and MMP1 expression, angiogenesis, and most importantly, lung metastases in a xenograft model (Figure 6G).
In cancer, chemokines, their receptors, and innate regulators of receptor activity are important determinants of invasion, angiogenesis, and metastasis. There are four groups of chemokine receptors(26). Of those, CXCR4 is the one most commonly expressed in tumors, and the one whose expression is most related to development of metastases(27). The ligand for CXCR4 is the chemokine stromal cell derived factor one (SDF1)(28;29). CXCR4/SDF1 promotes metastasis by mediating proliferation and migration of tumor cells and enhancing tumor-associated angiogenesis(30-32). CXCR4 is a seven-transmembrane G-protein-coupled receptor, whose activation also triggers intracellular signaling cascades, whose downstream targets include MMP1 and VEGF(32;33). The increased expression of chemokine receptors has been most widely investigated in carcinomas(34-36). We and others have found that CXCR4 is overexpressed in chondrosarcoma cells and primary chondrosarcoma(13;37;38). We have also shown that CXCR4 expression is further increased when chondrosarcoma cells are cultured in hypoxia and increased even more so when grown in mice as xenograft tumors(12). CXCR4 signaling through p-ERK increases expression of VEGF and MMP1 as well as angiogenesis and invasion(13), thus linking the CXCR4 pathway to the angiogenic switch(2;39) and two of the hallmarks of cancer(1;40). Extracellular blockade of CXCR4 signaling with the drug AMD3100 partially inhibits secretion of MMP1 and VEGF(12;13). Intracellular regulation of CXCR signaling involves regulator of G-protein signaling (RGS) proteins, a family of proteins that either enhance or inhibit GPC signaling, the latter by accelerating the deactivation of the activated Galpha subunit through GTPase activity(41). RGS proteins are critical modulators of signal transduction pathways in normal physiology and in cancer. Individual RGS proteins can either be over- or under-expressed in specific cancers. RGS16 is an inhibitor of CXCR4 signaling in normal megakaryocytes and T lymphocytes(24;42). In breast cancer, loss of RGS16 enhances growth factor-related PI3K signaling, proliferation, and resistance to tyrosine kinase inhibition(43). In pancreatic cancer, underexpression of RGS16 is a predictor for lymph node metastasis(44). Thus, diminished RGS16 leads to cancer progression. Our data is the first to show loss of RGS16 expression in chondrosarcoma and first to show that the mechanism of RGS16 loss involves miR-181a. Another potentially effective method to inhibit CXCR4 signaling, or a method to augment extracellular blockade, would be an intracellular strategy involving anti-miR-181a.
It has been postulated that overexpressed miRs may be master regulators of angiogenesis, invasion, and metastasis through regulation of multiple target genes related to these phenotypes. Our data show that loss of RGS16 expression results from overexpression of miR-181a. MiR-181a is highly conserved across species. Its overexpression is associated with hypoxia(45), progression of myelodysplastic syndromes to acute myeloid leukemia(46), and has recently been reported in osteosarcoma(47) and breast cancer(48). Our data as well as a xenograft study using human myeloma cell lines treated with miR-181a antagonists resulted in significant suppression of tumor growth(46). Thus, miR-181a is a candidate therapeutic target. We have shown that AMD3100 decreases tumor growth, angiogenesis and metastasis in a xenograft model(Sun et al. 1163-70). The current study shows that miR-181a knockdown has similar effects as AMD3100(Sun et al. 1163-70). These data are important in demonstrating that CXCR4 inhibition with either AMD3100 or anti-miR-181a are effective in vivo strategies. Anti-miR-181a may inhibit additional pathways than does AMD3100. The advantage of the anti-miR approach is that multiple, partially redundant signaling pathways related to tumor progression may be targeted; one reason anti-miR strategies are under clinical development(49). Whether antagomir therapy would be more or less durable and effective needs to be evaluated and a method of systemic delivery developed.
There are some limitations to our study. We did not attempt to comprehensively analyze additional mechanisms of miR-181a regulation. Hypoxia and HIF-1 increase miR-181a expression(Sun et al. 907-13), but there may be other mechanisms. We also did not attempt to identify all possible targets of miR-181a. In addition to RGS16, there may be other targets of miR-181a and RGS16 may regulate other pathways besides CXCR4.
In conclusion, miR-181a is an oncomir, whose overexpression results in gain of function by inhibiting an inhibitor of CXCR4 signaling. Antagomir based therapy for chondrosarcoma may prove efficacious and has a potential role in therapeutic strategies.
Supplementary Material
Implications.
Targeting miR-181a can inhibit tumor angiogenesis, growth, and metastasis; thus suggesting the possibility of antagomir-based therapy in chondrosarcoma.
Acknowledgments
The authors thank Jason T. Machan, PhD for statistical support, Jack Wands, MD for scientific mentoring, and Drs. Joel Block and Francis Hornicek for chondrosarcoma cell lines.
Financial support: One or more of the authors have received funding from the National Institutes of Health and from the National Center for Research Resources, a component of NIH: L. Wei (Grant R01AR059142), Q. Chen (Grants 1P20RR024484-01 and 9P20GM104937-06), R.M. Terek (Grants 1P20RR024484-01 and 1R01CA166089).
Footnotes
The authors have no conflicts to report.
Reference List
- 1.Hanahan D, Weinberg RA. The hallmarks of cancer. Cell. 2000 Jan 7;100(1):57–70. doi: 10.1016/s0092-8674(00)81683-9. [DOI] [PubMed] [Google Scholar]
- 2.Hanahan D, Folkman J. Patterns and emerging mechanisms of the angiogenic switch during tumorigenesis. Cell. 1996 Aug 9;86(3):353–64. doi: 10.1016/s0092-8674(00)80108-7. [DOI] [PubMed] [Google Scholar]
- 3.McGough RL, Lin C, Meitner P, Aswad BI, Terek RM. Angiogenic cytokines in cartilage tumors. Clin.Orthop.Relat Res. 2002 Apr;(397):62–9. doi: 10.1097/00003086-200204000-00009. [DOI] [PubMed] [Google Scholar]
- 4.McGough RL, Aswad BI, Terek RM. Pathologic neovascularization in cartilage tumors. Clin.Orthop.Relat Res. 2002 Apr;(397):76–82. doi: 10.1097/00003086-200204000-00011. [DOI] [PubMed] [Google Scholar]
- 5.Lee FY, Mankin HJ, Fondren G, Gebhardt MC, Springfield DS, Rosenberg AE, et al. Chondrosarcoma of bone: an assessment of outcome. J.Bone Joint Surg.Am. 1999 Mar;81(3):326–38. doi: 10.2106/00004623-199903000-00004. [DOI] [PubMed] [Google Scholar]
- 6.Folkman J. Fighting cancer by attacking its blood supply. Sci.Am. 1996 Sep;275(3):150–4. doi: 10.1038/scientificamerican0996-150. [DOI] [PubMed] [Google Scholar]
- 7.Semenza GL. Defining the role of hypoxia-inducible factor 1 in cancer biology and therapeutics. Oncogene. 2010 Feb 4;29(5):625–34. doi: 10.1038/onc.2009.441. [DOI] [PMC free article] [PubMed] [Google Scholar]
- 8.Semenza GL, Wang GL. A nuclear factor induced by hypoxia via de novo protein synthesis binds to the human erythropoietin gene enhancer at a site required for transcriptional activation. Mol.Cell Biol. 1992 Dec;12(12):5447–54. doi: 10.1128/mcb.12.12.5447. [DOI] [PMC free article] [PubMed] [Google Scholar]
- 9.Boeuf S, Bovee JV, Lehner B, Hogendoorn PC, Richter W. Correlation of hypoxic signalling to histological grade and outcome in cartilage tumours. Histopathology. 2010 Apr;56(5):641–51. doi: 10.1111/j.1365-2559.2010.03528.x. [DOI] [PubMed] [Google Scholar]
- 10.Kubo T, Sugita T, Shimose S, Matsuo T, Arihiro K, Ochi M. Expression of hypoxia-inducible factor-1alpha and its relationship to tumour angiogenesis and cell proliferation in cartilage tumours. J Bone Joint Surg.Br. 2008 Mar;90(3):364–70. doi: 10.1302/0301-620X.90B3.19806. [DOI] [PubMed] [Google Scholar]
- 11.Lin C, McGough R, Aswad B, Block JA, Terek R. Hypoxia induces HIF-1alpha and VEGF expression in chondrosarcoma cells and chondrocytes. J.Orthop.Res. 2004 Nov;22(6):1175–81. doi: 10.1016/j.orthres.2004.03.002. [DOI] [PubMed] [Google Scholar]
- 12.Sun X, Charbonneau C, Wei L, Yang W, Chen Q, Terek RM. CXCR4-targeted therapy inhibits VEGF expression and chondrosarcoma angiogenesis and metastasis. Mol.Cancer Ther. 2013 Jul;12(7):1163–70. doi: 10.1158/1535-7163.MCT-12-1092. [DOI] [PMC free article] [PubMed] [Google Scholar]
- 13.Sun X, Wei L, Chen Q, Terek RM. CXCR4/SDF1 mediate hypoxia induced chondrosarcoma cell invasion through ERK signaling and increased MMP1 expression. Mol.Cancer. 2010 Jan 26;9(1):17. doi: 10.1186/1476-4598-9-17. [DOI] [PMC free article] [PubMed] [Google Scholar]
- 14.Berend KR, Toth AP, Harrelson JM, Layfield LJ, Hey LA, Scully SP. Association between ratio of matrix metalloproteinase-1 to tissue inhibitor of metalloproteinase-1 and local recurrence, metastasis, and survival in human chondrosarcoma. J.Bone Joint Surg.Am. 1998 Jan;80(1):11–7. [PubMed] [Google Scholar]
- 15.Dalmay T, Edwards DR. MicroRNAs and the hallmarks of cancer. Oncogene. 2006 Oct 9;25(46):6170–5. doi: 10.1038/sj.onc.1209911. [DOI] [PubMed] [Google Scholar]
- 16.Wang S, Olson EN. AngiomiRs--key regulators of angiogenesis. Curr.Opin.Genet.Dev. 2009 Jun;19(3):205–11. doi: 10.1016/j.gde.2009.04.002. [DOI] [PMC free article] [PubMed] [Google Scholar]
- 17.Crosby ME, Devlin CM, Glazer PM, Calin GA, Ivan M. Emerging roles of microRNAs in the molecular responses to hypoxia. Curr.Pharm.Des. 2009;15(33):3861–6. doi: 10.2174/138161209789649367. [DOI] [PubMed] [Google Scholar]
- 18.Sun X, Wei L, Chen Q, Terek RM. MicroRNA Regulates Vascular Endothelial Growth Factor Expression in Chondrosarcoma Cells. Clin Orthop.Relat Res. 2014 Aug 9; doi: 10.1007/s11999-014-3842-0. [DOI] [PMC free article] [PubMed] [Google Scholar]
- 19.Block JA, Inerot SE, Gitelis S, Kimura JH. Synthesis of chondrocytic keratan sulphate-containing proteoglycans by human chondrosarcoma cells in long-term cell culture. J Bone Joint Surg.Am. 1991 Jun;73(5):647–58. [PubMed] [Google Scholar]
- 20.Susa M, Morii T, Yabe H, Horiuchi K, Toyama Y, Weissbach L, et al. Alendronate inhibits growth of high-grade chondrosarcoma cells. Anticancer Res. 2009 Jun;29(6):1879–88. [PubMed] [Google Scholar]
- 21.Asur R, Balasubramaniam M, Marples B, Thomas RA, Tucker JD. Bystander effects induced by chemicals and ionizing radiation: evaluation of changes in gene expression of downstream MAPK targets. Mutagenesis. 2010 May;25(3):271–9. doi: 10.1093/mutage/geq003. [DOI] [PubMed] [Google Scholar]
- 22.Banda M, Bommineni A, Thomas RA, Luckinbill LS, Tucker JD. Evaluation and validation of housekeeping genes in response to ionizing radiation and chemical exposure for normalizing RNA expression in real-time PCR. Mutat.Res. 2008 Jan 8;649(1-2):126–34. doi: 10.1016/j.mrgentox.2007.08.005. [DOI] [PubMed] [Google Scholar]
- 23.Sun X, Wei L, Chen Q, Terek RM. HDAC4 Represses Vascular Endothelial Growth Factor Expression in Chondrosarcoma by Modulating RUNX2 Activity. J.Biol.Chem. 2009 Aug 14;284(33):21881–90. doi: 10.1074/jbc.M109.019091. [DOI] [PMC free article] [PubMed] [Google Scholar]
- 24.Berthebaud M, Riviere C, Jarrier P, Foudi A, Zhang Y, Compagno D, et al. RGS16 is a negative regulator of SDF-1-CXCR4 signaling in megakaryocytes. Blood. 2005 Nov 1;106(9):2962–8. doi: 10.1182/blood-2005-02-0526. [DOI] [PubMed] [Google Scholar]
- 25.Livak KJ, Schmittgen TD. Analysis of relative gene expression data using real-time quantitative PCR and the 2(-Delta Delta C(T)) Method. Methods. 2001 Dec;25(4):402–8. doi: 10.1006/meth.2001.1262. [DOI] [PubMed] [Google Scholar]
- 26.Vandercappellen J, Van Damme J, Struyf S. The role of CXC chemokines and their receptors in cancer. Cancer Lett. 2008 Aug 28;267(2):226–44. doi: 10.1016/j.canlet.2008.04.050. [DOI] [PubMed] [Google Scholar]
- 27.Muller A, Homey B, Soto H, Ge N, Catron D, Buchanan ME, et al. Involvement of chemokine receptors in breast cancer metastasis. Nature. 2001 Mar 1;410(6824):50–6. doi: 10.1038/35065016. [DOI] [PubMed] [Google Scholar]
- 28.Tashiro K, Tada H, Heilker R, Shirozu M, Nakano T, Honjo T. Signal sequence trap: a cloning strategy for secreted proteins and type I membrane proteins. Science. 1993 Jul 30;261(5121):600–3. doi: 10.1126/science.8342023. [DOI] [PubMed] [Google Scholar]
- 29.Shirozu M, Nakano T, Inazawa J, Tashiro K, Tada H, Shinohara T, et al. Structure and chromosomal localization of the human stromal cell-derived factor 1 (SDF1) gene. Genomics. 1995 Aug 10;28(3):495–500. doi: 10.1006/geno.1995.1180. [DOI] [PubMed] [Google Scholar]
- 30.Bartolome RA, Molina-Ortiz I, Samaniego R, Sanchez-Mateos P, Bustelo XR, Teixido J. Activation of Vav/Rho GTPase signaling by CXCL12 controls membrane-type matrix metalloproteinase-dependent melanoma cell invasion. Cancer Res. 2006 Jan 1;66(1):248–58. doi: 10.1158/0008-5472.CAN-05-2489. [DOI] [PMC free article] [PubMed] [Google Scholar]
- 31.Rutkowski P, Kaminska J, Kowalska M, Ruka W, Steffen J. Cytokine and cytokine receptor serum levels in adult bone sarcoma patients: correlations with local tumor extent and prognosis. J.Surg.Oncol. 2003 Nov;84(3):151–9. doi: 10.1002/jso.10305. [DOI] [PubMed] [Google Scholar]
- 32.Liang Z, Brooks J, Willard M, Liang K, Yoon Y, Kang S, et al. CXCR4/CXCL12 axis promotes VEGF-mediated tumor angiogenesis through Akt signaling pathway. Biochem.Biophys.Res.Commun. 2007 Aug 3;359(3):716–22. doi: 10.1016/j.bbrc.2007.05.182. [DOI] [PMC free article] [PubMed] [Google Scholar]
- 33.Wang J, Wang J, Sun Y, Song W, Nor JE, Wang CY, et al. Diverse signaling pathways through the SDF-1/CXCR4 chemokine axis in prostate cancer cell lines leads to altered patterns of cytokine secretion and angiogenesis. Cell Signal. 2005 Dec;17(12):1578–92. doi: 10.1016/j.cellsig.2005.03.022. [DOI] [PubMed] [Google Scholar]
- 34.Kajiyama H, Shibata K, Terauchi M, Ino K, Nawa A, Kikkawa F. Involvement of SDF-1alpha/CXCR4 axis in the enhanced peritoneal metastasis of epithelial ovarian carcinoma. Int.J.Cancer. 2008 Jan 1;122(1):91–9. doi: 10.1002/ijc.23083. [DOI] [PubMed] [Google Scholar]
- 35.Pan J, Mestas J, Burdick MD, Phillips RJ, Thomas GV, Reckamp K, et al. Stromal derived factor-1 (SDF-1/CXCL12) and CXCR4 in renal cell carcinoma metastasis. Mol.Cancer. 2006;5:56. doi: 10.1186/1476-4598-5-56. [DOI] [PMC free article] [PubMed] [Google Scholar]
- 36.Dunn LK, Mohammad KS, Fournier PG, McKenna CR, Davis HW, Niewolna M, et al. Hypoxia and TGF-beta drive breast cancer bone metastases through parallel signaling pathways in tumor cells and the bone microenvironment. PLoS.One. 2009;4(9):e6896. doi: 10.1371/journal.pone.0006896. [DOI] [PMC free article] [PubMed] [Google Scholar]
- 37.Lai TH, Fong YC, Fu WM, Yang RS, Tang CH. Stromal cell-derived factor-1 increase alphavbeta3 integrin expression and invasion in human chondrosarcoma cells. J.Cell Physiol. 2009 Feb;218(2):334–42. doi: 10.1002/jcp.21601. [DOI] [PubMed] [Google Scholar]
- 38.Bai S, Wang D, Klein MJ, Siegal GP. Characterization of CXCR4 expression in chondrosarcoma of bone. Arch Pathol.Lab Med. 2011 Jun;135(6):753–8. doi: 10.5858/2009-0230-OA.1. [DOI] [PubMed] [Google Scholar]
- 39.Fang J, Yan L, Shing Y, Moses MA. HIF-1alpha-mediated up-regulation of vascular endothelial growth factor, independent of basic fibroblast growth factor, is important in the switch to the angiogenic phenotype during early tumorigenesis. Cancer Res. 2001 Aug 1;61(15):5731–5. [PubMed] [Google Scholar]
- 40.Hanahan D, Weinberg RA. Hallmarks of cancer: the next generation. Cell. 2011 Mar 4;144(5):646–74. doi: 10.1016/j.cell.2011.02.013. [DOI] [PubMed] [Google Scholar]
- 41.Hurst JH, Hooks SB. Regulator of G-protein signaling (RGS) proteins in cancer biology. Biochem.Pharmacol. 2009 Nov 15;78(10):1289–97. doi: 10.1016/j.bcp.2009.06.028. [DOI] [PubMed] [Google Scholar]
- 42.Lippert E, Yowe DL, Gonzalo JA, Justice JP, Webster JM, Fedyk ER, et al. Role of regulator of G protein signaling 16 in inflammation-induced T lymphocyte migration and activation. J Immunol. 2003 Aug 1;171(3):1542–55. doi: 10.4049/jimmunol.171.3.1542. [DOI] [PubMed] [Google Scholar]
- 43.Liang Z, Wu T, Lou H, Yu X, Taichman RS, Lau SK, et al. Inhibition of breast cancer metastasis by selective synthetic polypeptide against CXCR4. Cancer Res. 2004 Jun 15;64(12):4302–8. doi: 10.1158/0008-5472.CAN-03-3958. [DOI] [PubMed] [Google Scholar]
- 44.Kim JH, Lee JY, Lee KT, Lee JK, Lee KH, Jang KT, et al. RGS16 and FosB underexpressed in pancreatic cancer with lymph node metastasis promote tumor progression. Tumour.Biol. 2010 Oct;31(5):541–8. doi: 10.1007/s13277-010-0067-z. [DOI] [PubMed] [Google Scholar]
- 45.Kulshreshtha R, Ferracin M, Wojcik SE, Garzon R, Alder H, gosto-Perez FJ, et al. A microRNA signature of hypoxia. Mol.Cell Biol. 2007 Mar;27(5):1859–67. doi: 10.1128/MCB.01395-06. [DOI] [PMC free article] [PubMed] [Google Scholar]
- 46.Pons A, Nomdedeu B, Navarro A, Gaya A, Gel B, Diaz T, et al. Hematopoiesis-related microRNA expression in myelodysplastic syndromes. Leuk.Lymphoma. 2009 Nov;50(11):1854–9. doi: 10.3109/10428190903147645. [DOI] [PubMed] [Google Scholar]
- 47.Jones KB, Salah Z, Del MS, Galasso M, Gaudio E, Nuovo GJ, et al. miRNA signatures associate with pathogenesis and progression of osteosarcoma. Cancer Res. 2012 Apr 1;72(7):1865–77. doi: 10.1158/0008-5472.CAN-11-2663. [DOI] [PMC free article] [PubMed] [Google Scholar]
- 48.Taylor MA, Sossey-Alaoui K, Thompson CL, Danielpour D, Schiemann WP. TGF-beta upregulates miR-181a expression to promote breast cancer metastasis. J Clin Invest. 2013 Jan 2;123(1):150–63. doi: 10.1172/JCI64946. [DOI] [PMC free article] [PubMed] [Google Scholar]
- 49.Nana-Sinkam SP, Croce CM. MicroRNAs as therapeutic targets in cancer. Transl.Res. 2011 Apr;157(4):216–25. doi: 10.1016/j.trsl.2011.01.013. [DOI] [PubMed] [Google Scholar]
Associated Data
This section collects any data citations, data availability statements, or supplementary materials included in this article.


