Abstract
Purpose
Portal and mesenteric hemodynamics is greatly altered in portal hypertension patients. This study utilizes four-dimensional flow MRI to visualize and quantify changes in abdominal hemodynamics in patients with portal hypertension undergoing meal challenge.
Methods & Materials
Twelve portal hypertension patients and six healthy subjects participated in the study. Baseline MRI was acquired after 5 hours of fasting. Post-meal MRI was obtained 20 minutes after subjects ingested EnSurePlus®(574mL). Imaging was performed at 3T using 4D flow MRI with an undersampled radial acquisition. Flow measurements were performed blinded to subject status (fasting/meal). Flow values for each vessel were compared before and after the meal challenge using paired Student t-tests (P<0.05).
Results
After meal challenge, significant increases in blood flow were observed in supra-celiac aorta, portal vein, superior mesenteric vein and artery, in both groups (p<0.05). In patients, hepatic artery (p=0.001) and splenic vein (p=0.045) flow decreased while azygos vein flow (p=0.002) increased.
Conclusion
Portal venous flow regulation to adjust the increasing mesenteric venous flow after a meal challenge may be impaired in patients with cirrhosis. The ability to comprehensively quantify the hemodynamic response of the abdominal vasculature to a meal challenge using 4D flow MRI reveals the potential of this technique to noninvasively characterize portal hypertension hemodynamics.
Keywords: Non-Invasive, Hepatic Hemodynamics, Portal Hypertension, Meal Challenge
Introduction
Portal hypertension is an end-stage complication of liver cirrhosis that leads to dramatic and complex alterations in the hemodynamics of the hepatic and the mesenteric circulations (1). Complications include the development of portosystemic collaterals (varices) that shunt blood from the liver, renal dysfunction (hepatorenal syndrome), accumulation of intraperitoneal fluid (ascites), among others (2-4). The initial increase in portal pressure is caused by increased hepatic resistance, due to a combination of passive resistance caused by fibrosis and architectural distortion of the hepatic sinusoid, and active resistance caused by increased vascular tone (5). In later stages of cirrhosis, however, increased levels of circulating vasodilators leads to a hyperdynamic state and increased splanchnic flow. Indeed, in advanced cirrhosis, flow becomes the main determinant of increased portal pressure, following Ohm's law pressure = flow x resistance (6). Therefore, anything that increases flow to the cirrhotic liver, such as a meal for example, should increase portal pressure (7,8).
The best validated biomarker of portal hypertension is the hepatic venous pressure gradient (HVPG) (9). Therapies that reduce HVPG below 12 mmHg (or > 20% from baseline) are effective at reducing the rate of variceal bleeding, the development of ascites and help treating hepatorenal syndrome (10-14). Although most patients with variceal bleeding have an HVPG greater than 12 mmHg, most patients with HVPG greater 12 mmHg do not bleed. Therefore, HVPG has excellent negative predictive value to exclude patients at high risk of bleeding, but has a low positive predictive value to identify those with the highest risk of bleeding (15-19). Estimation of HVPG is further limited by its invasive nature, and by its dependence on the skill and experience of the operator (20,21). Non-invasive assessment of the hepatic hemodynamics using current approaches such as Doppler ultrasound and conventional two dimensional phase contrast MRI (2D PC-MRI) is challenging due to the dual blood supply to the liver and its complex and variable anatomy (22). Further, in the presence of advanced cirrhosis, increased resistance to flow leads to dramatic alterations in the hepatic and splanchnic vascular anatomy and blood flow patterns, including the development of porto-systemic collaterals (2,23,24).
Emerging time-resolved, three-dimensional (3D), three-directional flow-sensitive MRI (“4D flow MRI”) sequences for assessing blood flow to the liver provides simultaneous and spatially co-registered anatomical and hemodynamic information of all vessels within the imaging volume (25-30). However, assessment of liver hemodynamics using standard 4D flow MRI sequences is challenging due to the need for (a) large volumetric coverage, (b) high spatial resolution, (c) sensitivity to a large spectrum of flow velocities, (d) need for respiratory gating and (e) need for short scan times. Early studies using Cartesian-based 4D flow approaches for the analysis of the portal vein have shown promising results (27-30). Similarly, recent studies have validated the use of 3D radially undersampled in 4D flow MRI for visualization and quantification in the abdominal circulation, with very high spatial resolution and large volumetric coverage with an approach termed PV VIPR (Phase Contrast Vastly Undersampled Projection Reconstruction) (25,26). Coupled with 5-point velocity encoding (31) this approach allows for quantifying a wide range of flow velocities, which is particularly advantageous for evaluating the arterial, portal venous and hepatic venous circulation (26).
Ingestion of food is physiologically followed by vasodilatation and increased mesenteric blood flow, a phenomenon known as postprandial hyperemia (32). Meal challenges are standard clinical procedures applied in imaging modalities such as ultrasound and MR imaging to induce physiological hyperemia. The combination of 4D flow MRI and a meal challenge could further deepen our understanding of hepatic physiology and present a marker for pathology. The purpose of this work was to demonstrate the ability of radial 4D flow MRI to quantify the effects of a meal challenge in the mesenteric and portal circulations in patients with portal hypertension, thereby taking advantage of the large volumetric coverage to comprehensively assess the response in multiple vascular segments (31,33,34).
Methods & Materials
Human subjects
In this prospective, institutional review board approved, and Health Insurance Portability and Accountability Act - compliant study, twelve patients (mean age 54 ± 12 [26 – 73] years, mean weight 87 ± 25 kg, 7 male, 5 male) with portal hypertension were recruited. Inclusion criteria included patients 18 years of age or older with a diagnosis of portal hypertension determined either by clinical history or from imaging features of portal hypertension (eg. definite varices, splenomegaly) from recent clinical MRI studies. Patients with standard contraindications for MRI (metallic implants, claustrophobia, etc) or gadolinium based contrast agents were excluded from the study. In addition, six healthy subjects (mean age 32 ± 10 [20 – 45] years, mean weight 86 ± 9 kg; 4 male, 2 female) with no known liver disease were also recruited as controls. Written informed consent was obtained from all participants prior to inclusion.
Meal challenge
A first MR scan (“pre”) was performed after at least 5 hours of fasting (no food, liquid or chewing gum). After the first scan, subjects ingested 574mL EnSure Plus® (Abbott Laboratories, Columbus, OH; 700cal, 28% from fat, 57% from carbohydrates) (35-37). A second MR scan (“post”) was repeated 20 minutes after the meal ingestion.
MR Imaging
Studies were conducted on a clinical 3T scanner (Discovery MR750, GE Healthcare, Waukesha, WI) with a 32-channel phased-array body coil (NeoCoil, Pewaukee, WI). 4D flow MRI was performed with a 5-point, radially undersampled phase contrast acquisition (Phase Contrast with Vastly undersampled Isotropic Projection Reconstruction, PC VIPR) due to its increased velocity sensitivity performance (31,33) and complete coverage of the upper abdomen. The 3D volume was centered over the celiac axis. 4D flow MRI image parameters included: imaging volume: 32×32×24cm spherical, 1.25mm acquired isotropic spatial resolution, repetition time / echo time TR/TE=6.4/2.2ms, scan time: 12 min (26). The acquisition was respiratory gated with a bellows signal and an adaptive acceptance window of 50%. Retrospective ECG gating was accomplished with recorded R-wave locations from vector gating during the offline reconstruction. All subjects received an intravenous injection of 0.03mmol/kg gadofosveset trisodium (Lantheus, N. Billerica, MA) prior to the pre-meal MR scan. Gadofosveset trisodium is an intravascular gadolinium-based contrast agent that increases the image signal to noise ratio (SNR) and velocity to noise ratio (VNR) performance (38,39). The velocity encoding (venc) was adjusted post meal to account for known increases in PV flow induced by the meal challenge (pre = 100 cm/s, post = 120cm/s). The flip angle (pre = 16°) was also changed (post = 14°) to maximize signal and also account for clearance of gadolinium from the blood pool over time.
4D flow MRI Data Analysis
Data were reconstructed to 14 time frames per cardiac cycle. Phase offsets for Maxwell terms and eddy currents were corrected automatically during reconstruction (40,41). The eddy current correction was performed using 2nd order polynomial fitting of background tissue segmented based on thresholding of an angiogram (41). Velocity-weighted angiograms were calculated from the final velocity and magnitude data for all 14 time frames (34). Vessel segmentation was performed in MIMICs (Materialize, Leuven, Belgium) from the PC angiograms. For quality assurance purposes, an experienced radiologist ([SR], 15 years of experience) with fellowship training in cardiovascular and abdominal imaging reviewed all cases.
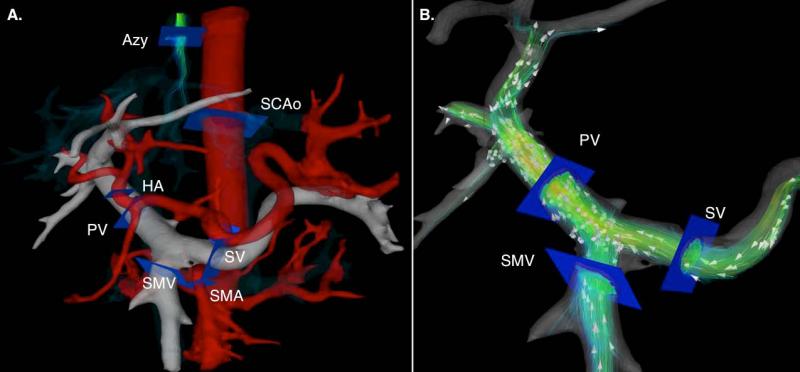
Masks resulting from segmentation were used to post-process the velocity data for flow analysis. Manual placement of cut-planes in the vessel of interest was performed for flow quantification and visualization in EnSight (CEI, Apex, NC). Qualitative evaluation of the portal venous flow in both patients and healthy control was assessed by velocity color coded streamlines. Flow measurements were performed blinded to subject status (fasting/Meal). In the patients flow was measured at the supraceliac aorta (Ao), azygos vein (Azy), common hepatic artery (HA), portal vein (PV), superior mesenteric artery (SMA), superior mesenteric vein (SMV) and splenic vein (SV) (Figure 1A). Measurements in the same vessels were performed in the group of healthy controls except for the azygos vein, which was not well visualized due to the very low flow. Patients with portal hypertension and collateral flow are known to have elevated azygos flow (24), facilitating visualization of this vessel in subjects with portal hypertension. Changes in flow were calculated as the difference of post and pre meal flow measures normalized over the pre meal flow measure.
Figure 1.
A. Segmentation of 4D flow MRI angiogram showing location of cutplanes for quantitative analysis of blood flow. B. Conservation of mass at the portal confluence for indirect validation of flow measurement accuracy. Flow in the portal vein (QPV) should be approximately equal to the flow in the splenic (QSV) and superior mesenteric vein (QSMV) added. Red lines represent the SMV and blue lines the SV contributions to the total portal blood flow respectively.
For intra and inter observer variability analysis, blood flow quantification in the SMV, SV and PV was performed by two independent observers ([AR] five years of experience, [second observer – not a coauthor], greater than one year of experience) for 3 of the volunteers and 3 of the patients. Further, one of the observers repeated the measurements on a second day (more than one month after the first measurement) to test for intra-observer variability. Bland-Altman-analysis was used to assess intra and inter-observer variability.
For quality control, the accuracy and internal consistency of the flow measurements were indirectly validated based on the concept of continuity (conservation of mass) for all subjects. Similar to our previous work (26) conservation of mass was tested at the portal confluence by measuring blood flow in the splenic vein (QSV), superior mesenteric vein (QSMV), and portal vein (QPV) such that:
| (1) |
as shown schematically in Figure 1B.
Statistics
Flow values measured in each vessel were compared before and after the meal challenge using paired Student t-tests. A p-value of 0.05 was chosen to indicate statistical significance.
Results
In all twelve patients, the cause of portal hypertension was cirrhosis due to alcohol abuse (5 patients), hepatitis C (4 patients) and other causes (3 patients). Of these, 7 patients had Childs A cirrhosis and 5 had Child B cirrhosis (mean age 54 ± 12 [26 – 73] years, mean weight 87 ± 25 kg, 7 male, 5 male). The six healthy control subjects (mean age 32 ± 10 [20 – 45] years, mean weight 86 ± 9 kg; 4 male, 2 female) had no history of liver disease.
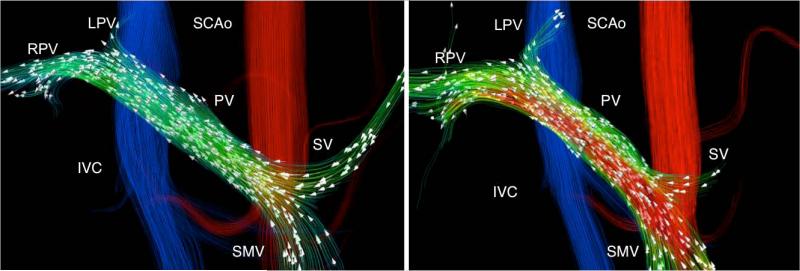
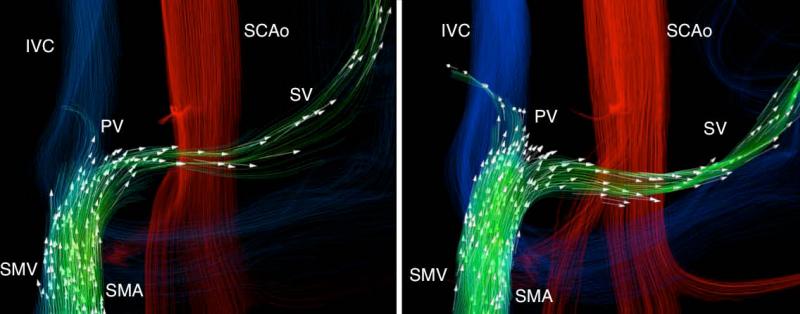
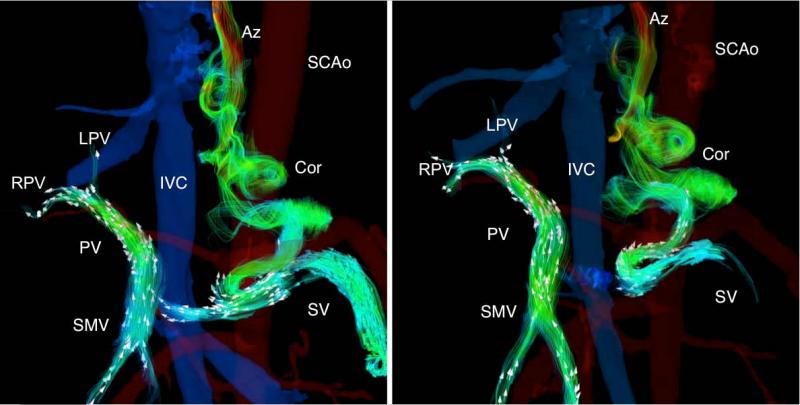
4D flow MRI was successfully performed in all 18 subjects pre- and post-meal challenge. According to the radiologist [SR], the hepatic and mesenteric angiograms demonstrated excellent vascular detail in all cases, as shown in Figure 2 that shows a representative healthy volunteer and Figures 3 and 4 that shows two patients with portal hypertension. In all cases anatomical coverage and range of velocity sensitivity was sufficient to identify not only expected anatomical variations in the arterial vasculature but also venous anatomical alterations (varices) as a response to the pathologically increased vascular resistance in patients with portal hypertension. Velocity color coded streamlines reveal the complexity of the portal venous hemodynamics present in patients with portal hypertension. The comparison of flow into the portal confluence (QSV + QSMV) with the flow in the portal vein (QPV) (Figure 1B) demonstrated an excellent correlation (r2 = 0.98) with an average error of 6.5 ± 3.7%.
Figure 2.
A 32-year-old (79.5 kg) man with no history of liver disease. Velocity distribution shown by velocity color-coded streamlines reveals the blood flow increase in the superior mesenteric (SMV) and portal veins (PV) in response to the meal challenge (White arrows represent the direction of blood flow). A reduction is splenic vein (SV) flow can also be observed.
Figure 3.
A 26-year-old woman (67 kg) with hepatic cirrhosis secondary to biliary atresia from repair for biliary atresia as an infant (Kasai procedure). Segmentation of the phase contrast angiograms revealed the presence porto-systemic shunts by means of spleno-renal shunt (SRS). Hepatofugal flow in the splenic vein was seen at baseline condition (Left). In response to the meal challenge (Right) the SMV flow increased with a small increase in the portal vein and large increase in hepatofugal flow in the splenic vein.
Figure 4.
A 34-year-old man (61.2 kg) with alcoholic cirrhosis and cystic fibrosis related liver disease. Hepatopetal flow in the portal vein was seen before and after the meal challenge, however, hepatofugal blood flow was seen both before and after the meal through the coronary vein. As a response to the meal challenge (right) the slow splenic blood flow becomes hepatofugal and drains into the coronary vein.
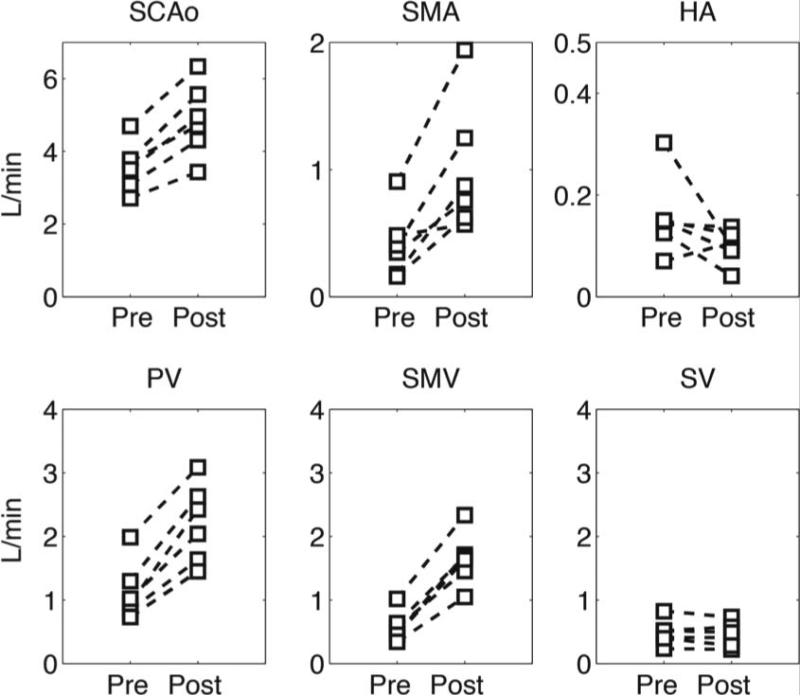
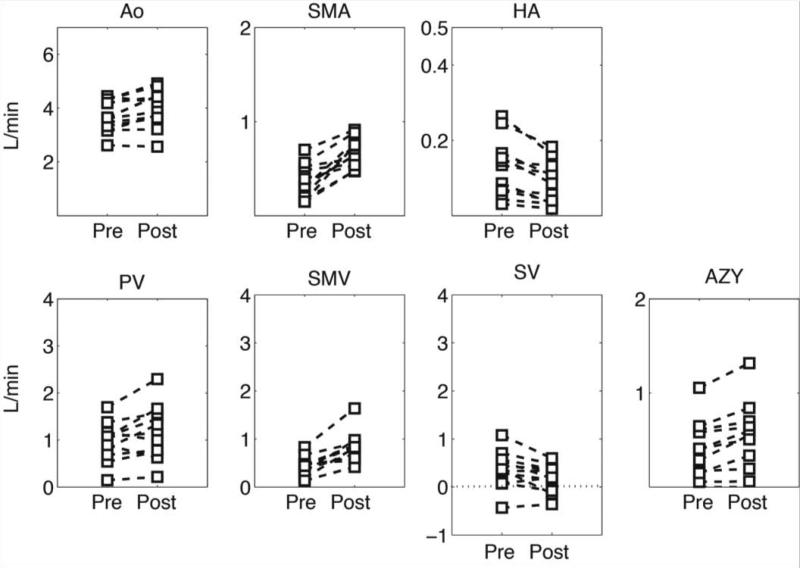
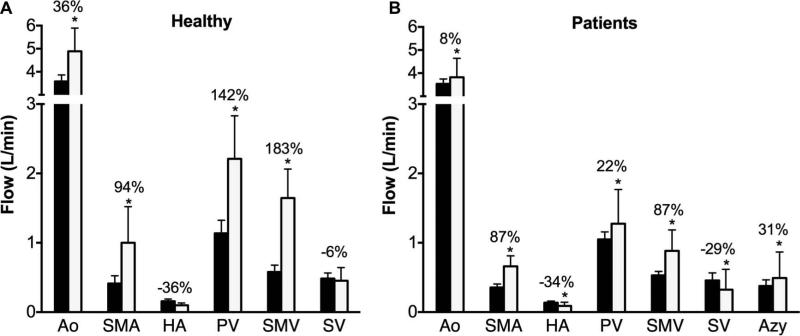
Figure 5 shows individual blood flow changes induced by the meal challenge in the different vascular segments of healthy volunteers. In general, each specific vessel showed a similar hemodynamic response, however, the hepatic artery hemodynamics revealed high variability between subjects. Similarly, Figure 6 shows individual hemodynamic responses in the portal hypertension patients. It is important to highlight that one patient showed hepatofugal (reversed) blood flow in the splenic vein before and after the meal challenge whereas in two other patients it became hepatofugal in response to the meal stimulus after being hepatopetal (forward) at baseline conditions. Significant increases in blood flow were observed after the meal challenge in the supra-celiac aorta (QAo) (p=0.0005), superior mesenteric artery (QSMA) (p=0.008), superior mesenteric vein (QSMV) (P=0.0001), and portal vein (QPV) (p=0.0003) in the healthy control group in response to the meal challenge. Decreased blood flow was seen in the hepatic artery (QHA) (p=0.15) and splenic vein (QSV) (p=0.28), however without a statistically significant difference (Figure 7A). Similarly, statistically significant increases were also seen in the patients with portal hypertension in QAo (p=0.007), QSMA (p=0.0006), QSMV (p=0.001) and QPV (p=0.015). A significant decrease in flow was seen in the hepatic artery (p=0.001) and splenic vein (p=0.045). In addition, a significant increase in blood flow in the azygos vein (QAz) (p=0.002) was observed in patients with portal hypertension (Figure 7B). Table 1 compares patients and healthy volunteers at baseline (pre) condition. In general blood flow was lower in all vessels in the group of patients, however no statistically significant difference was observed between the two groups.
Figure 5.
Quantitative analysis in healthy controls. Blood flow was quantified at the supraceliac aorta (QAo), superior mesenteric artery (QSMA), hepatic artery (QHA), portal vein (QPV), superior mesenteric vein (QSMV) and splenic vein (QSV).
Figure 6.
Quantitative analysis in patients with cirrhosis. Blood flow was quantified at the supraceliac aorta (QAo), superior mesenteric artery (QSMA), hepatic artery (QHA), portal vein (QPV), superior mesenteric vein (QSMV), splenic vein (QSV) and azygos vein (Qazy). Note the hepatofugal flow (QSV) in some patients represented by the negative blood flow.
Figure 7.
Hemodynamic response to a meal challenge in: A. Healthy subjects and B. Patients with portal hypertension. (* p<0.05)
Table 1.
Comparison of baseline flow measurements between patients and healthy controls. No significant difference was found (P<0.05)
| Flow (L/min) | Ao | PV | HA | SMA | SMV | SV |
|---|---|---|---|---|---|---|
| Controls | 3.6 ± 0.7 | 1.13 ± 0.46 | 0.16 ± 0.08 | 0.41 ± 0.27 | 0.58 ± 0.23 | 0.48 ± 0.19 |
| Patients | 3.5 ± 0.7 | 1.04 ± 0.37 | 0.14 ± 0.08 | 0.35 ± 0.18 | 0.43 ± 0.21 | 0.39 ± 0.39 |
| p value | 0.89 | 0.32 | 0.59 | 0.58 | 0.14 | 0.61 |
The portal vein and hepatic artery fractions of blood flow to the liver were calculated by dividing each specific contribution by the total blood flow to the liver, both at baseline and post meal conditions. At baseline, portal vein fraction (PVFraction = QPV /(QPV + QHA)) in patients (86.2 ± 13.4 %; range = 47.9 – 97.5 %) was not significantly different than that in the healthy volunteers (87.1 ± 6.7 %; range = 75.7 – 93.3 %) (p = 0.88). A lower increase in PVFraction was found both in patients (90.6 ± 12.1 %; range = 53.9 – 98.9 %) in comparison to healthy volunteers (95.3 ± 2.1 %; range = 92.2 – 98.4 %) after the meal challenge, however the difference between the two groups was not statistically significant (p = 0.37).
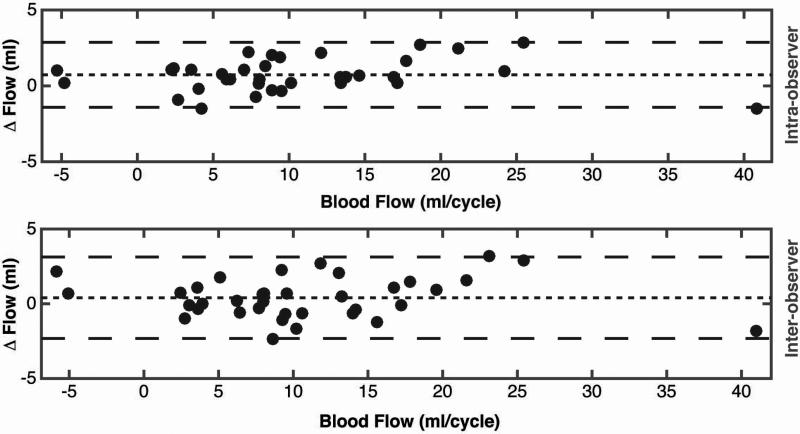
Inter-observer variability calculated using Bland-Altman analysis showed a very low bias between readers 1 and 2. The inter-observer bias (mean difference) was 0.5 mL/cycle, with 95% limits of agreement spanning −2.8 to 3.8 mL/cycle. Overall, the inter-observer bias was 4.5% of the average blood flow in the vessels evaluated. Intra-observer variability calculated using Bland-Altman analysis, showed very low bias between the two different evaluations of reader 1. The intra-observer bias (mean difference) was 0.65 mL/cycle, with 95% limits of agreement spanning -3.3 to 4.6 mL/cycle. Overall, the inter-observer bias was 6% of the average blood flow in the vessels evaluated.
Discussion
In this study, the hemodynamic response to a meal challenge was quantified in the hepatic and mesenteric vasculature of patients with portal hypertension (twelve) and normal subjects (six) using 4D flow MRI. Volumetric 4D flow MRI acquisition of the whole abdomen was performed with very high spatial resolution in a single free-breathing 10-12 minutes scan for both pre and post meal conditions. Excellent quality angiograms were obtained in all cases. Quantification of blood flow in the mesenteric vasculature revealed a stronger hemodynamic response to the meal challenge in healthy volunteers than in portal hypertension patients, however, higher variability in blood flow was observed in the group of patients. In both groups the relative contribution of PV flow and HA flow to the total liver flow agreed well with known values (~80%). Flow in the azygos is an index of flow in gastro-esophageal varices, and patients with portal hypertension have a 6-fold increase in flow compared to controls (42). Large volumetric coverage provided by 4D flow MRI allows a comprehensive analysis not only including the hepatic and mesenteric vasculature but also the azygos.
The large volumetric coverage obtained with this approach overcomes limitations commonly seen clinically when using Doppler ultrasound, such as operator dependence, limited acoustic windows, visual detection of complex vascular structures and limited inter- and intra- observer reproducibility (22). Doppler ultrasound is clinically used to perform velocity measurements in the portal vein or any vessel of interest in the mesenteric circulation, however, it is limited in its ability to accurately measure cross-sectional area and hence true flow through the vessel (43). Additionally, Iwao et al. have reported high interobserver variability for portal venous flow with a correlation coefficient of only 0.49 (44). 4D flow MRI methods can provide flow measurements in any vessel included in the volume acquired by not only measuring a volumetric velocity map but also taking into account are cross sectional area changes in the vessel of interest during a cardiac cycle. Moreover, the time-consuming and operator dependent need to prospectively acquire numerous double oblique planes needed for 2D phase contrast MRI methods is not longer an issue.
As shown in several studies (35-37), it is well known that portal blood flow increases in response to food intake, however a comprehensive hemodynamics analysis of the responses in the mesenteric and portal circulations has not been reported. Previous studies have reported that peak in hemodynamics response to the meal stimulus occurs about 20 to 60 minutes after food intake (32) and is maintained for about 150 minutes (37). It has also been shown that protein-rich food has a stronger effect on portal flow than food that is rich in fat or Carbohydrates (37,45). For the specific purpose of MR imaging, fat-rich meals are preferred based on results of Sidery et al (37), however we would hypothesize that the use of a protein-rich meal would produce stronger hemodynamic effects. Few studies have quantified the hemodynamic changes in vessels other than the portal vein (32,36,37,46). These studies have been focused on the flow distribution from the SMV and SV into the PV, and to our knowledge, no prior studies have also quantified the hemodynamic response to a meal in the HA, SMA and azygos in addition to the PV, SV and SMV. Importantly, the volumetric approach used by 4D flow MRI quantifies the flow in all of these vessels simultaneously, unlike any 2D method such as US or 2D PC-MRI (47).
Portal hypertension patients had smaller increase in PV and SMV flow in response to the meal challenge, than the healthy controls. This altered response might be related to not only anatomical changes present in the patients due to cirrhosis but also to pathological changes related to the liver stiffness, vascular contractility and other factors that increase the vascular resistance. This increase in vascular resistance further increases portal pressure and further restricts the flow through the portal circulation. A good example of the dramatic hemodynamic changes seen in patients with portal hypertension is the presence of hepatofugal blood flow in the splenic vein three of the patients and specifically two of the who had hepatofugal flow in response to meal after having hepatopetal flow at baseline.
Limitations of this study include the relatively small number of patients with variable stages of cirrhosis and etiology of liver disease as well as the age difference between patients and controls. In addition, post-processing of the velocity data sets currently requires relatively intense user interaction, typically requiring 1-2 hours by an experienced operator. Further, semi-automatic segmentation, as was used here, is subjective and may result in non-visualization of some small vessels. This may lead to small apparent errors in the conservation mass calculations. Another limitation of this study is that no repeatability experiments were performed to determine the precision of radial 4D flow MRI for quantifying flow in the portal and mesenteric circulation, however previous work from our laboratory has demonstrated strong repeatability and internal consistency of abdominal 2D and 4D PC MRI flow measurements specifically in the supra-renal aorta and renal arteries (48). Determination of the precision will be essential before widespread clinical use of these methods can be implemented, in order to understand the magnitude of change that can be measured reliably. Future studies are currently being planned to determine the repeatability (precision) of this important characteristic of this quantitative biomarker.
Finally, a definitive reference standard was not available or feasible for these human subject studies. However, internal validation and consistency measurements using the conservation of mass principle provided excellent indirect validation of the accuracy of this method. Definitive validation with a reference standard would require invasive placement of flow probes external to the relevant blood vessels. Preliminary animal studies have demonstrated excellent agreement between 4D flow MRI and flow probe measurements (49).
In conclusion, portal venous flow regulation to adjust the increasing mesenteric venous flow after a meal challenge may be impaired in patients with cirrhosis. The ability of 4D flow MRI to quantify baseline and post-prandial flow changes is a major step forward in the non-invasive assessment of the presence and severity of portal hypertension. The feasibility of quantifying not only the physiological response to a meal but also therapy-induced changes in portal hypertension hemodynamics holds promise for treatment planning specifically regarding gastro esophageal varices.
Figure 8.
Bland-Altman plots for intra-observer and inter-observer variability of 4D flow MRI in the portal circulation.
Acknowledgments
Financial Support:
The authors wish to acknowledge the support of the NIH NIDDK (R01 DK096169) and NIH NHLBI (R01 R01HL072260) as well as the University of Wisconsin Research and Development Fund. We also wish to thank GE Healthcare and Bracco Diagnostics for their support.
References
- 1.Centers for Disease Control and Prevention 2009 [Google Scholar]
- 2.Bosch J, Garcia-Pagan JC. Complications of cirrhosis. I. Portal hypertension. J Hepatol. 2000;32(1 Suppl):141–156. doi: 10.1016/s0168-8278(00)80422-5. [DOI] [PubMed] [Google Scholar]
- 3.Sussman NL, Kochar R, Fallon MB. Pulmonary complications in cirrhosis. Current Opinion in Organ Transplantation. 2011;16(3):281–288. doi: 10.1097/MOT.0b013e32834664df. [DOI] [PubMed] [Google Scholar]
- 4.Testino G, Ferro C. Hepatorenal Syndrome: A Review. Hepato-Gastroenterology. 2010;57(102-03):1279–1284. [PubMed] [Google Scholar]
- 5.Bhathal PS, Grossman HJ. Reduction of the increased portal vascular resistance of the isolated perfused cirrhotic rat liver by vasodilators. J Hepatol. 1985;1(4):325–337. doi: 10.1016/s0168-8278(85)80770-4. [DOI] [PubMed] [Google Scholar]
- 6.Toubia N, Sanyal AJ. Portal hypertension and variceal hemorrhage. The Medical clinics of North America. 2008;92(3):551–574, viii. doi: 10.1016/j.mcna.2007.12.003. [DOI] [PubMed] [Google Scholar]
- 7.Alvarez D, de las Heras M, Abecasis R, et al. Daily variation in portal blood flow and the effect of propranolol administration in a randomized study of patients with cirrhosis. Hepatology. 1997;25(3):548–550. doi: 10.1002/hep.510250309. [DOI] [PubMed] [Google Scholar]
- 8.Schiedermaier P, Koch L, Mojon A, Hermida R, Layer G, Sauerbruch T. Circadian rhythm of fasting and postprandial portal blood flow in cirrhosis. Scandinavian Journal of Gastroenterology. 2006;41(7):826–832. doi: 10.1080/00365520500463290. [DOI] [PubMed] [Google Scholar]
- 9.Bosch J, Berzigotti A, Garcia-Pagan JC, Abraldes JG. The management of portal hypertension: Rational basis, available treatments and future options. Journal of Hepatology. 2008;48:S68–S92. doi: 10.1016/j.jhep.2008.01.021. [DOI] [PubMed] [Google Scholar]
- 10.Kim MY, Baik SK, Park DH, et al. Damping index of Doppler hepatic vein waveform to assess the severity of portal hypertension and response to propranolol in liver cirrhosis: a prospective nonrandomized study. Liver International. 2007;27(8):1103–1110. doi: 10.1111/j.1478-3231.2007.01526.x. [DOI] [PubMed] [Google Scholar]
- 11.Lebrec D, Hillon P, Munoz C, Goldfarb G, Nouel O, Benhamou JP. The effect of propranolol on portal hypertension in patients with cirrhosis: a hemodynamic study. Hepatology. 1982;2(5):523–527. doi: 10.1002/hep.1840020502. [DOI] [PubMed] [Google Scholar]
- 12.Patch D, Sabin CA, Goulis J, et al. A randomized, controlled trial of medical therapy versus endoscopic ligation for the prevention of variceal rebleeding in patients with cirrhosis. Gastroenterology. 2002;123(4):1013–1019. doi: 10.1053/gast.2002.35955. [DOI] [PubMed] [Google Scholar]
- 13.Stanley AJ, Robinson I, Forrest EH, Jones AL, Hayes PC. Haemodynamic parameters predicting variceal haemorrhage and survival in alcoholic cirrhosis. Qjm-Monthly Journal of the Association of Physicians. 1998;91(1):19–25. doi: 10.1093/qjmed/91.1.19. [DOI] [PubMed] [Google Scholar]
- 14.Villanueva C, Aracil C, Colomo A, et al. Clinical trial: a randomized controlled study on prevention of variceal rebleeding comparing nadolol + ligation vs. hepatic venous pressure gradient-guided pharmacological therapy. Aliment Pharmacol Ther. 2009;29(4):397–408. doi: 10.1111/j.1365-2036.2008.03880.x. [DOI] [PubMed] [Google Scholar]
- 15.Abraldes JG, Tarantino I, Turnes J, Garcia-Pagan JC, Rodes J, Bosch J. Hemodynamic response to pharmacological treatment of portal hypertension and long-term prognosis of cirrhosis. Hepatology. 2003;37(4):902–908. doi: 10.1053/jhep.2003.50133. [DOI] [PubMed] [Google Scholar]
- 16.Bureau C, Peron JM, Alric L, et al. “A La Carte” treatment of portal hypertension: Adapting medical therapy to hemodynamic response for the prevention of bleeding. Hepatology. 2002;36(6):1361–1366. doi: 10.1053/jhep.2002.36945. [DOI] [PubMed] [Google Scholar]
- 17.Garcia-Tsao G, Groszmann RJ, Fisher RL, Conn HO, Atterbury CE, Glickman M. Portal pressure, presence of gastroesophageal varices and variceal bleeding. Hepatology. 1985;5(3):419–424. doi: 10.1002/hep.1840050313. [DOI] [PubMed] [Google Scholar]
- 18.Groszmann RJ, Bosch J, Grace ND, et al. Hemodynamic events in a prospective randomized trial of propranolol versus placebo in the prevention of a first variceal hemorrhage. Gastroenterology. 1990;99(5):1401–1407. doi: 10.1016/0016-5085(90)91168-6. [DOI] [PubMed] [Google Scholar]
- 19.Merkel C, Sacerdoti D, Bolognesi M, et al. Hemodynamic evaluation of the addition of isosorbide-5-mononitrate to nadolol in cirrhotic patients with insufficient response to the beta-blocker alone. Hepatology. 1997;26(1):34–39. doi: 10.1053/jhep.1997.v26.pm0009214449. [DOI] [PubMed] [Google Scholar]
- 20.Groszmann RJ, Wongcharatrawee S. The hepatic venous pressure gradient: anything worth doing should be done right. Hepatology. 2004;39(2):280–282. doi: 10.1002/hep.20062. [DOI] [PubMed] [Google Scholar]
- 21.Pomier-Layrargues G, Huet P. Measurement of Hepatic Venous Pressure Gradient: Methods, Interpretation, and Pitfalls. In: Sanyal A, Shah V, editors. Portal Hypertension: Pathobiology, Evaluation, and Treatment. Humana Press; Totowa, NJ: 2005. p. 141. [Google Scholar]
- 22.de Vries PJ, van Hattum J, Hoekstra JB, de Hooge P. Duplex Doppler measurements of portal venous flow in normal subjects. Inter-and intra-observer variability. J Hepatol. 1991;13(3):358–363. doi: 10.1016/0168-8278(91)90081-l. [DOI] [PubMed] [Google Scholar]
- 23.Bosch J, Bordas JM, Rigau J, et al. Noninvasive measurement of the pressure of esophageal varices using an endoscopic gauge: comparison with measurements by variceal puncture in patients undergoing endoscopic sclerotherapy. Hepatology. 1986;6(4):667–672. doi: 10.1002/hep.1840060421. [DOI] [PubMed] [Google Scholar]
- 24.Bosch J, Groszmann RJ. Measurement of azygos venous blood flow by a continuous thermal dilution technique: an index of blood flow through gastroesophageal collaterals in cirrhosis. Hepatology. 1984;4(3):424–429. doi: 10.1002/hep.1840040312. [DOI] [PubMed] [Google Scholar]
- 25.Frydrychowicz A, Landgraf BR, Niespodzany E, et al. Four-dimensional velocity mapping of the hepatic and splanchnic vasculature with radial sampling at 3 tesla: A feasibility study in portal hypertension. J Magn Reson Imaging. 2011 doi: 10.1002/jmri.22712. [DOI] [PMC free article] [PubMed] [Google Scholar]
- 26.Roldán-Alzate A, Frydrychowicz A, Niespodzany EJ, Landgraf BR, Wieben O, B. RS. 4D MR Velocity Mapping using PC VIPR to Quantify Blood Flow In Portal Hypertension. ISMRM; Montreal, Canada: 2010. [Google Scholar]
- 27.Stankovic Z, Frydrychowicz A, Csatari Z, et al. MR-based visualization and quantification of three-dimensional flow characteristics in the portal venous system. J Magn Reson Imaging. 2010;32(2):466–475. doi: 10.1002/jmri.22248. [DOI] [PubMed] [Google Scholar]
- 28.Stankovic Z, Csatari Z, Deibert P, et al. Normal and altered three-dimensional portal venous hemodynamics in patients with liver cirrhosis. Radiology. 2012;262(3):862–873. doi: 10.1148/radiol.11110127. [DOI] [PubMed] [Google Scholar]
- 29.Stankovic Z, Csatari Z, Deibert P, et al. A feasibility study to evaluate splanchnic arterial and venous hemodynamics by flow-sensitive 4D MRI compared with Doppler ultrasound in patients with cirrhosis and controls. European journal of gastroenterology & hepatology. 2013;25(6):669–675. doi: 10.1097/MEG.0b013e32835e1297. [DOI] [PubMed] [Google Scholar]
- 30.Stankovic Z, Jung B, Collins J, et al. Reproducibility study of four-dimensional flow MRI of arterial and portal venous liver hemodynamics: Influence of spatio-temporal resolution. Magn Reson Med. 2013 doi: 10.1002/mrm.24939. [DOI] [PMC free article] [PubMed] [Google Scholar]
- 31.Johnson KM, Markl M. Improved SNR in phase contrast velocimetry with five-point balanced flow encoding. Magn Reson Med. 2010;63(2):349–355. doi: 10.1002/mrm.22202. [DOI] [PMC free article] [PubMed] [Google Scholar]
- 32.Chou CC. Splanchnic and overall cardiovascular hemodynamics during eating and digestion. Federation proceedings. 1983;42(6):1658–1661. [PubMed] [Google Scholar]
- 33.Gu T, Korosec FR, Block WF, et al. PC VIPR: a high-speed 3D phase-contrast method for flow quantification and high-resolution angiography. AJNR Am J Neuroradiol. 2005;26(4):743–749. [PMC free article] [PubMed] [Google Scholar]
- 34.Johnson KM, Lum DP, Turski PA, Block WF, Mistretta CA, Wieben O. Improved 3D phase contrast MRI with off-resonance corrected dual echo VIPR. Magn Reson Med. 2008;60(6):1329–1336. doi: 10.1002/mrm.21763. [DOI] [PMC free article] [PubMed] [Google Scholar]
- 35.Li KC, Hopkins KL, Dalman RL, Song CK. Simultaneous measurement of flow in the superior mesenteric vein and artery with cine phase-contrast MR imaging: value in diagnosis of chronic mesenteric ischemia. Work in progress. Radiology. 1995;194(2):327–330. doi: 10.1148/radiology.194.2.7824706. [DOI] [PubMed] [Google Scholar]
- 36.Lycklama a Nijeholt GJ, Burggraaf K, Wasser MN, et al. Variability of splanchnic blood flow measurements using MR velocity mapping under fasting and postprandial conditions--comparison with echo-Doppler. J Hepatol. 1997;26(2):298–304. doi: 10.1016/s0168-8278(97)80045-1. [DOI] [PubMed] [Google Scholar]
- 37.Sidery MB, Macdonald IA, Blackshaw PE. Superior mesenteric artery blood flow and gastric emptying in humans and the differential effects of high fat and high carbohydrate meals. Gut. 1994;35(2):186–190. doi: 10.1136/gut.35.2.186. [DOI] [PMC free article] [PubMed] [Google Scholar]
- 38.Bock J, Frydrychowicz A, Stalder AF, et al. 4D phase contrast MRI at 3 T: effect of standard and blood-pool contrast agents on SNR, PC-MRA, and blood flow visualization. Magn Reson Med. 2010;63(2):330–338. doi: 10.1002/mrm.22199. [DOI] [PubMed] [Google Scholar]
- 39.Landgraf B, Frydrychowicz A, Johnson K, et al. 4D PC MR of the portal venous system: Benefits of using a Blood Pool Contrast Agent. ISMRM; Montreal, Canada: 2010. [Google Scholar]
- 40.Bernstein MA, Xiaohong JZ, Zhou J, et al. Concomitant gradient terms in phase contrast MR: Analysis and correction. Magn Reson Med. 1998;39(2):300–308. doi: 10.1002/mrm.1910390218. [DOI] [PubMed] [Google Scholar]
- 41.Walker PG, Cranney GB, Scheidegger MB, Waseleski G, Pohost GM, Yoganathan AP. Semiautomated method for noise reduction and background phase error correction in MR phase velocity data. Journal of magnetic resonance imaging : JMRI. 1993;3(3):521–530. doi: 10.1002/jmri.1880030315. [DOI] [PubMed] [Google Scholar]
- 42.Bosch J, Mastai R, Kravetz D, Bruix J, Rigau J, Rodes J. Measurement of azygos venous blood flow in the evaluation of portal hypertension in patients with cirrhosis. Clinical and haemodynamic correlations in 100 patients. J Hepatol. 1985;1(2):125–139. doi: 10.1016/s0168-8278(85)80761-3. [DOI] [PubMed] [Google Scholar]
- 43.Vizzutti F, Arena U, Rega L, et al. Performance of Doppler ultrasound in the prediction of severe portal hypertension in hepatitis C virus-related chronic liver disease. Liver International. 2007;27(10):1379–1388. doi: 10.1111/j.1478-3231.2007.01563.x. [DOI] [PubMed] [Google Scholar]
- 44.Iwao T, Toyonaga A, Shigemori H, et al. Echo-Doppler measurements of portal vein and superior mesenteric artery blood flow in humans: inter-and intra-observer short-term reproducibility. Journal of gastroenterology and hepatology. 1996;11(1):40–46. doi: 10.1111/j.1440-1746.1996.tb00008.x. [DOI] [PubMed] [Google Scholar]
- 45.McCormick PA, Dick R, Graffeo M, et al. The effect of non-protein liquid meals on the hepatic venous pressure gradient in patients with cirrhosis. J Hepatol. 1990;11(2):221–225. doi: 10.1016/0168-8278(90)90117-a. [DOI] [PubMed] [Google Scholar]
- 46.Joynt LK, Platt JF, Rubin JM, Ellis JH, Bude RO. Hepatic artery resistance before and after standard meal in subjects with diseased and healthy livers. Radiology. 1995;196(2):489–492. doi: 10.1148/radiology.196.2.7617865. [DOI] [PubMed] [Google Scholar]
- 47.Annet L, Materne R, Danse E, Jamart J, Horsmans Y, Van Beers BE. Hepatic flow parameters measured with MR imaging and Doppler US: correlations with degree of cirrhosis and portal hypertension. Radiology. 2003;229(2):409–414. doi: 10.1148/radiol.2292021128. [DOI] [PubMed] [Google Scholar]
- 48.Wentland AL, Grist TM, Wieben O. Repeatability and internal consistency of abdominal 2D and 4D phase contrast MR flow measurements. Academic radiology. 2013;20(6):699–704. doi: 10.1016/j.acra.2012.12.019. [DOI] [PMC free article] [PubMed] [Google Scholar]
- 49.Frydrychowicz A, Winslow E, Consigny D, et al. In-vivo validation of 5-point PC-VIPR for hemodynamic assessment of the hepatic and splanchnic hemodynamics in swine. ISMRM. Montreal -Canada. 2010 [Google Scholar]


