

Abstract
IMPORTANCE
Studies document a progressive increase in heart disease risk as systolic blood pressure (SBP) rises above 115 mm Hg, but it is unknown whether an SBP lower than 120 mm Hg among adults with hypertension (HTN) lowers heart failure, stroke, and myocardial infarction risk.
OBJECTIVE
To examine the risk of incident cardiovascular (CV) events among adults with HTN according to 3 SBP levels: 140 mm Hg or higher; 120 to 139 mm Hg; and a reference level of lower than 120 mm Hg.
DESIGN, SETTING, AND PARTICIPANTS
A total of 4480 participants with HTN but without prevalent CV disease at baseline (years 1987–1989) from the Atherosclerosis Risk in Communities Study were included. Measurements of SBP were taken at baseline and at 3 triennial visits; SBP was treated as a time-dependent variable and categorized as elevated (≥140 mm Hg), standard (120–139 mm Hg), and low (<120 mm Hg). Multivariable Cox regression models included baseline age, sex, diabetes status, BMI, high cholesterol level, smoking status, and alcohol intake.
MAIN OUTCOMES AND MEASURES
Incident composite CV events (heart failure, ischemic stroke, myocardial infarction, or death related to coronary heart disease).
RESULTS
After a median follow-up of 21.8 years, a total of 1622 incident CV events had occurred. Participants with elevated SBP developed incident CV events at a significantly higher rate than those in the low BP group (adjusted hazard ratio [HR], 1.46; 95% CI, 1.26–1.69). However, there was no difference in incident CV event-free survival among those in the standard vs low SBP group (adjusted HR, 1.00; 95% CI, 0.85–1.17). Further adjustment for BP medication use or diastolic BP did not significantly affect the results.
CONCLUSIONS AND RELEVANCE
Among patients with HTN, having an elevated SBP carries the highest risk for cardiovascular events, but in this categorical analysis, once SBP was below 140 mm Hg, an SBP lower than 120 mm Hg did not appear to lessen the risk of incident CV events.
Elevated blood pressure (BP) is an important public health concern. It is highly prevalent and leads to several adverse cardiovascular outcomes, especially coronary heart disease (CHD), stroke, and heart failure (HF).1 Thus it is believed that even small improvements in the treatment of elevated BP would result in widespread cardiovascular benefit. The report to the Eighth Joint National Committee for Detection, Evaluation, and Treatment of High Blood Pressure (JNC-8) recommends that individuals achieve a target systolic BP (SBP) <140 mm Hg and diastolic BP (DBP) lower than 90 mm Hg.2 The benefit of lowering SBP to around 140 mm Hg is well accepted, but patients treated to this level of BP may still be at increased risk of adverse cardiovascular outcomes. Observational studies document a progressive increase in heart disease risk as BP rises above 115/75 mm Hg.3,4 Such evidence suggests that there may be substantial benefit to targeting treatment to an SBP lower than 120 mm Hg instead of lower than 140 mm Hg, but whether an SBP lower than 120 mm Hg lowers cardiovascular event risk (such as HF, ischemic stroke, and CHD) is unknown.
The Atherosclerosis Risk in Communities (ARIC) Study5 prospectively collected data on incident cardiovascular events in a predominantly biracial cohort. In this context, we evaluate the relationship between SBP and the development of incident cardiovascular events such as myocardial infarction (MI), HF, ischemic stroke, and CHD death to address the question of what is the optimal BP range related to the lowest rate of incident cardiovascular events in participants with hypertension (HTN). We hypothesized that among participants with HTN (treated or untreated), cardiovascular event incidence would differ according to SBP levels, with an SBP of 140 mm Hg or higher or 120 to 139 mm Hg having an increased risk of incident cardiovascular events compared with an SBP lower than 120 mm Hg. And because African Americans are at greater risk of HTN and HTN-related cardiovascular outcomes,6 we hypothesized that the this relationship would be more pronounced among African Americans.
Methods
The ARIC Study5 is an ongoing longitudinal cohort study designed to investigate the causes of atherosclerosis and cardiovascular disease. Detailed study rationale, design, and procedures have been previously published.5 The institutional review board at each participating institution approved the ARIC study, and all participants provided informed consent before each examination. At baseline (years 1987–1989), 15 792 men and women aged 45 to 64 years were enrolled in the study from 4 US communities: Forsyth County, North Carolina; Jack-son, Mississippi; suburban Minneapolis, Minnesota; and Washington County, Maryland. Subsequently, 3 follow-up examinations occurred at 3-year intervals after the baseline visit until the 1996–1998 follow-up. Telephone calls were made annually after enrollment to ascertain participant health status and any hospitalizations.
Trained study personnel and research technicians took all physical measurements and administered all questionnaires following a standardized protocol that included quality control measures. Technicians measured 3 seated BP readings after a 5-minute rest using random 0 sphygmomanometers. The average of the last 2 measures was used for analysis. Participants were requested to bring all their current medications during the field center visits. Interviewers inquired about whether the participants used medications for hypertension or diabetes, and the names of medications used in the past 2 weeks were transcribed from participants’ medication bottles. Body mass index (BMI) was calculated as weight in kilograms divided by height in meters squared. Diabetes mellitus was defined as having a fasting blood glucose level higher than 126 mg/dL, a non-fasting blood glucose level higher than 200 mg/dL, use of hypoglycemic medication, or a self-reported physician’s diagnosis. High cholesterol was defined as a total serum cholesterol higher than 240 mg/dL. Current smoking status (ever or never smoker) and alcohol drinking status (ever or never drinker) were self-reported. (To convert glucose to millimoles per liter, multiply by 0.0555; to convert cholesterol to millimoles per liter, multiply by 0.0259.)
Of the original ARIC cohort study members, because of a small sample size, non–African Americans and nonwhites were excluded from this analysis (n = 35), as were African Americans who resided in Minneapolis or Washington County (n = 55). Only participants with HTN (defined as having an SBP >140 mm Hg and a DBP >90 mm Hg at baseline; having a self-reported history of physician-diagnosed HTN; or taking anti-hypertensive medication) were included in this analysis. Participants with missing baseline BP data were excluded from this analysis. Included participants were further categorized into 3 groups based on SBP level: Elevated SBP (≥140 mm Hg), Standard SBP (120–139 mm Hg), and Low SBP (<120 mm Hg) groups. Measurements of BP from the first screening visit (baseline) plus all 3 subsequent clinic visits spanning a period of 9 years were used to derive a time-dependent BP exposure variable for this study. Reclassification of participants into different BP categories based on subsequent clinic visits is detailed in eTable 1 in the Supplement.
Study Outcome Events
Our primary outcome was a composite of incident MI, CHD death, HF, and ischemic stroke. Each of these outcomes was also analyzed separately in secondary analysis. Incident MI or a CHD-related death was treated as a singular outcome (MI/CHD) throughout. Cardiovascular events were ascertained via annual telephone contacts with participants (or proxies) to identify all deaths and hospitalizations and by surveying discharge lists from local hospitals and death certificates from state vital statistics offices for potential cardiovascular events and recording of International Classification of Diseases, Ninth Revision (ICD-9) and/or International Classification of Diseases, Tenth Revision (ICD-10) codes from all hospital records occurring from baseline (1987–1989) through December 31, 2010.
Heart failure was defined as the first occurrence of either (1) an HF hospitalization that included an ICD-9 discharge code of 428 (428.0 to 428.9) in any position or (2) a death certificate with an ICD-9 code of 428 (HF) or an ICD-10 code of I50 (HF) in any position. The validity of this end point in ARIC has been documented.7 For ischemic stroke and MI/CHD, hospital records were obtained and abstracted. All MI/CHD events were validated by a committee of physicians using standardized criteria.8 Incident strokes were validated by a combination of computerized algorithm and physician review.9 Participants were excluded from this analysis if they had a positive or unknown history of prevalent stroke and/or transient ischemic attack; unknown HF status or prevalent HF defined using the Gothenburg criterion10; or prevalent CHD determined by the presence of at least 1 of the following at the baseline visit: Q waves on the electrocardiogram, self-reported history of MI diagnosed by a physician, coronary artery bypass graft, or coronary angioplasty.
Statistical Analysis
To assess statistically significant differences of baseline demographic factors and key covariates across baseline SBP level categories, the Cochran-Armitage trend test was used for sex, diabetes, race, and high cholesterol level; the Kruskall-Wallis test for trend was used for cigarette and alcohol use; and the Spear-man ρ test for trend was used for age and BMI. In addition, P values comparing standard vs low and elevated vs low SBP groups were obtained by the χ2 test for categorical measures and Wilcoxon rank sum tests for continuous measures. Incident rates (IRs) of hospitalized cardiovascular events were calculated by dividing the number of new HF, ischemic stroke, or MI/CHD cases in each SBP level category by the corresponding person-years. Incidence rate ratios (IRRs) were derived using the low BP group as the reference group. Poisson regression analysis was used to obtain age- and sex-adjusted IRs and IRRs. To assess the effect of SBP levels on HF, ischemic stroke, and MI/CHD incidence, survival analyses models using SBP as a time-dependent covariate were fit using BP measures from clinical examinations 1 through 4 over a period of more than years. Cox proportional hazards regression was used to estimate hazard ratios (HRs) and 95% CIs for the association between SBP level and incident cardiovascular events. Time to cardiovascular event was modeled in the presence of censoring. An individual was considered censored when he or she died from another cause or when the observation period ended. Models were fit for SBP as an ordinal variable with the inclusion for key covariates (baseline age, race, sex, diabetes, BMI, high cholesterol level, smoking status, and alcohol intake) to adjust for their effects. There was no significant violation of the proportional hazards assumption (P = .09) for the composite outcome (HF, ischemic stroke, or MI/CHD death) using the Wald linear hypothesis χ2 test. Standard Kaplan-Meier survival curves were generated for each baseline SBP category; the survival curves were compared with the use of the unadjusted log-rank test.
Additional analysis stratified our results according to race and sex to determine any race-sex differences. Formal tests for interaction were performed using interaction terms between race or sex and SBP category in age-adjusted models. We performed the following sensitivity analyses: (1) adjusting for antihypertensive treatment as a time-varying covariate; (2) adjusting for DBP as a time-varying covariate; (3) censoring cardiovascular event follow-up at the year 2000, since the BP control period for which we had data was for 9 years following baseline, whereas follow-up for incident cardiovascular events was for 20 years; and (4) comparing outcome events among those with an SBP from 140 to 159 mm Hg vs those with an SBP of 160 mm Hg or higher. Two-sided P values <.05 were considered significant. SAS software, version 9.3.4 (SAS Institute Inc) was used for all analyses.
Results
At baseline, the cohort of 4408 participants with HTN was relatively young, had a high prevalence of being overweight, and almost three-quarters were taking antihypertensive medication. Almost one-fifth of the cohort had diabetes, and two-thirds of the cohort had some smoking or alcohol history. High cholesterol level was prevalent in over 25% of the cohort. Table 1 summarizes participant baseline characteristics according to SBP level categories. Among this cohort of individuals with HTN, 43.7% had elevated SBP (≥140 mm Hg); 33.6% had standard SBP (120–139 mm Hg); and 22.7% had low SBP (<120 mm Hg). Within each category, and across both races, the proportions of participants taking antihypertensive medication at baseline were lowest among those with elevated SBP. Participants in the elevated SBP category tended to be older, were more likely to be male and African American, and were somewhat more likely to have diabetes.
Table 1.
Baseline Characteristics of ARIC Participants With Hypertension Stratified by SBP Categorya
| Characteristic | Total (n = 5466) |
SBPb | Overall P Value | ||||
|---|---|---|---|---|---|---|---|
| Low (n = 1239) |
Standard (n = 1837) |
P Value, Standard vs Lowc | Elevated (n = 2390) |
P Value, Elevated vs Lowc | |||
| Sex | |||||||
| Female | 3054 (55.9) | 740 (59.7) | 1003 (54.6) | .005 | 1311 (54.9) | .005 | .01d |
| Diabetes | 1121 (20.8) | 227 (18.6) | 391 (21.5) | .05 | 503 (21.4) | .05 | .08d |
| Cigarette use | |||||||
| Current | 1326 (24.3) | 338 (27.8) | 399 (21.7) | 589 (24.7) | |||
| Former | 1752 (32.1) | 389 (31.4) | 641 (34.9) | .002 | 722 (30.2) | .07 | .09e |
| Alcohol use | |||||||
| Current | 2599 (47.9) | 563 (45.7) | 889 (48.6) | 1147 (48.5) | |||
| Former | 1146 (21.1) | 291 (23.6) | 393 (21.5) | .23 | 492 (19.5) | .02 | .02e |
| Antihypertensive medication use | 3975 (73.0 | 1232 (99.4) | 1648 (89.8) | <.001 | 1095 (46.1) | <.001 | <.001 |
| High cholesterol | 1536 (28.9) | 342 (28.4) | 504 (28.1) | .85 | 690 (29.7) | .42 | .33d |
| Race | |||||||
| African American | 2348 (43.0) | 489 (39.5) | 774 (42.1) | 1085 (45.4) | |||
| White | 3118 (57.0) | 750 (60.5) | 1063 (57.9) | .14 | 1305 (54.6) | <.001 | <.001d |
| Age, mean (SD) | 55.5 (5.7) | 54.5 (5.7) | 55.2 (5.7) | <.001 | 56.3 (5.5) | <.001 | <.001f |
| BMI, mean (SD) | 29.6 (5.7) | 29.4 (5.7) | 30.0 (5.9) | .01 | 29.2 (6.0) | .51 | .09f |
| SBP, mean (SD) | 135.7 (20.7) | 110.2 (7.5) | 129.0 (5.6) | NA | 154.1 (14.8) | NA | NA |
Abbreviations: ARIC, Atherosclerosis Risk in Communities Study5; BMI, body mass index (calculated as weight in kilograms divided by height in meters squared); NA, not applicable; SBP, systolic blood pressure.
Unless otherwise noted, data are reported as number (percentage) of participants.
Low SBP is defined as lower than 120 mm Hg; standard SBP, 120 to 139 mm Hg; and elevated SBP, 140 mm Hg or higher.
P values comparing standard and elevated with low SBP groups were obtained by the χ2 test for categorical measures and the Wilcoxon rank-sum test for continuous measures.
By Cochran-Armitage trend test.
By Kruskal-Wallis test for trend.
By Spearman ρ test.
After a median follow-up of 21.8 years, a total of 1622 incident composite cardiovascular events had occurred. The age-adjusted IR (AAIR) was lowest among adults with HTN in the low SBP group and progressively higher in the higher SBP categories (Table 2 and Table 3). There were progressively higher IRRs in the elevated SBP group, particularly for those with SBPs higher than 160mm Hg, and in the standard SBP group compared with those in the low SBP group. White participants had significantly higher AAIRs in the elevated and standard SBP groups compared with those in the low SBP group. In men, women, and African Americans, once SBP levels were below 140 mm Hg, a progressively lower SBP was not associated with a lower AAIR of composite events. We found that African Americans had the highest absolute AAIR differential when comparing the highest SBP group (38.6 per 1000 person-years) vs the lowest (28.6 per 1000 person-years), which suggests that African Americans were more likely to have a greater absolute benefit of reduced cardiovascular events from achieving SBP levels below 140 mm Hg than any other group (Table 2 and Table 3). When evaluating each cardiovascular event outcome separately, we found that the elevated SBP group had a higher rate of HF, ischemic stroke, and MI/CHD events compared with the low SBP group. For HF events, the elevated SBP group had a significantly higher IRR than the low SBP group, but the IRR in the standard SBP group was not significantly different. This pattern was similar across race and sex groups. Is-chemic stroke and MI/CHD event IRRs did not appear to vary significantly by SBP category.
Table 2.
Age-Adjusted Cardiovascular Event Incidence Rates and Incidence Rate Ratios by SBP Category,a 1987–2010
| Event Type | Low SBPa | Standard SBPa | ||||||||
|---|---|---|---|---|---|---|---|---|---|---|
| No. | All Events | Person-years | AAIR | IIR [Ref] | No. | All Events | Person-years | AAIR | IIR (95% CI) | |
| Composite | ||||||||||
| Total | 911 | 283 | 16 226 | 24.7 | 1 | 1469 | 518 | 25 027 | 28.7 | 1.16 (1.00–1.34) |
| Male | 354 | 126 | 5953 | 28.5 | 1 | 671 | 257 | 10 726 | 31.9 | 1.12 (0.90–1.39) |
| Female | 557 | 157 | 10 273 | 22.8 | 1 | 798 | 261 | 14 301 | 26.5 | 1.16 (0.95–1.41) |
| African American | 373 | 133 | 6575 | 28.4 | 1 | 645 | 237 | 10 937 | 29.1 | 1.02 (0.82–1.26) |
| White | 538 | 150 | 9651 | 21.8 | 1 | 824 | 281 | 14 090 | 28.8 | 1.32 (1.08–1.61) |
| HF | ||||||||||
| Total | 1028 | 224 | 19 083 | 19.8 | 1 | 1594 | 379 | 28 732 | 20.0 | 1.01 (0.86–1.19) |
| Male | 433 | 110 | 7630 | 24.9 | 1 | 753 | 174 | 12 990 | 19.9 | 0.80 (0.63–1.02) |
| Female | 595 | 114 | 11 452 | 16.5 | 1 | 841 | 205 | 15 743 | 20.1 | 1.22 (0.97–1.54) |
| African American | 398 | 91 | 7407 | 18.4 | 1 | 683 | 170 | 12 259 | 20.6 | 1.12 (0.87–1.45) |
| White | 630 | 133 | 11 675 | 20.8 | 1 | 911 | 209 | 16 473 | 19.9 | 0.96 (0.77–1.19) |
| Stroke | ||||||||||
| Total | 1201 | 111 | 22 451 | 6.8 | 1 | 1792 | 190 | 33 093 | 7.8 | 1.14 (0.90–1.44) |
| Male | 482 | 50 | 8859 | 7.5 | 1 | 816 | 82 | 14 417 | 6.6 | 0.87 (0.61–1.24) |
| Female | 719 | 61 | 13 859 | 6.4 | 1 | 976 | 108 | 18 676 | 8.8 | 1.36 (0.99–1.86) |
| African American | 473 | 56 | 8757 | 8.7 | 1 | 751 | 92 | 13 573 | 8.9 | 1.02 (0.73–1.42) |
| White | 728 | 56 | 13 694 | 5.6 | 1 | 1041 | 98 | 19 520 | 7.2 | 1.27 (0.91–1.77) |
| MI/CHD | ||||||||||
| Total | 1109 | 168 | 20 400 | 11.7 | 1 | 1705 | 284 | 30 594 | 12.4 | 1.07 (0.88–1.30) |
| Male | 408 | 88 | 7076 | 16.7 | 1 | 736 | 145 | 12 498 | 14.2 | 0.85 (0.65–1.11) |
| Female | 701 | 80 | 13 323 | 9.2 | 1 | 969 | 139 | 18 096 | 11.3 | 1.23 (0.93–1.61) |
| African American | 461 | 74 | 8506 | 12.8 | 1 | 738 | 118 | 13 226 | 11.4 | 0.89 (0.66–1.19) |
| White | 648 | 94 | 11 893 | 10.9 | 1 | 967 | 166 | 17 368 | 13.4 | 1.23 (0.96–1.58) |
Abbreviations: AAIR, age-adjusted incidence rate; HF, heart failure; IRR, incidence rate ratio; MI/CHD, combination measure myocardial infarction/coronary heart disease death; Ref, referent; SBP, systolic blood pressure.
Low SBP is defined as lower than 120 mm Hg; standard SBP, 120 to 139 mm Hg.
Table 3.
Age-Adjusted Cardiovascular Event Incidence Rates and Incidence Rate Ratios by SBP Category,a 1987–2010
| Event Type | Elevated SBP 1a | Elevated SBP 2a | ||||||||
|---|---|---|---|---|---|---|---|---|---|---|
| No. | All Events | Person-years | AAIR | IRR (95% CIs)b | No. | All Events | Person-years | AAIR | IRR (95% CIs)b | |
| Composite | ||||||||||
| Total | 1538 | 579 | 25 140 | 28.6 | 1.16 (1.01–1.34) | 490 | 242 | 6717 | 42.7 | 1.73 (1.46–2.05) |
| Male | 681 | 300 | 10 253 | 34.1 | 1.19 (0.97–1.47) | 203 | 104 | 2567 | 52.8 | 1.85 (1.43–2.40) |
| Female | 867 | 279 | 14 887 | 25.1 | 1.10 (0.91–1.34) | 287 | 138 | 4149 | 36.8 | 1.61 (1.28–2.02) |
| African American | 639 | 272 | 9875 | 35.0 | 1.23 (1.00–1.51) | 282 | 136 | 3647 | 43.3 | 1.52 (1.20–1.93) |
| White | 899 | 307 | 15 266 | 25.7 | 1.18 (0.97–1.43) | 208 | 106 | 3071 | 41.8 | 1.92 (1.50–2.46) |
| HF | ||||||||||
| Total | 1637 | 447 | 28 493 | 22.4 | 1.14 (0.97–1.34) | 541 | 182 | 7960 | 29.5 | 1.49 (1.23–1.81) |
| Male | 755 | 239 | 12 990 | 26.9 | 1.08 (0.86–1.35) | 234 | 83 | 3189 | 35.7 | 1.44 (1.08–1.92) |
| Female | 882 | 208 | 16 183 | 18.9 | 1.15 (0.92–1.45) | 307 | 99 | 4771 | 25.4 | 1.54 (1.18–2.02) |
| African American | 669 | 199 | 10 985 | 26.4 | 1.43 (1.12–1.83) | 311 | 101 | 4304 | 28.9 | 1.57 (1.18–2.08) |
| White | 968 | 248 | 17 509 | 21.0 | 1.01 (0.82–1.25) | 230 | 81 | 3656 | 30.0 | 1.44 (1.09–1.90) |
| Stroke | ||||||||||
| Total | 1752 | 201 | 31 132 | 7.17 | 1.05 (0.83–1.32) | 574 | 106 | 8676 | 12.75 | 1.87 (1.43–2.44) |
| Male | 801 | 104 | 13 404 | 7.69 | 1.02 (0.73–1.43) | 245 | 44 | 3429 | 14.3 | 1.90 (1.27–2.85) |
| Female | 951 | 97 | 17 727 | 6.9 | 1.08 (0.78–1.49) | 329 | 62 | 5247 | 11.4 | 1.83 (1.28–2.61) |
| African American | 717 | 107 | 11 879 | 9.54 | 1.10 (0.80–1.52) | 336 | 70 | 4768 | 14.2 | 1.63 (1.15–2.32) |
| White | 1035 | 94 | 19 253 | 6.18 | 1.09 (0.78–1.52) | 238 | 36 | 3908 | 11.46 | 2.03 (1.33–3.09) |
| MI/CHD | ||||||||||
| Total | 1698 | 292 | 29 419 | 11.6 | 0.99 (0.82–1.20) | 557 | 119 | 8319 | 16.5 | 1.41 (1.12–1.78) |
| Male | 753 | 165 | 12 169 | 14.8 | 0.88 (0.68–1.14) | 227 | 58 | 3219 | 25.6 | 1.53 (1.10–2.13) |
| Female | 945 | 127 | 17 250 | 9.5 | 1.03 (0.78–1.36) | 330 | 61 | 5100 | 10.9 | 1.18 (0.85–1.65) |
| African American | 700 | 121 | 11 690 | 12.8 | 1.00 (0.74–1.34) | 329 | 67 | 4693 | 17.2 | 1.35 (0.97–1.88) |
| White | 998 | 171 | 17 728 | 10.9 | 1.00 (0.78–1.29) | 228 | 52 | 3625 | 15.8 | 1.45 (1.03–2.04) |
Abbreviations: AAIR, age-adjusted incidence rate; HF, heart failure; IRR, incidence rate ratio; MI/CHD, myocardial infarction/coronary heart disease death; SBP, systolic blood pressure.
Elevated SBP 1 is defined as 140 to 159 mm Hg; Elevated SBP 2, 160 mm Hg or higher.
Compared with low SBP (see Table 2).
The unadjusted HRs of incident composite events were highest among those with elevated SBP (HR, 1.42; 95% CI, 1.23–1.65) compared with those in the low SBP group. The standard SBP group was not significantly different from the low SBP group in risk for incident cardiovascular events. This relationship remained unchanged after adjustments for age, sex, BMI, high cholesterol level, smoking status, alcohol intake, and diabetes. Cox proportional hazards models showed a 46% increased risk for incident composite events (HF, ischemic stroke, or MI/CHD) in the elevated SBP vs the low SBP group (HR, 1.46; 95% CI, 1.26–1.69). There was no difference in incident cardiovascular event-free survival among those in the standard vs the low SBP groups (HR, 1.00; 95% CI, 0.85–1.17) (Figure 1A). This pattern persisted when we evaluated HF, MI/CHD, and is-chemic stroke outcome events separately (Figure 1B–D). Unadjusted Kaplan-Meier curves (Figure 2A) illustrate worse cardiovascular event-free survival among participants with HTN in the highest SBP group compared with those in the lowest SBP group (log rank P < .001) and compared with those in the standard SBP group (log rank P = .01). However, this pattern did not persist when we looked at HF, MI/CHD, or ischemic stroke outcome events separately. The standard SBP group did not fare worse than the low SBP group (log rank P > .50) for any outcome (Figure 2B–D). In minimally and fully adjusted Cox proportional hazards models, the direct relationship between SBP level and incident composite events was similar for both men and women (P≥.50 for interaction). However, there was a significant effect by race (P = .02 for interaction), signaling a higher risk of cardiovascular events from elevated SBP among African Americans (HR, 1.66; 95% CI, 1.33–2.07) than among whites (HR, 1.26; 95% CI, 1.04–1.54) (Figure 1). Further adjustment for BP medication use, DBP, or censoring cardiovascular event follow-up at year 2000 did not significantly affect the results (data not shown). Crude rates of MI/CHD, HF, or ischemic stroke stratified by SBP at 140 to 159 mm Hg and 160 mm Hg or higher suggested an increase in incident cardiovascular events mostly in the 160 mm Hg or higher group (eTable 2 in the Supplement). This pattern was not supported in multivariate models with SBP as a time-varying covariate, where significantly more composite events were seen in both the SBP 140 to 159 mm Hg and 160 mm Hg or higher groups compared with the low SBP and the standard SBP groups (eFigure, A, in the Supplement).
Figure 1. Adjusted Hazard Ratios (HRs) of Incident Cardiovascular Events by Time-Varying Systolic Blood Pressure (SBP) Level Category Among Participants With Hypertension.
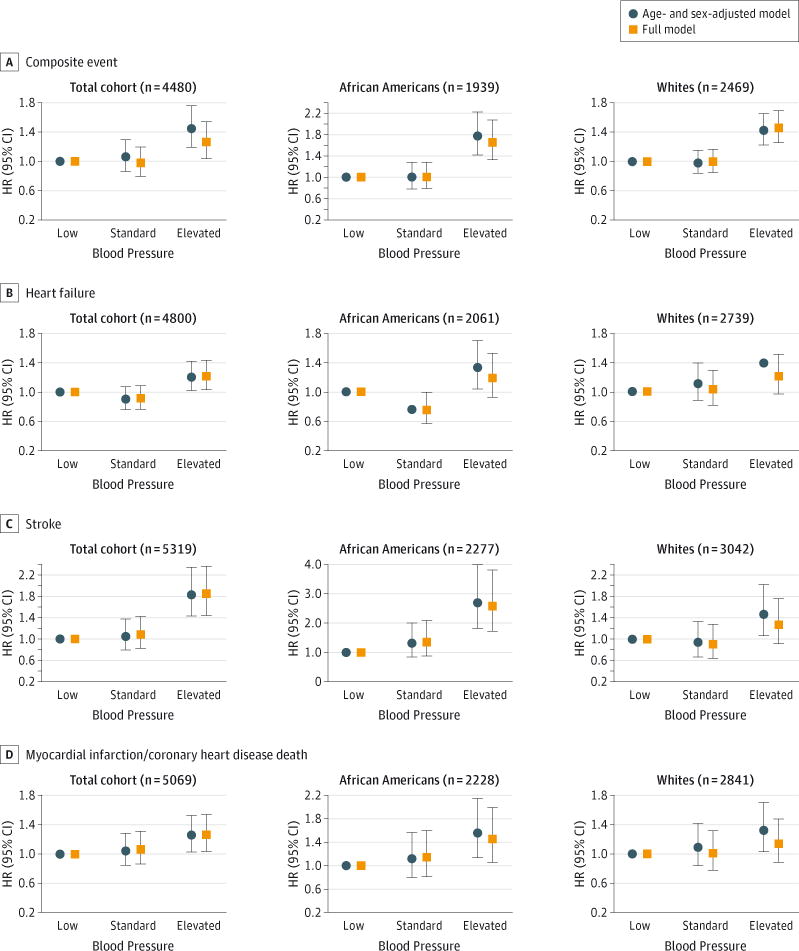
The Atherosclerosis Risk in Communities Study5 (1987–2010) stratified by composite event (heart failure, ischemic stroke, or combination measure myocardial infarction/incidence of coronary heart disease death [MI/CHD]) (A), heart failure (B), ischemic stroke (C), and MI/CHD (D). Elevated BP is defined as an SBP of 140 mm Hg or higher; standard BP, an SBP of 120 to 139 mm Hg; and low BP, an SBP of lower than 120 mm Hg. The vertical lines through the HRs represent 95% CIs.
Figure 2. Unadjusted Cardiovascular Event-Free Survival Among Participants With Hypertension by Systolic Blood Pressure (SBP) Category.
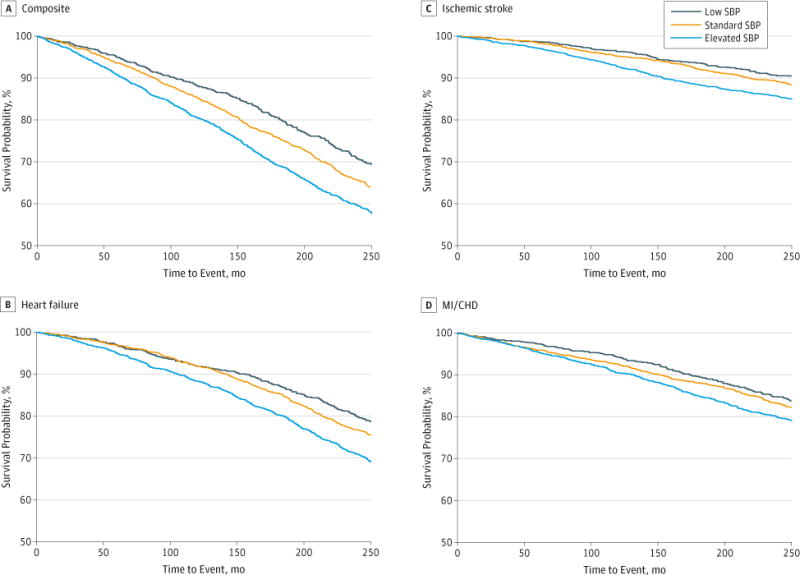
The Atherosclerosis Risk in Communities Study5 (1987–2010) stratified by composite event (heart failure, ischemic stroke, or combination measure myocardial infarction/incidence of coronary heart disease death [MI/CHD]) (A), heart failure (B), ischemic stroke (C), and MI/CHD (D). Elevated BP is defined as an SBP of 140 mm Hg or higher; standard BP, an SBP of 120 to 139 mm Hg; and low BP, an SBP of lower than 120 mm Hg.
Discussion
In this large, biracial, community-based cohort of men and women with HTN and long-term follow-up that addresses the time-varying nature of BP, we show that elevated BP among adults with HTN is an important risk factor for cardiovascular events (HF, stroke, and MI/CHD) regardless of race and sex. We expected to see a significantly higher cardiovascular event-free survival among participants with HTN with progressively lower BP levels, but the relationship seen was not graded. Among participants with HTN, having elevated BP carries the highest risk for cardiovascular events, but in this categorical analysis we observed no overall risk difference between the standard (SBP, 120–139 mm Hg) and low (SBP, <120 mm Hg) SBP groups. Although our results reinforce that control of elevated BP is beneficial to prevent incident cardiovascular events, our results suggest that once SBP is controlled below 140 mm Hg, an SBP below 120 mm Hg does not appear to provide additional benefit in terms of preventing incident cardiovascular events. Furthermore, to our knowledge, this study provides the most information of this kind for African Americans, a population that manifests a heavy burden of HTN associated morbidity and mortality.11 Our results show that African Americans achieve a greater absolute benefit than whites in reduced incident cardiovascular events when elevated SBP is controlled.
According to a study of the NHANES population (National Health and Nutrition Examination Survey),12 nearly 20% of all hypertensive individuals in the United States are unaware of their condition, and more than 30% are not being treated. In addition, 49.9% of adults with high BP did not have their HTN controlled at the target of lower than <140 mm Hg as set out by JNC-7.12 This is due to many factors, including possible reluctance of physicians to achieve such goals, defined as clinical inertia, or perhaps lack of acceptance of aggressive therapy by patients as well.13,14
It should be noted that for the present study, the concept of control among adults with HTN was based solely on the participant’s BP, not on how much or what particular treatment they were undergoing. For example, the BP of some participants might have been controlled with lifestyle modifications alone or with only 1 medication, while others taking multiple medications or none at all might have had uncontrolled BP. Similarly, a person with an SBP of 140 mm Hg or higher is at increased cardiovascular risk whether taking antihypertensive medications or not, based simply on the BP. Nevertheless, our results do not support the notion that SBP control to lower than 120 mm Hg is better. Elevated BP is undoubtedly a risk factor for cardiovascular events, but standard BP control appears to be just as good as lower BP control in preventing HF, ischemic stroke, and MI/CHD. These results are potentially important, since treatment to a lower BP may have adverse consequences such as orthostatic hypotension, medication adverse effects, and increased health care costs.15,16
A large meta-analysis of 61 cohort studies targeting 1 million participants including those with and without HTN demonstrated that cardiovascular morbidity and mortality decreased as the SBP decreased from 180 mm Hg to 115 mm Hg.3 Since then, the principle “the lower, the better” has been widely accepted. The contribution of elevated BP to the risk for developing cardiovascular events such as HF, MI, and stroke is substantial.17–20 Several clinical trials have demonstrated that treatment of an elevated SBP of 140 mm Hg or higher de creases the risk for cardiovascular events.21–27 However, although this evidence is very consistent for SBPs lower than 150 mm Hg, the benefit in preventing cardiovascular events among patients with HTN with SBPs lower than 120 mm Hg is unknown. Adequate control of elevated BP provides the earliest opportunity to prevent cardiovascular events.2,28 This notion is emphasized by the results of our study. However, the belief that intensifying antihypertensive treatment in patients with an SBP of 130 to 140 mm Hg offers any extra cardiovascular benefit has come into question.
To our knowledge no studies have assessed the incidence of HF, ischemic stroke, and MI/CHD with SBP control categories among a population-based cohort of patients with HTN. In the Framingham Heart Study,29 higher levels of BP were associated with risk of HF; however this study did not look exclusively at patients with HTN, did not categorize BP according to levels of BP control, and did not treat BP as a time-varying measure. The United Kingdom Prospective Diabetes Study30 compared tight BP control (<150/85 mm Hg) with less tight control (<180/105 mm Hg) in 1148 patients with HTN and diabetes. The group assigned to tight BP control had a 56% decreased risk of incident HF, a nonsignificant 21% reduction in risk of MI, and a 44% reduction in risk of stroke compared with the group assigned to less tight BP control. The recent randomized controlled trial, the Action to Control Cardiovascular Risk in Diabetes,31 showed no significant difference in cardiovascular events between the intensive BP-lowering group, with a target SBP below 120 mm Hg, and the standard treatment group, with a target SBP below 140 mm Hg. The recent JNC-8 report2 reinforces the 140/90 mm Hg or higher threshold for individuals younger than 60 years, citing a lack of evidence for increased cardiovascular risk at lower BP thresholds. Our results show that patients with HTN and SBPs below 120 mm Hg do not appear to have a lower risk of incident cardiovascular events than those with SBPs of 120 to 139 mm Hg. Furthermore, some have suggested that mild hypertension (SBP, 140–159 mm Hg) does not confer significantly higher risk of cardiovascular events.32 However, our results show an increased risk for cardiovascular event for mild hypertension as well as for moderate to severe hypertension (SBP, >160 mm Hg). This also supports the JNC-8 treatment threshold of an SBP of 140 mm Hg or higher.
One possible reason for our observed results is the so-called J-curve phenomenon, which describes a relationship between treatment to low BP levels and increased cardiovascular complications.33 Secondary analysis from recent large clinical outcomes trials have observed a J-curve effect between a DBP of 70 to 80 mm Hg as well as an SBP lower than 130 mm Hg.34,35 This effect does not seem to appear in the absence of known obstructive CHD,33 presumably because the coronary arteries are perfused during diastole, but may be more pronounced in patients with HTN. However, the J-curve phenomenon remains controversial and has not been consistently shown. Examples are the Systolic Hypertension in the Elderly Program study36 and the Syst-Eur study,37 where no increase in myocardial ischemia or cardiovascular disease risk was shown at a DBP of 55 to 60 mm Hg. According to the Cardiovascular Health Study38 the BP level and cardiovascular risk showed a linear relationship, and a J-curve was not observed. The Physicians’ Health Study and Women’s Health Study39 observed 22 071 men and 39 876 women for a median of 13.0 years and 6.2 years, respectively, and found a linear association of SBP and DBP with the risk of MI, stroke, coronary artery bypass graft, angioplasty, and cardiovascular death without any evidence of a J-curve relationship.
Our study has some limitations. First, HF was based on hospital discharge ICD codes and not validated by physician review of medical records. Although HF diagnosis codes have been demonstrated to have high validity in ARIC,7 the true incidence of HF may be underestimated. Second, our study was observational, so despite a consistent statistical association, we cannot establish causality or account for unmeasured confounders not modeled in this study. We therefore await results from ongoing randomized clinical trials, such as the Systolic Blood Pressure Intervention Trial (SPRINT) sponsored by the National Heart, Lung, and Blood Institute (NHLBI), to help determine whether lowering SBP levels among patients with HTN has the potential to reduce cardiovascular events. Finally, the BP control period for which we had data was 9 years following baseline, whereas follow-up was for 20 years. It is likely that BP control for the final 11 years changed, and therefore some participants were misclassified prior to cardiovascular event diagnosis. However, our sensitivity analysis, ending follow-up at year 2000, showed similar results.
Conclusions
We show in a large, biracial, community-based cohort of un-selected individuals with HTN that those with an SBP lower than 120 mm Hg do not have reduced longitudinal risk of developing incident HF, ischemic stroke, or MI/CHD compared with individuals with HTN who have an SBP of 120 to 139 mm Hg. Thus, for controlling cardiovascular risk, a treatment goal of 120 to 139 mm Hg may be acceptable among most patients with HTN. Further studies are needed to support this conclusion, including the eventual results of the NHLBI SPRINT trial.
Supplementary Material
Acknowledgments
Funding/Support: This study was supported in part by National Institutes of Health National Heart, Lung, and Blood Institute (NHLBI) grant R01 HL104199 (Epidemiologic Determinants of Cardiac Structure and Function among Hispanics, Carlos J. Rodriguez, MD, MPH principal investigator). The ARIC Study is carried out as a collaborative study supported by NHLBI contracts HHSN268201100005C, HHSN268201100006C, HHSN268201100007C, HHSN268201100008C, HHSN268201100009C, HHSN268201100010C, HHSN268201100011C, and HHSN268201100012C. Dr Rodriguez is also partially supported by the SPRINT clinical trial, NHLBI grant HHSN268200900048C.
Role of the Sponsors: The funders had no role in the design and conduct of the study; collection, management, analysis, and interpretation of the data; preparation, review, or approval of the manuscript; and decision to submit the manuscript for publication.
Footnotes
Author Contributions: Dr Rodriguez had full access to all the data in the study and takes responsibility for the integrity of the data and the accuracy of the data analysis.
Study concept and design: Rodriguez, Agarwal, Loehr, Ni, Rosamond, Chang.
Acquisition, analysis, or interpretation of data: Rodriguez, Swett, Agarwal, Folsom, Fox, Loehr, Ni, Rosamond, Chang.
Drafting of the manuscript: Rodriguez, Swett, Agarwal, Loehr.
Critical revision of the manuscript for important intellectual content: Rodriguez, Agarwal, Folsom, Fox, Loehr, Ni, Rosamond, Chang.
Statistical analysis: Swett, Agarwal, Loehr.
Obtained funding: Folsom, Ni.
Administrative, technical, or material support: Ni.
Study supervision: Rodriguez, Fox, Loehr, Rosamond.
Conflict of Interest Disclosures: None reported.
Previous Presentation: This research was presented in part at the American Heart Association’s Epidemiology and Prevention/Physical Activity, Nutrition and Metabolism 2013 Scientific Sessions; March 26, 2013; New Orleans, Louisiana.
Additional Contributions: The authors thank the staff and participants of the ARIC study for their important contributions. No contributors to this study received compensation for their contributions beyond that provided in the normal course of their employment.
Correction: This article was corrected online July 3, 2014, for omitted author funding information in the Funding/Support section and on July 7, 2014, for a data error in Table 3.
Contributor Information
Carlos J. Rodriguez, Department of Medicine and Public Health Sciences, Wake Forest University School of Medicine, Winston-Salem, North Carolina.
Katrina Swett, Department of Medicine and Public Health Sciences, Wake Forest University School of Medicine, Winston-Salem, North Carolina.
Sunil K. Agarwal, Department of Medicine and Epidemiology, Johns Hopkins University, Baltimore, Maryland.
Aaron R. Folsom, Division of Epidemiology and Community Health, University of Minnesota, Minneapolis.
Ervin R. Fox, Department of Medicine, University of Mississippi Medical Center, Jackson.
Laura R. Loehr, Department of Medicine and Epidemiology, University of North Carolina at Chapel Hill.
Hanyu Ni, National Heart, Lung, and Blood Institute, Bethesda, Maryland.
Wayne D. Rosamond, Department of Medicine and Epidemiology, University of North Carolina at Chapel Hill.
Patricia P. Chang, Department of Medicine and Epidemiology, University of North Carolina at Chapel Hill.
References
- 1.Go AS, Mozaffarian D, Roger VL, et al. American Heart Association Statistics Committee and Stroke Statistics Subcommittee Heart disease and stroke statistics–2013 update: a report from the American Heart Association. Circulation. 2013;127(1):e6–e245. doi: 10.1161/CIR.0b013e31828124ad. [DOI] [PMC free article] [PubMed] [Google Scholar]
- 2.James PA, Oparil S, Carter BL, et al. 2014 evidence-based guideline for the management of high blood pressure in adults: report from the panel members appointed to the Eighth Joint National Committee (JNC-8) JAMA. 2014;311(5):507–520. doi: 10.1001/jama.2013.284427. [DOI] [PubMed] [Google Scholar]
- 3.Lewington S, Clarke R, Qizilbash N, Peto R, Collins R, Prospective Studies Collaboration Age-specific relevance of usual blood pressure to vascular mortality: a meta-analysis of individual data for one million adults in 61 prospective studies. Lancet. 2002;360(9349):1903–1913. doi: 10.1016/s0140-6736(02)11911-8. [DOI] [PubMed] [Google Scholar]
- 4.Lawes CM, Vander Hoorn S, Rodgers A, International Society of Hypertension Global burden of blood-pressure-related disease, 2001. Lancet. 2008;371(9623):1513–1518. doi: 10.1016/S0140-6736(08)60655-8. [DOI] [PubMed] [Google Scholar]
- 5.The ARIC Investigators. The Atherosclerosis Risk in Communities (ARIC) Study: design and objectives. Am J Epidemiol. 1989;129(4):687–702. [PubMed] [Google Scholar]
- 6.Douglas JG, Bakris GL, Epstein M, et al. Hypertension in African Americans Working Group of the International Society on Hypertension in Blacks Management of high blood pressure in African Americans: consensus statement of the Hypertension in African Americans Working Group of the International Society on Hypertension in Blacks. Arch Intern Med. 2003;163(5):525–541. doi: 10.1001/archinte.163.5.525. [DOI] [PubMed] [Google Scholar]
- 7.Loehr LR, Rosamond WD, Chang PP, Folsom AR, Chambless LE. Heart failure incidence and survival (from the Atherosclerosis Risk in Communities Study) Am J Cardiol. 2008;101(7):1016–1022. doi: 10.1016/j.amjcard.2007.11.061. [DOI] [PubMed] [Google Scholar]
- 8.White AD, Folsom AR, Chambless LE, et al. Community surveillance of coronary heart disease in the Atherosclerosis Risk in Communities (ARIC) Study: methods and initial two years’ experience. J Clin Epidemiol. 1996;49(2):223–233. doi: 10.1016/0895-4356(95)00041-0. [DOI] [PubMed] [Google Scholar]
- 9.Rosamond WD, Folsom AR, Chambless LE, et al. Stroke incidence and survival among middle-aged adults: 9-year follow-up of the Atherosclerosis Risk in Communities (ARIC) cohort. Stroke. 1999;30(4):736–743. doi: 10.1161/01.str.30.4.736. [DOI] [PubMed] [Google Scholar]
- 10.Eriksson H, Caidahl K, Larsson B, et al. Cardiac and pulmonary causes of dyspnoea–validation of a scoring test for clinical-epidemiological use: the Study of Men Born in 1913. Eur Heart J. 1987;8(9):1007–1014. doi: 10.1093/oxfordjournals.eurheartj.a062365. [DOI] [PubMed] [Google Scholar]
- 11.Flack JM, Sica DA, Bakris G, et al. International Society on Hypertension in Blacks Management of high blood pressure in Blacks: an update of the International Society on Hypertension in Blacks consensus statement. Hypertension. 2010;56(5):780–800. doi: 10.1161/HYPERTENSIONAHA.110.152892. [DOI] [PubMed] [Google Scholar]
- 12.Egan BM, Zhao Y, Axon RN. US trends in prevalence, awareness, treatment, and control of hypertension, 1988–2008. JAMA. 2010;303(20):2043–2050. doi: 10.1001/jama.2010.650. [DOI] [PubMed] [Google Scholar]
- 13.Hyman DJ, Pavlik VN. Characteristics of patients with uncontrolled hypertension in the United States. N Engl J Med. 2001;345(7):479–486. doi: 10.1056/NEJMoa010273. [DOI] [PubMed] [Google Scholar]
- 14.Lloyd-Jones DM, Evans JC, Larson MG, O’Donnell CJ, Roccella EJ, Levy D. Differential control of systolic and diastolic blood pressure: factors associated with lack of blood pressure control in the community. Hypertension. 2000;36(4):594–599. doi: 10.1161/01.hyp.36.4.594. [DOI] [PubMed] [Google Scholar]
- 15.Jönsson B, Hansson L, Stålhammar NO. Health economics in the Hypertension Optimal Treatment (HOT) study: costs and cost-effectiveness of intensive blood pressure lowering and low-dose aspirin in patients with hypertension. J Intern Med. 2003;253(4):472–480. doi: 10.1046/j.1365-2796.2003.01135.x. [DOI] [PubMed] [Google Scholar]
- 16.Lamy PP. Potential adverse effects of antihypertensive drugs in the elderly. J Hypertens Suppl. 1988;6(1):S81–S85. [PubMed] [Google Scholar]
- 17.Levy D, Larson MG, Vasan RS, Kannel WB, Ho KK. The progression from hypertension to congestive heart failure. JAMA. 1996;275(20):1557–1562. [PubMed] [Google Scholar]
- 18.MacMahon S, Peto R, Cutler J, et al. Blood pressure, stroke, and coronary heart disease, part 1: prolonged differences in blood pressure: prospective observational studies corrected for the regression dilution bias. Lancet. 1990;335(8692):765–774. doi: 10.1016/0140-6736(90)90878-9. [DOI] [PubMed] [Google Scholar]
- 19.Vasan RS, Larson MG, Leip EP, et al. Impact of high-normal blood pressure on the risk of cardiovascular disease. N Engl J Med. 2001;345(18):1291–1297. doi: 10.1056/NEJMoa003417. [DOI] [PubMed] [Google Scholar]
- 20.Sacco RL, Boden-Albala B, Abel G, et al. Race-ethnic disparities in the impact of stroke risk factors: the northern Manhattan stroke study. Stroke. 2001;32(8):1725–1731. doi: 10.1161/01.str.32.8.1725. [DOI] [PubMed] [Google Scholar]
- 21.Kostis JB, Davis BR, Cutler J, et al. SHEP Cooperative Research Group Prevention of heart failure by antihypertensive drug treatment in older persons with isolated systolic hypertension. JAMA. 1997;278(3):212–216. [PubMed] [Google Scholar]
- 22.Moser M, Hebert PR. Prevention of disease progression, left ventricular hypertrophy and congestive heart failure in hypertension treatment trials. J Am Coll Cardiol. 1996;27(5):1214–1218. doi: 10.1016/0735-1097(95)00606-0. [DOI] [PubMed] [Google Scholar]
- 23.Liu L, Wang JG, Gong L, Liu G, Staessen JA, Systolic Hypertension in China (Syst-China) Collaborative Group Comparison of active treatment and placebo in older Chinese patients with isolated systolic hypertension. J Hypertens. 1998;16(12 Pt 1):1823–1829. doi: 10.1097/00004872-199816120-00016. [DOI] [PubMed] [Google Scholar]
- 24.Dahlöf B, Lindholm LH, Hansson L, Scherstén B, Ekbom T, Wester PO. Morbidity and mortality in the Swedish Trial in Old Patients with Hypertension (STOP-Hypertension) Lancet. 1991;338(8778):1281–1285. doi: 10.1016/0140-6736(91)92589-t. [DOI] [PubMed] [Google Scholar]
- 25.Psaty BM, Smith NL, Siscovick DS, et al. Health outcomes associated with antihypertensive therapies used as first-line agents: a systematic review and meta-analysis. JAMA. 1997;277(9):739–745. [PubMed] [Google Scholar]
- 26.SHEP Cooperative Research Group. Prevention of stroke by antihypertensive drug treatment in older persons with isolated systolic hypertension: final results of the Systolic Hypertension in the Elderly Program (SHEP) JAMA. 1991;265(24):3255–3264. [PubMed] [Google Scholar]
- 27.Neal B, MacMahon S, Chapman N, Blood Pressure Lowering Treatment Trialists’ Collaboration Effects of ACE inhibitors, calcium antagonists, and other blood-pressure-lowering drugs: results of prospectively designed overviews of randomised trials. Lancet. 2000;356(9246):1955–1964. doi: 10.1016/s0140-6736(00)03307-9. [DOI] [PubMed] [Google Scholar]
- 28.Schocken DD, Benjamin EJ, Fonarow GC, et al. American Heart Association Council on Epidemiology and Prevention; American Heart Association Council on Clinical Cardiology; American Heart Association Council on Cardiovascular Nursing; American Heart Association Council on High Blood Pressure Research; Quality of Care and Outcomes Research Interdisciplinary Working Group; Functional Genomics and Translational Biology Interdisciplinary Working Group Prevention of heart failure: a scientific statement from the American Heart Association Councils on Epidemiology and Prevention, Clinical Cardiology, Cardiovascular Nursing, and High Blood Pressure Research; Quality of Care and Outcomes Research Interdisciplinary Working Group; and Functional Genomics and Translational Biology Interdisciplinary Working Group. Circulation. 2008;117(19):2544–2565. doi: 10.1161/CIRCULATIONAHA.107.188965. [DOI] [PubMed] [Google Scholar]
- 29.Haider AW, Larson MG, Franklin SS, Levy D, Framingham Heart Study Systolic blood pressure, diastolic blood pressure, and pulse pressure as predictors of risk for congestive heart failure in the Framingham Heart Study. Ann Intern Med. 2003;138(1):10–16. doi: 10.7326/0003-4819-138-1-200301070-00006. [DOI] [PubMed] [Google Scholar]
- 30.UK Prospective Diabetes Study Group. Tight blood pressure control and risk of macrovascular and microvascular complications in type 2 diabetes: UKPDS 38. BMJ. 1998;317(7160):703–713. [PMC free article] [PubMed] [Google Scholar]
- 31.Cushman WC, Evans GW, Byington RP, et al. ACCORD Study Group Effects of intensive blood-pressure control in type 2 diabetes mellitus. N Engl J Med. 2010;362(17):1575–1585. doi: 10.1056/NEJMoa1001286. [DOI] [PMC free article] [PubMed] [Google Scholar]
- 32.Diao D, Wright JM, Cundiff DK, Gueyffier F. Pharmacotherapy for mild hypertension. Cochrane Database Syst Rev. 2012(8):CD006742. doi: 10.1002/14651858.CD006742.pub2. [DOI] [PMC free article] [PubMed] [Google Scholar]
- 33.Cruickshank JM, Thorp JM, Zacharias FJ. Benefits and potential harm of lowering high blood pressure. Lancet. 1987;1(8533):581–584. doi: 10.1016/s0140-6736(87)90231-5. [DOI] [PubMed] [Google Scholar]
- 34.Haller H, Ito S, Izzo JL, Jr, et al. ROADMAP Trial Investigators Olmesartan for the delay or prevention of microalbuminuria in type 2 diabetes. N Engl J Med. 2011;364(10):907–917. doi: 10.1056/NEJMoa1007994. [DOI] [PubMed] [Google Scholar]
- 35.Bangalore S, Messerli FH, Wun CC, et al. Treating to New Targets Steering Committee and Investigators J-curve revisited: an analysis of blood pressure and cardiovascular events in the Treating to New Targets (TNT) Trial. Eur Heart J. 2010;31(23):2897–2908. doi: 10.1093/eurheartj/ehq328. [DOI] [PubMed] [Google Scholar]
- 36.Somes GW, Pahor M, Shorr RI, Cushman WC, Applegate WB. The role of diastolic blood pressure when treating isolated systolic hypertension. Arch Intern Med. 1999;159(17):2004–2009. doi: 10.1001/archinte.159.17.2004. [DOI] [PubMed] [Google Scholar]
- 37.Fagard RH, Staessen JA, Thijs L, et al. On-treatment diastolic blood pressure and prognosis in systolic hypertension. Arch Intern Med. 2007;167(17):1884–1891. doi: 10.1001/archinte.167.17.1884. [DOI] [PubMed] [Google Scholar]
- 38.Psaty BM, Furberg CD, Kuller LH, et al. Association between blood pressure level and the risk of myocardial infarction, stroke, and total mortality: the cardiovascular health study. Arch Intern Med. 2001;161(9):1183–1192. doi: 10.1001/archinte.161.9.1183. [DOI] [PubMed] [Google Scholar]
- 39.Glynn RJ, L’Italien GJ, Sesso HD, Jackson EA, Buring JE. Development of predictive models for long-term cardiovascular risk associated with systolic and diastolic blood pressure. Hypertension. 2002;39(1):105–110. doi: 10.1161/hy1201.097199. [DOI] [PubMed] [Google Scholar]
Associated Data
This section collects any data citations, data availability statements, or supplementary materials included in this article.