

Abstract
Background.
Older adults frequently have several chronic health conditions which require multiple medications. We illustrated trends in prescription medication use over 20 years in the United States, and described characteristics of older adults using multiple medications in 2009–2010.
Methods.
Participants included 13,869 adults aged 65 years and older in the National Health & Nutrition Examination Survey (1988–2010). Prescription medication use was verified by medication containers. Potentially inappropriate medications were defined by the 2003 Beers Criteria.
Results.
Between 1988 and 2010 the median number of prescription medications used among adults aged 65 and older doubled from 2 to 4, and the proportion taking ≥5 medications tripled from 12.8% (95% confidence interval: 11.1, 14.8) to 39.0% (35.8, 42.3).These increases were driven, in part, by rising use of cardioprotective and antidepressant medications. Use of potentially inappropriate medications decreased from 28.2% (25.5, 31.0) to 15.1% (13.2, 17.3) between 1988 and 2010. Higher medication use was associated with higher prevalence of functional limitation, activities of daily living limitation, and confusion/memory problems in 2009–2010, although these associations did not remain after adjustment for covariates. In multivariable models, older age, number of chronic conditions, and annual health care visits were associated with increased odds of using both 1–4 and ≥5 medications. Additionally, body mass index, higher income-poverty ratio, former smoking, and non-black non-white race were associated with use of ≥5 medications.
Conclusions.
Prescription medication use increased dramatically among older adults between 1988 and 2010. Contemporary older adults on multiple medications have worse health status compared with those on less medications, and appear to be a vulnerable population.
Key Words: Medication, Cardiovascular, Functional performance, Depression, Public health
Older adults have a high prevalence of multiple chronic health conditions for which multiple medications are typically recommended as treatment (1,2). Consequently multiple medication use, often referred to as polypharmacy, is common in this population (1). Polypharmacy may be problematic for a number of reasons. For example it may increase the risk of using potentially inappropriate medications (PIMs) (3,4), which have been associated with negative effects on long-term physical and cognitive functioning (5). Polypharmacy also results in medication nonadherence (1,6), increased risk of drug duplication, drug–drug interactions (1) and adverse drug reactions (ADRs) (1,6,7), and higher health care costs (6,8,9). Research has also found that medication use may be associated with poor functional status (6), and decreased cognitive capacity (10). Given the rapidly aging population and the potential negative effects of multiple medication use, it is of interest to characterize trends and correlates of polypharmacy in older adults.
A recent National Center for Health Statistics investigation reported that approximately a third of persons over age 60 were on ≥5 prescription medications in 2007–2008 (9). Although other research has examined national trends in polypharmacy among noninstitutionalized U.S. elders, the majority of studies have not included contemporary data (11–13). Additionally, many studies consider older adults as a single group over age 60 or 65, or rely on patient self-report of medication use (9,11). Recent nationally representative estimates of PIM use among community-dwelling older adults are currently unavailable. National rates of PIM prescribing during ambulatory care visits in 1995 and 2000 were estimated at 7.8% (3) but relied on provider report, thus measuring prescribing rather than medication use. Given the association of polypharmacy and PIM use with poor clinical outcomes, more detailed estimates of multiple medication and PIM use are needed.
The present study uses data from the National Health & Nutrition Examination Survey (NHANES) between 1988 and 2010 to examine nationally representative time trends in polypharmacy among noninstitutionalized older adults. Trends across age, sex, and select medication classes including PIMs are investigated. To better understand the current needs of this rapidly growing population, we also describe characteristics of prescription medication users in 2009–2010.
Methods
Study Population
NHANES is a nationally representative survey of the civilian, noninstitutionalized U.S. population, which utilizes a complex multistage probability sampling design. The survey includes in-home interviews, and proxies provide information for individuals who are unable to self-report. The current analysis includes data from NHANESIII (1988–1994) and continuous NHANES (1999–2010), and was restricted to participants aged 65 years and older who completed the interview component: 1988–1991 (N = 2,772), 1991–1994 (N = 2,480), 1999–2000 (N = 1,392), 2001–2002 (N = 1,463), 2003–2004 (N = 1,494), 2005–2006 (N = 1,189), 2007–2008 (N = 1,556), 2009–2010 (N = 1,523).
Medication Use
Prescription medication use in the last 30 days was assessed by self-report and verified by interviewers through examination of medication containers during the in-home interview; this included all medications for which a prescription was needed. With the exception of niacin, potassium, and sodium products, most prescription dietary supplements were excluded. Over-the-counter medications were also excluded, except insulin and pseudoephedrine-containing products. More specific inclusion and exclusion information were described elsewhere (14). Containers were reviewed and medication names were recorded based on their generic equivalents. Medications were also coded and classified according to Lexicon Plus (Cerner Multum, Inc.; updated May 2012), which assigns a therapeutic classification to each drug and each drug ingredient.
Primary medication subcategories of interest included statins, antihypertensives, antidiabetic agents, antidepressants, and PIMs. Ingredient-level coding from Lexicon Plus was used to identify medications containing therapeutic drug classes of interest. Generic medication names were used to identify PIMs. PIM use was defined based on the 2003 Beers List (8), which was the most recent criteria relevant to the NHANES cycles of interest; it was applied to all years to reveal meaningful changes in PIM use that were not simply a by-product of changing guidelines. The Beers List makes some recommendations specific to diagnosis, condition, dose, and duration; medications specific to these recommendations were not included. The list used in the present study is summarized in Supplementary Table S1.
Other Variables
Self-reported demographic information included age, sex, marital status defined as partnered (married or living with a partner) or unpartnered (divorced, widowed, separated or never married), education (less than high school, high school, some college, college graduate or above), race-ethnicity (non-Hispanic white, non-Hispanic black, other), and income-poverty ratio. Income-poverty ratio was calculated by dividing family income by federal poverty guidelines, specific to family size, year, and state. Self-reported history of chronic health conditions included asthma, anemia, arthritis, congestive heart failure, coronary heart disease, myocardial infarction, stroke, chronic obstructive pulmonary disease, thyroid problem, liver condition, cancer excluding nonmelanoma skin cancer, hypertension, hypercholesterolemia, diabetes, and osteoporosis. Average alcoholic drinks per week (none, <1, 1–7, and >7) were computed from self-reported number and frequency of alcoholic beverage consumption during the last year. Additional variables included self-reported smoking status (never, former, current), body mass index, average minutes of daily sedentary activity, private health insurance coverage, usual source(s) of health care, and number of visits to a health care provider (0–3, 4–9, or ≥10 visits) during the past 12 months, excluding overnight hospitalizations.
Activities of daily living (ADLs) include basic self-care tasks necessary for independent living; ADL impairment was defined as answering “much difficulty,” or “unable to do” to one or more of the following questions: “how much difficulty do you have walking from room to room,” “standing up from a chair,” “getting in or out of bed,” “eating,” or “dressing.” Absence of ADL impairment was defined as answering “no difficulty” or “some difficulty.” Functional activities are the building blocks of basic daily physical activities; functional limitation was defined as answering “much difficulty” or “unable to do” to one or more of the following questions: “how much difficulty do you have walking ¼ mile,” “walking up 10 steps,” “stooping, crouching or kneeling,” “lifting or carrying 10 lbs,” “standing 2 hrs,” “sitting 2 hrs,” “reaching overhead,” “grasping small objects,” or “pushing or pulling large objects.” Absence of functional limitation was defined as answering “no difficulty” or “some difficulty.” Presence of confusion or memory problems was defined as answering “yes” to the question “are you limited in any way because of difficulty remembering or because you experience periods of confusion?”
Statistical Analyses
All analyses were conducted with Stata 12.0 (College Station, TX) using survey commands and sample weights to account for complex sampling design and sample person nonresponse. Low levels of item nonresponse (<10%) were considered ignorable, as per NHANES analytic guidelines (15). For NHANES cycles in 1988–1991 and 2009–2010, we calculated prevalence of use for broad medication classes and select subclasses. For each NHANES survey cycle between 1988–2010 we also calculated: (i) median and mean for total number of prescription medications; (ii) proportion taking 0, 1–4, and ≥5 prescription medications; (iii) proportion taking at least one antihypertensive, statin, or antidiabetic, stratified by age; (iv) proportion taking at least one antidepressant, stratified by age and sex; and (v) proportion taking at least one PIM, overall and stratified by age and sex.
To describe the most current correlates of medication use in older adults, remaining analyses were carried out using data from 2009 to 2010. We first described participant characteristics across strata of medication use (0, 1–4, and ≥5 medications), and presented these as weighted percentages or mean with standard deviation. The p value for trend or p value from chi-square test was computed for each characteristic.
We then explored the association of participant characteristics with overall medication use based on multinomial logistic regression. Backward model selection was carried out, forcing in age, sex, and race variables. Other independent variables under consideration included demographic, health and behavioral factors, and health care access and utilization measures listed under “other variables” above; for these covariates, a value of p ≤ .10 was used as the threshold for inclusion in the model.
Results
Based on weighted NHANES survey estimates, the U.S. population of adults aged 65 and older increased from 29.2 million in 1988–1991 to 38.7 million in 2009–2010. The population of adults aged 80 and older grew from 5.8 million to 9.8 million over the same time period. In addition to this growth in population size, older adults are taking more medications. The median number of medications taken by adults over age 65 doubled from 2 to 4 between 1988 and 2010 (Figure 1A). In 1988–1991, 3.7 million, or 12.8% (95% confidence interval: 11.1, 14.8), of adults age 65 and older took ≥5 medications, whereas in 2009–2010 this had expanded to 15.1 million, or 39.0% (35.8, 42.3) (Figure 1B). This rise in use of ≥5 medications was consistent across age and sex strata but was most pronounced in males over age 80; in this population the proportion of persons on ≥5 medications more than quadrupled from 10.9% (7.9, 14.8) to 49.6% (45.2, 54.0) from 1988 to 2010.
Figure 1.
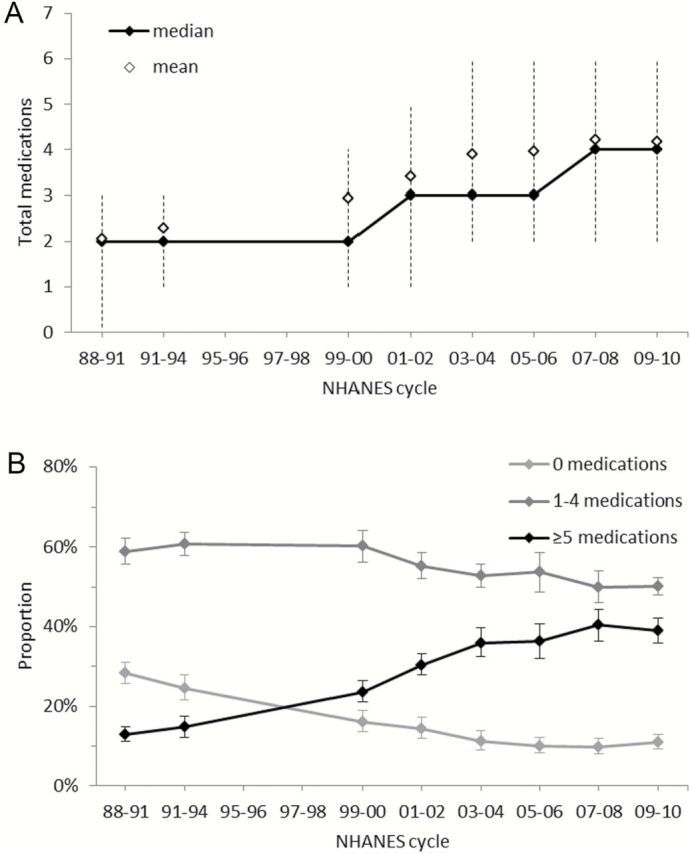
Serial cross-sectional estimates of prescription medication use among U.S. noninstitutionalized adults aged 65 and older (1988–2010) including (A) mean, median, and interquartile range for total number of prescription medications used, and (B) proportion taking 0, 1–4, and ≥5 prescription medications, with 95% confidence intervals.
This increase in medication use among older adults was driven, in part, by higher use of cardioprotective medications (statins, antihypertensives, and antidiabetics). On average, these cardioprotective medications constituted 41.5% of participant prescriptions in 1988–1991 and 52.4% in 2009–2010. Among those aged 65–79 years between 1988 and 2010, there were increases in the proportion of adults on one or more statin (2.0% [1.3, 3.0] to 42.5% [37.5, 47.6]), antihypertensive (44.8% [42.2, 47.4] to 66.1% [61.1, 70.8]), and antidiabetic agent (9.4% [7.4, 11.9] to 19.8% [17.0, 22.9]) (Supplementary Figure S1). Similar increases were seen for those ≥80 years of age for statins (0.09% [0.01, 0.69] to 45.7% [40.2, 51.3]), antihypertensives (50.4% [45.3, 55.5] to 79.0% [76.0, 81.6]), and antidiabetic agents (6.4% [4.9, 8.4] to 16.9% [13.6, 20.8]) (Supplementary Figure S1). Use of antidepressants also increased between 1988 and 2010, and showed a trend of consistently greater use among women over time (Supplementary Figure S2). The largest rise in antidepressant use (3.2% [2.3, 4.5] to 16.5% [12.0, 22.5]) was observed among females aged 65–74 years (Supplementary Figure S2A). Increases in prevalence of use were also observed for other medication classes and subclasses between 1988 and 2010, for example, proton-pump inhibitors (0.09%, [0.01, 0.59] to 18.08% [15.79, 20.61]), thyroid hormones (6.54% [5.21, 8.17] to 16.46% [13.40, 20.06]), bisphosphanates (0.02% [0.00, 0.13] to 6.26% [4.55, 8.56]), and others (Supplementary Table S2).
The proportion of older adults using a potentially inappropriate medication decreased between 1988 and 2010 from 28.2% (25.5, 31.0) to 15.1% (13.2, 17.3) (Supplementary Figure S3A). PIM use fell from 22.5% (19.3, 26.1) in 2003–2004 to 15.1% (13.2, 17.3) in 2009–2010, corresponding to the publication of the updated Beers Criteria in December 2003 (8) (Supplementary Figure S3A). A trend of higher PIM use among women was evident during most of the time period between 1988 and 2010 (Supplementary Figure S3B and C). The largest drop in PIM use was observed for women ≥80, falling from 31.3% (27.5, 35.3) in 1988–1991 to 15.0% (10.0, 22.0) in 2009–2010 (Supplementary Figure S3C).
To better understand current factors associated with medication use, we examined correlates of medication use in 2009–2010. Overall, the proportion of older adults on 0, 1–4, and ≥5 medications was 10.9% (9.2, 12.8), 50.1% (47.9, 52.4), and 39.0% (35.8–42.3), respectively. Compared with those on less medication, persons on more medications were more likely to be older, former smokers, nondrinkers or very light drinkers, more sedentary, and have a higher body mass index. They were also more likely to have a usual source of health care and more health care visits compared with those on less medication. Additionally, persons on more medications were more likely to have a greater number of chronic health conditions, and a greater prevalence of functional limitation, ADL limitation, and confusion/memory problems, compared with those on fewer medications (Table 1).
Table 1.
Characteristics of U.S. Noninstitutionalized Adults Aged 65 and Older (2009–2010), by Medication Use
| Groups of Medication Users | p Value | |||
|---|---|---|---|---|
| 0 Medications (N = 170) | 1–4 Medications (N = 730) | ≥5 Medications (N = 620) | ||
| Age group (y, %) | ||||
| 65–69 | 43.1 | 35.4 | 25.1 | <.001* |
| 70–79 | 43.4 | 40.1 | 45.6 | |
| ≥80 | 13.5 | 24.4 | 29.3 | |
| Sex: female (%) | 48.2 | 56.6 | 56.2 | .238 |
| Married or living with partner (%) | 67.1 | 62.6 | 59.6 | .075 |
| Education (%) | ||||
| Less than high school | 28.3 | 23.0 | 27.9 | .173* |
| High school | 24.2 | 22.7 | 27.1 | |
| Some college | 21.6 | 28.3 | 27.7 | |
| College graduate or above | 25.9 | 26.0 | 17.4 | |
| Race-ethnicity (%) | ||||
| Non-Hispanic white | 78.0 | 81.8 | 78.6 | .438* |
| Non-Hispanic black | 8.1 | 8.0 | 8.8 | |
| Other | 13.9 | 10.2 | 12.6 | |
| Income-poverty ratio—mean ± SD | 2.79±1.58 | 2.98±1.58 | 2.89±1.63 | .998 |
| Smoking status (%) | ||||
| Never | 59.4 | 53.6 | 44.4 | <.001* |
| Former | 27.8 | 38.8 | 49.1 | |
| Current | 12.8 | 7.6 | 6.5 | |
| Alcohol use, drinks/wk (%) | ||||
| None | 45.7 | 40.7 | 52.3 | .020* |
| <1 | 10.9 | 15.0 | 16.1 | |
| 1–7 | 21.8 | 21.6 | 16.5 | |
| >7 | 21.6 | 22.7 | 15.1 | |
| Body mass index (kg/m2)—mean ± SD | 25.73±5.50 | 27.20±5.65 | 29.12±6.42 | <.001 |
| Sedentary activity (min/d)—mean ± SD | 302.6±197.3 | 331.8±178.4 | 379.9±205.0 | .004 |
| Usual health care source(s) (%) | 87.5 | 98.2 | 99.6 | .001 |
| Private health insurance (%) | 54.8 | 64.9 | 58.5 | .671 |
| No. of chronic conditions†—mean ± SD | 1.26±1.43 | 2.51±1.36 | 4.07±1.83 | <.001 |
| No. of health care visits in past year | ||||
| 0–3 | 74.5 | 48.4 | 22.4 | <.001* |
| 4–9 | 23.3 | 35.3 | 42.3 | |
| ≥10 | 2.2 | 16.3 | 35.3 | |
| Any functional limitation‡ (%) | 18.9 | 26.4 | 48.6 | <.001 |
| Any ADL limitation§ (%) | 5.7 | 4.2 | 15.9 | .001 |
| Confusion/memory problems (%) | 8.5 | 7.5 | 15.3 | .001 |
Notes: Values are unweighted sample size, weighted percentages, and weighted means. ADL = activities of daily living.
*p Value from χ2 test; all others are p value for trend.
†Including asthma, anemia, arthritis, congestive heart failure, coronary heart disease, myocardial infarction, stroke, chronic obstructive pulmonary disease, thyroid problem, liver condition, cancer (excluding nonmelanoma skin cancer), hypertension, hypercholesterolemia, diabetes, and osteoporosis.
‡Including walking ¼ mile; walking up 10 steps; stooping, crouching, or kneeling; lifting/carrying 10 lbs; standing for long periods; sitting for long periods; reaching overhead; grasping/holding small objects; pushing/pulling large objects.
§Including walking between rooms on same level; rising from an armless chair; getting in/out of bed; eating and dressing.
In a multivariable model, older age, the presence of more chronic disease, and greater number of health care visits were associated with higher odds of using 1–4 or ≥5 medications, compared with no medications. Persons reporting 10 or more health care visits in the past year had a very high odds of using ≥5 medications, compared with no medications (odds ratio = 17.69 [4.45, 70.26]). Additionally, participants who were former smokers, of non-white, non-black race, with a higher body mass index, and greater income-poverty ratio had higher odds of using ≥5 medications compared with no medications, even after multivariable adjustment (Table 2).
Table 2.
Multinomial Logistic Regression Model for the Association of Participant Characteristics With Medication Usage, Among Those Aged 65 and Older (2009–2010)
| 1–4 Medications | ≥5 Medications | |||
|---|---|---|---|---|
| OR (95% CI) | p Value | OR (95% CI) | p Value | |
| Age (y) | 1.05 (1.01, 1.09) | .017 | 1.10 (1.05, 1.15) | .001 |
| Sex: female | 1.14 (0.76, 1.73) | .499 | 1.02 (0.57, 1.84) | .942 |
| Race*,† | ||||
| Non-Hispanic black | 1.12 (0.53, 2.36) | .749 | 1.14 (0.57, 2.29) | .691 |
| Other | 1.25 (0.75, 2.06) | .366 | 2.00 (1.15, 3.48) | .017 |
| Income-poverty ratio | 1.12 (0.96, 1.31) | .144 | 1.21 (1.00, 1.46) | .052 |
| Smoking status*,‡ | ||||
| Former | 1.45 (0.87, 2.43) | .144 | 2.17 (1.23, 3.81) | .011 |
| Current | 0.89 (0.43, 1.83) | .730 | 1.05 (0.43, 2.53) | .911 |
| Body mass index (kg/m2) | 1.05 (0.99, 1.12) | .121 | 1.10 (1.03, 1.18) | .010 |
| Usual health care source(s) | 2.74 (0.74, 10.22) | .123 | 4.87 (0.74, 32.12) | .094 |
| No. of health care visits, past year*,§ | ||||
| 4–9 | 1.42 (1.03, 1.96) | .034 | 2.50 (1.64, 3.83) | <.001 |
| ≥10 | 6.92 (1.82, 26.38) | .007 | 17.69 (4.45, 70.26) | <.001 |
| No. of chronic diseases | 1.96 (1.40, 2.74) | .001 | 3.66 (2.56, 5.23) | <.001 |
Notes: Backward model selection was conducted, forcing in age, sex, and race. Other variables considered for inclusion were marital status, education, income-poverty ratio, smoking status, alcohol use, body mass index, sedentary activity, usual health care source(s), private health insurance coverage, no. of chronic conditions, no. of health care visits in the past year, functional limitation, limitation in activities of daily living, and confusion/memory problems. The threshold for inclusion was p ≤ .10. CI = confidence interval; OR = odds ratio.
*Wald test for significance of race, p = .033; smoking, p = .146; and no. of health care visits, p = .001.
†Reference = Non-Hispanic white.
‡Reference = never.
§Reference = 0–3.
Discussion
Prescription medication use among older adults in the United States has increased dramatically from 1988 to 2010, and use of ≥5 medications has tripled to nearly 40%. There were substantial increases in cardioprotective and antidepressant medication use during this time period. The proportion of persons on a PIM has decreased since the publication of the updated Beers list for ambulatory older adults in 2003, but remains over 15%. Those on more medications were more likely to have a usual source of health care and more health care visits, compared with those on less medication. They were also more likely to be older, and have worse health status compared with those on less medication, highlighting the vulnerability of this population. Increase in medication use likely represents an increased awareness of disease, as well as availability of treatment, but may have unintended consequences in some older adults.
Our study expands on previous literature that has reported increasing medication use in the adult U.S. population. A study using NHANES data reported 12% and 16% of adults ages 65–74 and 75 or older, respectively, used ≥5 medications during 1988–1994 (12). A similar report stated 36.7% of adults over 60 used ≥5 medications in 2007–2008 (9), although a more detailed description of this population was not included. The Slone survey, a telephone survey of the noninstitutionalized U.S. population, estimated 19% of men and 23% of women over age 65 took ≥5 prescription medications in 1998–1999; however, this was based on participant self-report rather than direct observation of medication containers (11). Recent research also reported 53% of adults ≥65 took ≥4 medications in 2014 (16). Another study conducted in 2005–2006 found use of ≥5 prescription medications was 37.1% among men and 36.0% among women aged 75–85 (13), which is comparable to the overall rate of 36.3% reported for 2005–2006 in our study.
Increases in overall medication use are likely the result of a variety of factors. Implementation of Medicare Part D in 2006 may have contributed to general increases, since it provided prescription drug coverage to Medicare beneficiaries (17). Increased spending on pharmaceutical promotion may also have contributed to overall increases; between 1996 and 2005 total promotional spending rose 10.6% annually, and spending on direct-to-consumer advertising more than quadrupled from $985 million to $4.24 billion (18). The observed rise in use of cardioprotective medications may be due to increasing awareness and treatment of hypertension among older adults between 1988 and 2010 (19,20), as well as the introduction and demonstrated effectiveness of statins. However, whether statins improve health outcomes in all older adults remains controversial. Recent ACC/AHA guidelines recommend statin treatment for secondary prevention among adults over 75, but highlight the lack of evidence for statin use as primary prevention in this population, and one professional group has recommended against routine prescription of statins in adults 70 and older (21,22). Rising use of antidepressants may reflect changing attitudes among the U.S. population about mental health; a recent study that assessed attitudes and beliefs among the U.S. population reported decreasing perceived stigma and increasing willingness to seek treatment for mental health between 1990 and 2003 (23). Increasing antidepressant use may have also been facilitated by the introduction, in 1988, of selective serotonin reuptake inhibitors, which have similar efficacy but better safety and tolerability compared with other antidepressants (24,25). Expanded use of some antidepressants to treat neuropathic pain and anxiety disorders (26) may also partially explain increases. The trend of consistently higher use of antidepressants among women may occur because depression is more prevalent among females, including in late life (27).
Decreased use of PIMs following dissemination of the 2003 updated Beers List provides evidence for the effectiveness of publishing such clinical guidelines. However, over 15% of noninstitutionalized older adults were using a PIM in 2009–2010. This may reflect, in part, the small proportion of older adults in whom these medications are appropriately prescribed. This may also be due to the challenge faced by providers of staying informed of increasingly complex prescribing guidelines. There are more than 60 medications considered potentially inappropriate according to the 2003 Beers List, independent of diagnoses. More than 20 of these medications are new additions that were not included on the previous 1997 version of the list (8).
Rising medication use likely represents increasing awareness and treatment of disease, as well as improved access and availability of drug therapies. This may be largely beneficial; however, prescription medication use is not without risks. Side effects such as reduced alertness, vision, and muscle strength may occur, possibly leading to decreased physical functioning (28). Increased medication use also increases risk of ADRs, and ADRs resulting in hospitalization may lead to other adverse outcomes for older adults (7). In our study, we observed that participants taking more medications were more likely to have a functional limitation, ADL limitation, or confusion/memory problems. This is concerning because older adults with decreased physical and cognitive ability may be more susceptible to the unintended consequences of prescription medication use, including side effects, ADRs, and associated sequelae. Increased susceptibility to side effects and ADRs may also increase the likelihood of prescribing cascades, whereby drug-related symptoms are misdiagnosed as new health problems, and additional drugs are prescribed to address them (2). Such processes increase medication burden in an already vulnerable population.
Interpretation of our findings should consider several limitations. NHANES participation is restricted to noninstitutionalized U.S. persons, thereby excluding older adults who reside in nursing homes or other care facilities. NHANES data is also cross-sectional and therefore lacks information about time-ordering, so no causal interpretation of observed associations can be made. In addition, there may be unmeasured or residual confounding of chronic disease and health status. Furthermore, cognitive function was assessed using only a single measure of reported confusion/memory problems, as other measures of cognition were not available. It should also be noted that medications from the Beers List are only potentially inappropriate, and conclusive judgments about the appropriateness of prescribing could not be made here due to a lack of information about clinical context.
As the U.S. population continues to age, polypharmacy will become an increasingly crucial issue. Considering the risks of polypharmacy, rising prescription medication use is an important public health concern that warrants the attention of clinicians, policymakers, and further research. Many approaches to medication management have been investigated, including clinical decision support systems to guide evidence-based prescribing and involvement of clinical pharmacists in collaborative care. Implementation of methods to manage polypharmacy among the community-dwelling elderly will be critical to the delivery of high quality, safe care in this population.
Supplementary Material
Supplementary material can be found at: http://biomedgerontology.oxfordjournals.org/
Funding
This work was supported by the American Heart Association Western States Affiliate (grant number 11CRP7210088) and the National Institute on Aging (grant number K01AG039387).
Supplementary Material
References
- 1. Hajjar E, Cafiero A, Hanlon J. Polypharmacy in elderly patients. Am J Geriatr Pharmacother. 2007;5:345–351. 10.1016/j.amjopharm. 2007.12.002 [DOI] [PubMed] [Google Scholar]
- 2. Gurwitz JH. Polypharmacy: a new paradigm for quality drug therapy in the elderly? Arch Intern Med. 2004;164:1957–1959. 10.1001/archinte.164.18.1957 [DOI] [PubMed] [Google Scholar]
- 3. Goulding MR. Inappropriate medication prescribing for elderly ambulatory care patients. Arch Intern Med. 2004;164:305–312. 10.1001/archinte.164.3.305 [DOI] [PubMed] [Google Scholar]
- 4. Zhan C, Sangl J, Bierman AS, et al. Potentially inappropriate medication use in the community-dwelling elderly: findings from the 1996 Medical Expenditure Panel Survey. JAMA. 2001;286:2823–2829. 10.1001/jama.286.22.2823 [DOI] [PubMed] [Google Scholar]
- 5. Koyama A, Steinman M, Ensrud K, Hillier TA, Yaffe K. Long-term cognitive and functional effects of potentially inappropriate medications in older women. J Gerontol A Biol Sci Med Sci. 2014;69:423–429. 10.1093/gerona/glt192 [DOI] [PMC free article] [PubMed] [Google Scholar]
- 6. Maher RL, Hanlon J, Hajjar ER. Clinical consequences of polypharmacy in elderly. Expert Opin Drug Saf. 2014;13:57–65. 10.1517/ 14740338.2013.827660 [DOI] [PMC free article] [PubMed] [Google Scholar]
- 7. Hilmer S, Gnjidic D. The effects of polypharmacy in older adults. Clin Pharmacol Ther. 2009;85:86–88. 10.1038/clpt.2008.224 [DOI] [PubMed] [Google Scholar]
- 8. Fick DM, Cooper JW, Wade WE, Waller JL, Maclean JR, Beers MH. Updating the Beers criteria for potentially inappropriate medication use in older adults: results of a US consensus panel of experts. Arch Intern Med. 2003;163:2716–2724. 10.1001/archinte.163.22.2716 [DOI] [PubMed] [Google Scholar]
- 9. Gu Q, Dillon CF, Burt VL.Prescription Drug Use Continues to Increase: US Prescription Drug Data for 2007–2008. Hyattsville, MD: National Center for Health Statistics; 2010. [PubMed] [Google Scholar]
- 10. Jyrkkä J, Enlund H, Lavikainen P, Sulkava R, Hartikainen S. Association of polypharmacy with nutritional status, functional ability and cognitive capacity over a three-year period in an elderly population. Pharmacoepidemiol Drug Saf. 2011;20:514–522. 10.1002/ pds.2116 [DOI] [PubMed] [Google Scholar]
- 11. Kaufman DW, Kelly JP, Rosenberg L, Anderson TE, Mitchell AA. Recent patterns of medication use in the ambulatory adult population of the United States: the Slone survey. JAMA. 2002;287:337–344. 10.1001/jama.287.3.337 [DOI] [PubMed] [Google Scholar]
- 12. CDC. Patterns of Prescription Drug Use in the United States, 1988–94. National Center for Health Statistics. [Google Scholar]
- 13. Qato DM, Alexander GC, Conti RM, Johnson M, Schumm P, Lindau ST. Use of prescription and over-the-counter medications and dietary supplements among older adults in the United States. JAMA. 2008;300:2867–2878. 10.1001/jama.2008.892 [DOI] [PMC free article] [PubMed] [Google Scholar]
- 14. NHANES. 2009–10 Data Documentation, Codebook, and Frequencies: Prescription Medications (RXQ_RX_F), 2012. http://wwwn.cdc.gov/nchs/nhanes/2009–2010/RXQ_RX_F.htm Accessed January 2015.
- 15. Johnson CL, Paulose-Ram R, Ogden CL. NHANES: Analytic Guidelines, 1999–2010. Vital & Health Statistics. 2013;2:6. [PubMed] [Google Scholar]
- 16. Osborn R, Moulds D, Squires D, Doty M, Anderson C. International survey of older adults finds shortcomings in access, coordination, and patient-centered care. Health Aff. 2014;33:2247–2255. 10.1377/hlthaff.2014.0947 [DOI] [PubMed] [Google Scholar]
- 17. Lim D, Jung K, Shi Y. National trends in the use of antidepressants between 1997 and 2009 and the role of Medicare Part D implementation. Psychiatr Serv. 2013;64:1038–1042. 10.1176/appi.ps.201200438 [DOI] [PubMed] [Google Scholar]
- 18. Donohue JM, Cevasco M, Rosenthal MB. A decade of direct-to-consumer advertising of prescription drugs. N Engl J Med. 2007;357:673–681. 10.1056/NEJMsa070502 [DOI] [PubMed] [Google Scholar]
- 19. Bromfield SG, Bowling CB, Tanner RM, et al. Trends in hypertension prevalence, awareness, treatment, and control among US adults 80 years and older, 1988-2010. J Clin Hypertens (Greenwich). 2014;16:270–276. 10.1111/jch.12281 [DOI] [PMC free article] [PubMed] [Google Scholar]
- 20. Egan BM, Zhao Y, Axon RN. US trends in prevalence, awareness, treatment, and control of hypertension, 1988-2008. JAMA. 2010;303:2043–2050. 10.1001/jama.2010.650 [DOI] [PubMed] [Google Scholar]
- 21. Stone NJ, Robinson J, Lichtenstein AH, et al. 2013 ACC/AHA guideline on the treatment of blood cholesterol to reduce atherosclerotic cardiovascular risk in adults: a report of the American College of Cardiology/American Heart Association Task Force on Practice Guidelines. Circulation. November 12, 2013. 10.1161/01.cir.0000437738.63853.7a [Google Scholar]
- 22. AMDA. Choosing Wisely: Five Things Physicians and Patients Should Question. [Google Scholar]
- 23. Mojtabai R. Americans’ attitudes toward mental health treatment seeking: 1990-2003. Psychiatr Serv. 2007;58:642–651. 10.1176/appi.ps.58.5.642 [DOI] [PubMed] [Google Scholar]
- 24. Anderson IM. Selective serotonin reuptake inhibitors versus tricyclic antidepressants: a meta-analysis of efficacy and tolerability. J Affect Disord. 2000;58:19–36. 10.1016/s0165-0327(99)00092-0 [DOI] [PubMed] [Google Scholar]
- 25. Peretti S, Judge R, Hindmarch I. Safety and tolerability considerations: tricyclic antidepressants vs. selective serotonin reuptake inhibitors. Acta Psychiatr Scand Suppl. 2000;403:17–25. 10.1111/j.1600-0447.2000.tb10944.x [DOI] [PubMed] [Google Scholar]
- 26. Chouinard G. The search for new off-label indications for antidepressant, antianxiety, antipsychotic and anticonvulsant drugs. J Psychiatry Neurosci. 2006;31:168–176. [PMC free article] [PubMed] [Google Scholar]
- 27. Luppa M, Sikorski C, Luck T, et al. Age- and gender-specific prevalence of depression in latest-life–systematic review and meta-analysis. J Affect Disord. 2012;136:212–221. 10.1016/j.jad.2010.11.033 [DOI] [PubMed] [Google Scholar]
- 28. Peron EP, Gray SL, Hanlon JT. Medication use and functional status decline in older adults: a narrative review. Am J Geriatr Pharmacother. 2011;9:378–391. 10.1016/j.amjopharm.2011.10.002 [DOI] [PMC free article] [PubMed] [Google Scholar]
Associated Data
This section collects any data citations, data availability statements, or supplementary materials included in this article.