

Abstract
Objective
Having a mother with Major Depressive Disorder (MDD) is one of the strongest predictors of depression in late adolescence and early adulthood. Despite this fact, we know little about the neural mechanisms involved in the intergenerational transmission of risk for depression.
Method
Twenty-eight never-disordered daughters of recurrent depressed mothers (high-risk) and 36 never-disordered daughters of never-depressed mothers (low-risk) were scanned using magnetic resonance imaging. Scan data were processed to provide measurements of cortical gray matter thickness. A General Linear Model was conducted at each surface point to assess the main effect of familial risk on cortical structure as well as to explore the interaction of familial risk and age.
Results
High-risk girls exhibited significantly thinner cortical gray matter in the right fusiform gyrus relative to low-risk girls. Exploratory analyses indicated interactions of risk group and age in the bilateral anterior insula and right anterior cingulate cortex (ACC); whereas low-risk girls exhibited an inverse association between age and cortical thickness, girls at high risk for depression showed the reverse pattern. Additional exploratory analyses, using scores on the Children’s Sadness Management Scale, indicated that thinner gray matter in the ACC of high-risk girls was associated with greater difficulty in managing sadness.
Conclusions
These findings indicate that anomalous reductions in the cortical thickness of the fusiform gyrus may be a marker of risk for MDD. The interaction of age and group for gray matter thickness of the insula and ACC suggests a particularly important role for these regions in risk for depression and warrants additional research in longitudinal studies.
Keywords: depression, risk, anterior cingulate, insula, fusiform, cortical thickness, emotion regulation
Introduction
Major depressive disorder (MDD) is among the most prevalent and burdensome of all psychiatric disorders; nearly 20% of the American population will experience a clinically significant episode of depression in their lifetime (Kessler & Wang, 2009). Not surprisingly given this high prevalence, the World Health Organization has ranked MDD as the single most burdensome disease in the world in terms of years lived with disability among people in the middle years of life (Murray & Lobez, 1996). Given these alarming statistics, efforts to elucidate the factors that are involved in the vulnerability for MDD and in the onset of this disorder are clearly pressing.
Investigations of brain morphometry may help to clarify the role of anomalies in neural structure in the development of MDD. Meta-analyses of chronically ill adults indicate that the most robust structural changes in MDD involve reductions in gray matter in the anterior cingulate cortex (ACC; Bora, Harrison, Davey, Yücel, & Pantelis, 2012; Frodl, Koutsouleris, et al., 2008). This brain region plays a central role in emotion regulation and facilitates interactions between cognitive and emotional functioning (Phillips, Ladouceur, & Drevets, 2008), likely through dense interconnections with both dorsal (i.e., dorsomedial frontal cortex, dorsolateral prefrontal cortex, dorsal ACC, posterior cingulate cortex) and ventral (i.e., subgenual ACC) components of cortico-limbic networks (Mayberg, 1997). Moreover, structural abnormalities in this region and in other brain regions that have been found to be characterized by reduced gray matter in MDD, such as the dorsolateral and orbitofrontal prefrontal cortex (Bora et al., 2012), are more pronounced in individuals who have experienced several depressive episodes (Bora et al., 2012; Frodl et al., 2008). Because ACC and orbitofrontal gray matter reductions have been reported in some studies of drug-naïve individuals who were scanned early in the course of their illness (Pannekoek et al., 2014; van Eijndhoven et al., 2013), it is unlikely that such neural anomalies are a consequence either of medication used to treat depression or of repeated episodes of the disorder. It is noteworthy, however, that findings from other structural neuroimaging studies of younger individuals who are scanned closer to the onset of illness are more variable, with several investigations reporting increases in frontal gray matter in depressed relative to nondepressed participants (Nolan et al., 2002; Qiu et al., 2014; van Eijndhoven et al., 2013). Importantly, areas that show anomalous increases in cortical gray matter in these studies overlap spatially with regions found to show focal gray matter declines in studies of chronically ill adults (e.g., the ACC; van Eijndhoven et al., 2013). Thus, although the extant literature examining brain structure in depression implicates the ACC and specific frontal lobe subregions in the pathophysiology of this disorder, further research is needed to understand whether and how these anomalies change over time.
Much less research has been conducted examining whether these structural abnormalities might precede the onset of MDD. In these studies, which use a variety of ways to conceptualize risk for depression, alterations in cortical gray matter (primarily reductions) have been reported in several adult samples. For example, although the genetic underpinnings of depression are complex, investigators have reported neural anomalies that are associated with risk variants of candidate genes for depression, such as volumetric reductions of ACC gray matter in individuals who carry the short allele of the functional 5′ promoter polymorphism of the serotonin transporter gene (Pezawas et al., 2005), and reductions in gray matter of the fusiform in individuals who have a valine (Val) to methionine (Met) substitution at a single site on the brain-derived neurotrophic (BDNF) gene (Montag, Weber, Fliessbach, Elger, & Reuter, 2009). And, in another examination of adults who are vulnerable to develop MDD by virtue of having a negative cognitive style, a tendency to make global attributions, and a tendency to infer negative self-characteristics and negative consequences in response to adverse life events, focal reductions in cortical gray matter have been observed in the fusiform gyri and in the precentral gyrus (Zhang et al., 2013). Interestingly, Chan, Norbury, Goodwin, & Harmer (2009) also implicated the fusiform gyrus in risk for depression, documenting that higher levels of neuroticism are associated with anomalous activation in this area during the processing of fearful facial expressions. Although it is not clear how structural or functional alterations of this brain area might contribute to a vulnerability for depression, it is tempting to speculate, given a role of this region in the processing of emotional faces (Haxby, Hoffman, & Gobbini, 2000; Kanwisher, McDermott, & Chun, 1997), as well as data demonstrating that biases in the processing of negatively valenced emotional faces are present in both depressed adults and in youth at familial risk for depression (Joormann, Talbot, & Gotlib, 2007), that anomalies in the structure and/or function of this region could underlie increased processing of emotionally salient information in high-risk individuals that in turn contribute to increased vulnerability for the disorder. While future studies are needed to confirm such an association, it is noteworthy that a significant relation between fusiform thickness and performance on an emotional recognition task has already been reported in a study of individuals with autism spectrum conditions (Dziobek, Bahnemann, Convit & Heekeren, 2010).
While these studies in adults are important in demonstrating a role for the ACC in a diagnosis of depression, and to a lesser extent, the ACC, fusiform, precentral and orbitofrontal cortices in a cognitive or single nucleotide polymorphism-based risk for the disorder, a critical challenge that remains largely unexplored involves identifying - in developing youth - structural abnormalities in the brain that are associated with an intergenerational risk for depression. Indeed, although it is well documented that having a mother with MDD is one of the strongest predictors of depression in late adolescence and early adulthood (Weissman et al., 1987), the neural hallmarks of this increased vulnerability in young individuals has not been established. Recent estimates indicate that having a depressed parent is associated with a three- to five-fold increase in the risk to the offspring for developing a depressive episode during adolescence (Gotlib & Colich, 2014). An estimated 40% of children of parents with a clinical mood disorder will experience an episode of depression by young adulthood (Wust, Federenko, Hellhammer, & Kirschbaum, 2000). Maternal depression in particular has been associated with a higher risk for emotional dysfunction in children (Connell & Goodman, 2002), including an earlier age of onset, a more severe course of depression, and greater treatment resistance (Lieb, Isensee, Höfler, Pfister, & Wittchen, 2002). Given the high costs of depression, the difficulty in treating adolescent depression once it occurs, as well as the initial promise of early interventions (Gladstone, Beardslee & O’Connor, 2011), efforts to identify the neurobiological markers associated with parental depression that may in turn act to increase children’s risk for the disorder are clearly pressing.
To date, only two studies have examined whether a family history of MDD is associated with structural anomalies in cortical gray matter. In the first, Peterson et al. (2009) assessed offspring of depressed and nondepressed adults and found that having a parent or grandparent with MDD was associated both with thicker gray matter of the subgenual and orbitofrontal cortex and with thinner gray matter across widespread areas the right hemisphere, including in the dorsolateral and anterior cingulate frontal lobe subregions implicated in previous studies of chronically ill adults (Bora et al., 2012). In the second study, Amico et al (2011) found that never-depressed adults with a first- or second-degree relative with MDD had smaller gray matter volumes of the dorsolateral prefrontal cortex than did adults without a positive family history of depression. Again, as this frontal lobe subregion has been implicated in previous studies of depressed adults, it is tempting to speculate that such anomalies precede the onset of MDD. It is important to note, however, that both Peterson and Amico assessed adults, despite findings that the onset of depression in offspring of depressed parents typically begins in adolescence (Hammen, Brennan, & Keenan-Miller, 2008; Lieb et al., 2002; Weissman et al., 1987). Further, Peterson included adults who had already experienced an episode of depression. Thus, the question of whether cortical gray matter reductions in these studies represent markers of depression vulnerability, of resilience, or alternatively, are a consequence of having been depressed, has not been resolved.
Given these issues, as well the findings reviewed above indicating that the age of participants may have a significant impact on the neuroanatomical characteristics of MDD, the purpose of the current study was to examine whether adolescents at familial risk for depression, but who have never before exhibited clinically significant depressive symptoms, exhibit anomalies in gray matter structure. More specifically, we investigated whether a heightened risk for depression in female offspring of depressed mothers would be associated with abnormalities in cortical thickness, a highly sensitive marker of brain structure (Winkler et al., 2009) that reflects cell number and density (Rajkowska, 2000; Rajkowska et al., 1999). We focused our investigation on never-disordered adolescent daughters of recurrent depressed mothers given evidence both that daughters of depressed parents are more likely to develop depression than are sons (Weissman et al., 1987), and that psychological difficulties in children are associated more strongly with depression in mothers than they are with depression in fathers (Connell & Goodman, 2002). We hypothesized that young girls at familial risk for MDD will exhibit anomalous cortical thickness, compared with their low-risk peers. Specifically, given meta-analytic results indicating that gray matter reductions in the ACC represent the most consistent and robust findings in structural neuroimaging studies of MDD (Bora et al., 2012), we hypothesized that despite not having (yet) experienced an episode of depression, girls at familial risk for depression will exhibit significantly thinner cortical gray matter in this region. Furthermore, given the findings reviewed above from prior neuroimaging studies examining the neural correlates of other known risk factors for depression indicating that a heightened vulnerability for the disorder may be associated with abnormalities in other cortical regions, we also conducted a whole brain analysis to assess significant main effects outside of this region of interest.
In addition to our primary goal of characterizing the neural basis of familial risk for depression, we explored two secondary questions. First, based on findings of previous studies that conceptualize MDD as a neurodevelopmental disorder (Ducharme et al., in press; Paus, Keshavan, & Giedd, 2008), showing for example, that the rate of cortical change over time predicts subsequent depression (Ducharme et al., in press), we explored whether differences in cortical thickness between daughters at low and high risk for depression in our cross-sectional sample were moderated by age. And second, we aimed to clarify the functional significance of anomalous cortical thickness in our high-risk sample by examining the relation between thickness and emotion regulation. Specifically, we tested the hypothesis that cortical thickness in brain areas that showed a main effect or interaction with risk status would be inversely related to difficulty with the experience and regulation of sad emotions. We indexed sadness management in this analysis using scores on the Children’s Sadness Management Scale (CSMS; Zeman, Shipman, & Penza-Clyve, 2001), given previous evidence from longitudinal studies that higher scores on this measure predict a subsequent increase in depressive symptoms (Feng et al., 2009).
Method
Participants
Sixty-four girls with no past or current Axis I disorder were included in the study. Thirty-six girls had mothers who also had no past or current Axis I disorder (low risk for depression), and 28 girls were classified as being at high risk for developing depression by virtue of having mothers who had recurrent episodes of MDD during their daughters’ lifetime.1 Participants were recruited through advertisements posted within the local community. A telephone screening interview established that both the participants and their mothers were fluent in English and that the daughters were between 9 and 17 years of age. Participants were excluded from either group if they had experienced severe head trauma, learning disabilities, and/or current or past depression. Neither the participants nor their mothers had current or past substance abuse and, consistent with the absence of diagnosed depression in the daughters, no girls in the study were taking antidepressant medications.
Trained interviewers assessed the diagnostic status of participants by administering the Kiddie Schedule for Affective Disorders and Schizophrenia for School-Age Children–Present and Lifetime version (K-SADS-PL; Kaufman et al., 1997) to both the girls and their mothers (about the daughters). A different interviewer administered the Structured Clinical Interview for DSM (SCID; First, Spitzer, Gibbon, & Williams, 1996) to the mothers. Interviewers for the K-SADS-PL and the SCID had previous experience administering structured clinical interviews. To assess interrater reliability, an independent trained rater who was blind to group membership evaluated 30% of the SCID and K-SAD-PL interviews by randomly selecting audiotapes of equal numbers of low- and high-risk pairs. In all cases, diagnoses of former depressive episodes in mothers and the absence of any current or previous Axis I disorder in the girls matched the diagnosis made by the original interviewer (Κ=1.00). This indicates excellent interrater reliability, although we should note that the interviewers used a “skip-out” strategy, which may have reduced the opportunities for the independent rater to disagree with the diagnoses.
Daughters completed the Children’s Depression Inventory–Short Form (CDI-S; Kovacs, 1992) and the Multidimensional Anxiety Scale for Children (MASC; March, Parker, Sullivan, Stallings, & Conners, 1997) to assess symptoms of depression and anxiety, respectively. The vocabulary section of the verbal subtest of the Wechsler Intelligence Scale for Children–III (WISC-III; Weschler, 1991) was administered to the girls to ensure that the low- and high-risk groups did not differ in intellectual ability. As we note above, participants also completed the CSMS (Zeman et al., 2001) to assess self-reported ability to effectively manage, regulate, and cope with the experience of sadness. This questionnaire consists of 12 items that assess children’s inhibition, dysregulated expression, and coping with sadness experience and expression using a 3-point Likert scale ranging from hardly ever (1) to often (3) (Zeman et al., 2001). The CSMS contains both forward- (7 items of inhibition and dysregulated expression subscales) and reverse- (5 items of coping subscale) scored items. Higher total scores on the CSMS indicate greater difficulty in management of sad emotions, and have been linked in previous longitudinal studies with a subsequent increase in depressive symptoms (Feng et al., 2009). The CSMS has demonstrated adequate reliability and construct validity (Zeman et al., 2001), and had an acceptable internal consistency in the current study of α = .61.
Girls in the high-risk group were eligible to participate in the study if they did not meet criteria for any past or current Axis I disorder according to both the parent and child K-SADS-PL, and if their mothers met DSM-IV criteria for at least 2 distinct episodes of MDD since the birth of their daughters but did not meet criteria for current MDD or any other current Axis I disorder. Girls in the healthy control group were eligible to participate if they did not meet criteria for any past or current Axis I disorder based on both the parent and child K-SADS-PL, and their mothers did not meet criteria for any Axis I disorder during their lifetime. Girls in both groups were excluded if they had experienced traumatic early life events, such as physical or sexual abuse.
Acquisition of neuroimaging data
All participants were scanned on a 1.5-T GE scanner (GE Healthcare Systems, Milwaukee, Wisconsin) between 0 and 75 days following their diagnostic interviews.2 Anatomic images were obtained using a T1-weighted spoiled gradient-recalled echo sequence with the following parameters: reaction time (RT) = 8.924 milliseconds; echo time (TE) = 1.792 milliseconds; flip angle = 15°; an in-plane resolution of 0.859 × 0.859; and a slice thickness of 1.5 millimeters.
Data Analysis
Statistical analyses of demographic and questionnaire measures
For demographic, behavioral, and self-report variables, we used SPSS, version 20.0 (http://www.spss.com) to conduct statistical analyses. We used two-tailed independent samples t-tests to compare the low- and high-risk groups on participant age, mother age, raw scores on the CDI-S, MASC, and CSMS, and scaled scores on the WISC-III, and a chi-square test to evaluate group differences in categories of household income.
Preprocessing of neuroimaging data
We used FreeSurfer (version 5.0, http://surfer.nmr.mgh.harvard.edu) to estimate cortical thickness. The technical details of Freesurfer procedures are described in previous publications (Dale, Fischl, & Sereno, 1999; Fischl & Dale, 2000; Salat et al., 2004). Briefly, processing streams included the removal of nonbrain tissue, intensity normalization, the segmentation of gray/white matter, and the alignment of each image volume to a standardized space. To estimate cortical gray matter thickness, a deformable surface algorithm was applied to segmented images to extract the pial and gray/white cortical surfaces (Dale et al., 1999). All cortical surfaces were visually inspected by one rater (B.G.) who was blind to group membership, and manual corrections were performed, where appropriate, following previously established procedures (Black et al., 2012). This additional quality-control step ensured the accuracy of gray/white matter segmentation, the exclusion of scalp and other non-brain tissue, and the inclusion of brain tissue. After spatial normalization of the data to a common space template, local cortical thickness was measured by estimating the shortest distance between the position of spatially equivalent surface points on the pial surface and the gray–white matter boundary and vice versa and averaging these 2 values. A 20-mm full-width at half-maximum Gaussian kernel was applied to smooth the data.
Statistical analysis of neuroimaging data
For both our a priori and our whole brain analyses, a general linear model (GLM) was fit at each vertex with cortical thickness as the dependent variable and group (low-risk, high-risk) as the independent variable. Age and CDI-S score were included as covariates, centered to the sample mean. Because the quadratic and cubic effects of age on cortical thickness were not significant, age was retained as a linear variable in the model.
To test for a main effect of group within the ACC and across the entire cortex, we conducted correction for multiple comparisons in resulting statistical maps at the regional and whole brain level, respectively, using a two-tailed threshold of p<0.05 and the Monte-Carlo simulation toolbox provided in Freesurfer. This approach, which is based on the methods outlined in Hagler, Saygin and Sereno (2006), estimates the probability of forming a maximum cluster of that size or larger during the simulation under the null hypothesis that results in a cluster-wise probability (CWP). Monte-Carlo simulations replace FDR and FWE procedures that are commonly used in structural or functional paradigms to correct for multiple corrections. CWP values are reported in the Results section.
More specifically, in order to test the hypothesis that familial risk for depression will be associated with thinner cortical gray matter in the ACC, we conducted correction for multiple comparisons across vertices contained within this region, defined using the Desikan atlas (part of the Freesurfer software package; Desikan et al., 2006). Following this ROI-based analysis, we then applied these same procedures, correcting for multiple comparisons, across the entire cortex to assess whether a main effect of group or a group by age interaction were present outside the ACC.
Exploratory Associations with CSMS score
To further examine the nature of anomalous patterns of cortical thickness within the group of high-risk girls, we computed partial correlations between CSMS scores and cortical thickness within regions that showed a main effect of group or an interaction of group and age. These analyses were conducted using mean cortical thickness (computed across vertices contained within each region showing significant effects in our initial examination of a main effect of group and group by age interactions) and controlled for the interval between the behavioral assessment and the neuroimaging session, age, and CDI-S score. Because these analyses were exploratory, α was set at 0.05.
Results
Participants
Demographic and clinical characteristics of the participants and their mothers are presented in Table 1. The two groups of girls did not differ in age, t = 1.72, p = 0.09, on scores of the CDI-S, t = −1.53, p = 0.13, the MASC, t = 0.76, p = 0.45, or the WISC-III vocabulary subtest, t = −0.56, p = 0.58, in mothers’ age, t = 1.92, p = 0.06, or in household income, χ = 8.73, p = 0.12. High-risk girls obtained significantly higher scores on the CSMS than did low-risk girls, t = −2.40, p = 0.02.
Table 1.
Demographic variables of girls at low and high familial risk for depression
| Demographic variable | Low Risk (N=35) |
High Risk (N=28) |
|---|---|---|
| Daughter’s age | 13.9 ± 1.7 | 13.2 ± 1.5 |
| Mother’s age | 47.4 ± 3.7 | 45.0 ± 6.7 |
| CDI-S score | 0.6 ± 1.1 | 1.1 ± 1.4 |
| MASC score | 37.9 ± 15.4 | 35.0 ± 13.6 |
| CSMS score* | 20.9 ± 2.5 | 22.5 ± 2.8 |
| WISC-III vocabulary score | 14.8 ± 2.8 | 15.1 ± 2.6 |
Values indicate the Mean ± SD.
Abbreviations: CDI-S, Child Depression Inventory–Short Form; MASC, Multidimensional Anxiety Scale for Children; WISC-III, Wechsler Intelligence Scale for Children–III. CSMS, Children’s Sadness Management Scale. WISC-III vocabulary scores represent scaled score equivalents of raw scores.
p<0.05.
Risk-related Alterations in Cortical Thickness
Contrary to our hypothesis, vertex-wise statistical analysis of cortical thickness maps, controlling for the linear effects of age and CDI-S score, did not reveal reductions in cortical thickness in girls at high risk for depression in the ACC. Outside this region, whole brain corrected maps showed a significant main effect of group in the right fusiform gyrus (CWP = 0.036; x/y/z Talairach peak coordinate = 29.7, −45.7, −15.4; Figure 1).
Figure 1.
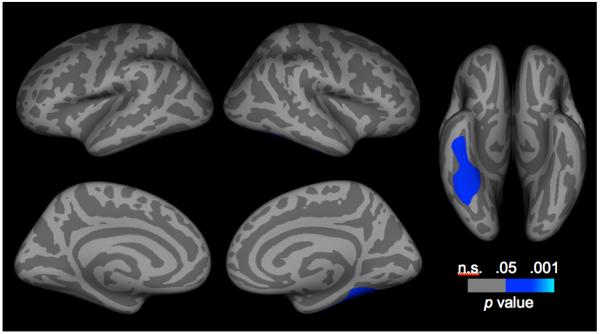
Corrected statistical significance maps showing areas of thinner cortical gray matter in girls at high versus low risk for depression. Statistical maps are shown on the inflated surface of the standard average participant, allowing visualization of data across the entire cortical surface without interference from cortical folding.
Exploratory Associations with Age
Exploratory analyses of the interaction of risk group and age yielded significant effects in three regions. First, in the left hemisphere, there was a significant interaction in a cluster that primarily contained the insula, but also the superior temporal gyrus (CWP = 0.002; x/y/z Talairach peak coordinate = −48.0, −11.6, −9.6). In the right hemisphere, the low- and high-risk groups differed in the association between thickness and age in a cluster that primarily encompassed the insula, but also the right lateral orbitofrontal cortex (CWP = 0.020; x/y/z Talairach peak coordinate = 30.4, 22.4, −0.7; Figure 2) and a cluster that primarily included the rostral and caudal ACCs, but also the medial orbitofrontal, and medial superior frontal, gyri (CWP = 0.0001; x/y/z Talairach peak coordinate = 15.2, 40.6, 9.4). These patterns were unchanged when CDI-S was removed from the model, or when total intracranial volume was added to the model.3
Figure 2.
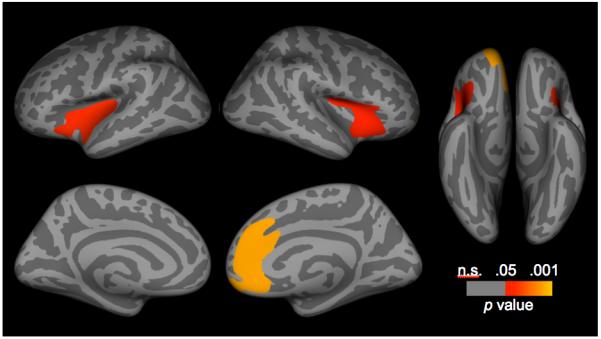
Corrected statistical significance maps showing areas having significant interactions of risk group and age. Statistical maps are shown on the inflated surface of the standard average participant, allowing visualization of data across the entire cortical surface without interference from cortical folding.
Tests of simple slopes indicated a significant inverse association between age and thickness in the clusters containing the left insula (β = −0.041, t = −2.28, p = 0.026) and the right insula (β = −0.043, t = −2.54, p = 0.014) in the low-risk girls, and a significant positive association between age and thickness in the left insula cluster (β = 0.055, t = 2.810, p = 0.007) and the right insula cluster (β = 0.055, t = 2.981, p = 0.004) in the high-risk girls. We also found an inverse association between age and thickness in the right ACC cluster in the low-risk girls (β = −0.073, t = −4.438, p<0.001) and a non-significant positive association between age and thickness in this cluster in high-risk girls (β = 0.026, t = 1.428, p = 0.158).
To understand the nature of the interaction of risk group and age, we applied the Johnson-Neyman technique for testing the region of significance to examine the ages at which there was a significant difference in cortical thickness between low- and high-risk girls at α = 0.05 (Preacher, Curran, & Bauer, 2006). This analysis indicated that in the cluster containing the left insula, high-risk girls younger than 12.22 years had thinner gray matter than did age-matched low-risk girls (β = −0.116, t = −2.00, p = 0.05); this pattern was reversed in girls 14.55 years and older (β = 0.108, t = 2.00, p = 0.05). In the cluster containing the right insula, high-risk girls younger than 12.88 years exhibited thinner gray matter relative to age-matched low-risk girls (β = −0.094, t = −2.00, p = 0.05); this pattern was reversed in girls older than 15.01 years (β = 0.115, t = 2.00, p = 0.05). Finally, in the cluster containing the right ACC, high-risk girls younger than 13.1 years exhibited thinner gray matter relative to age-matched low-risk girls (β = 0.089, t = −2.00, p = 0.05); this pattern was reversed in girls older than 15.21 years (β = 0.120, t = 2.00, p = 0.05; Figure 3).
Figure 3.
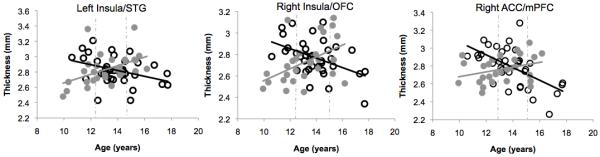
Scatter plots showing interactions of risk group and age for gray matter thickness in the right anterior cingulate cortex (ACC; left), the right insula (middle) and the left insula (right) for girls at high (gray circles) and low (black circles) risk for depression. Dotted lines indicate regions of significance (see text).
Exploratory Associations with CSMS score
We computed partial correlations between CSMS scores and average cortical thickness of regions implicated in the above analyses; these correlations indicated a significant inverse association between CSMS score and thickness of the right ACC in the high-risk girls, r = −0.49, df = 23, p = 0.013 (Figure 4). No significant correlations were obtained between CSMS score and cortical thickness in the low-risk girls (df = 30, rs < |−0.24|, ps > 0.16), nor were CSMS scores associated with thickness in the other three brain regions in the high-risk girls (df = 23, rs < |−0.21|, ps > 0.308). Additional analyses examining the strength of the association between CSMS score and thickness across the entire sample indicated that CSMS score was not itself a significant predictor of cortical thickness, nor was there a significant interaction of group and CSMS score (ts(59) < 0.35, ps > 0.14). CSMS scores were not correlated with daughters’ age (r = 0.19, p = 0.12), mothers’ age (r = −0.06, p = 0.65), CDI-S score (r = 0.10, p = 0.46), MASC score (r = 0.08, p = 0.57), or WISC-III scaled scores (r = −0.14, p = 0.31).
Figure 4.
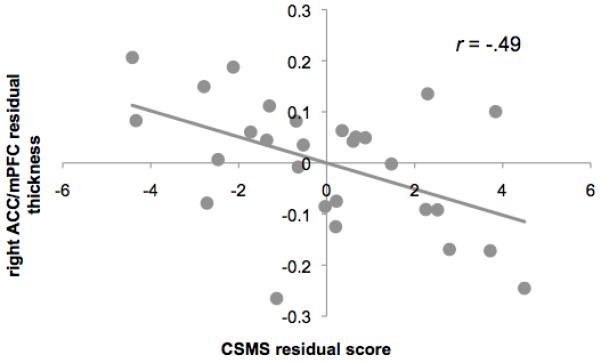
Scatter plots showing an inverse association between gray matter thickness in the right anterior cingulate cortex (ACC) and scores on the Children’s Sadness Management Scale (CSMS). Thickness and CSMS values are adjusted for interval between the neuroimaging and behavioral sessions, age and scores on the Child Depression Inventory–Short Form (CDI-S).
Discussion
Researchers have documented that having a parent with major depression is associated with a three- to five-fold increase in the risk for developing a depressive episode (Beardslee, Versage, & Gladstone, 1998; Williamson, Birmaher, Axelson, Ryan, & Dahl, 2004). Despite this fact, we know little about the mechanisms involved in the transmission of this increased risk. The present study was designed to elucidate abnormalities in cortical structure that are associated with a heightened vulnerability for depression using structural neuroimaging in a sample of carefully recruited and diagnosed never-disordered adolescent girls who are at risk for developing major depression by virtue of having a mother who has experienced recurrent episodes of MDD. Contrary to our hypothesis, thinner ACC gray matter was not found to be associated with a familial risk for depression. However, whole brain analyses indicated that the right fusiform gyrus of high-risk relative to low-risk girls was significantly thinner. Further, exploratory analyses revealed dynamic changes in the relation between cortical gray matter thickness and age: whereas daughters of never-disordered mothers exhibited an inverse relation between cortical thickness and age within the insula and ACC, girls at familial risk for depression showed the reverse pattern.
Although less consistently implicated in the neuroimaging literature of depression, gray matter reductions in the right fusiform gyrus have been reported in three voxel-based structural studies of adults (Alemany et al., 2013; Lee et al., 2011; Leung et al., 2009). Therefore, the current findings are important in suggesting that gray matter reductions in this area precede the onset of depressive illness in individuals at familial risk for the disorder. This area of the brain plays a critical role in the processing of faces (Haxby et al., 2000; Kanwisher et al., 1997; Vuilleumier, Armony, Driver, & Dolan, 2001). Activation of the right fusiform cortex in particular is selectively increased during the processing of negative facial emotions (Vuilleumier, Armony, Driver, & Dolan, 2001), likely as a result of prominent feedback connections from the amygdala (Amaral, Price, Pitakanen, & Carmichael, 1992). Such modulation, in turn, is posited to directly contribute to the increase in salience of such stimuli (Vuilleumier & Schwartz, 2001). Given the specialization of this region and its involvement in salience processing, it is tempting to speculate that structural alterations of this region could underlie the mood-congruent biases in attention for emotional faces that have been widely documented both in depressed adults and in their never-disordered offspring (Foland-Ross & Gotlib, 2012). The relations among cognition, brain function, and brain structure in the context of depression, however, remains to be clarified; future longitudinal studies that incorporate both behavioral and neural measures would be helpful in testing this formulation.
Our findings in the fusiform of adolescents at familial risk for depression are also consistent with at least three other investigations of risk for depression in adults. First, reductions in fusiform gray matter have been found in adults who were classified as being vulnerable to developing depression by virtue of having a negative cognitive style (Zhang et al., 2013). Second, anomalous responding in this area has been documented in individuals who scored high on a measure of neuroticism (Leung et al., 2009). And finally, Montag, Weber, Fliessback, Elger and Reuter (2009) found that genetic risk for depression, defined by an exchange of amino acids from valine (Val) to methionine (Met) at a single site on the brain-derived neurotrophic (BDNF) gene, is associated with reduced gray matter of the right fusiform gyrus. Our data add to this literature by showing that a maternal history of depression is also associated with cortical thickness reductions in this region of the right hemisphere.
While evidence from Montag and colleagues almost certainly implicates the involvement of genetic factors in the patterns of cortical thickness observed here, we cannot conclude from the present data whether risk-related anomalies in the fusiform of daughters of mothers with recurrent episodes of depression are genetic in origin, are the product of environmental factors related to having a recurrent-depressed mother, or are a combination of these etiologies. Indeed, while the heritability of depression is estimated to be between 31 and 42% (Sullivan, Neale, & Kendler, 2000), the chronic stress associated with living with a depressed parent also appears to mediate the intergenerational transmission of risk for depression (Hammen, Brennan, & Shih, 2004). Relative to nondepressed parents, parents with major depression exhibit more negative affect toward their children (Lovejoy, Graczyk, O’Hare, & Neuman, 2000), as well as increased parental withdrawal (e.g., avoidance, unresponsiveness to children’s needs) and greater parental intrusiveness (e.g., hostility, irritability and over-involvement in children’s lives; Lovejoy et al., 2000; Nelson, Hammen, Brennan, & Ullman, 2003). These behaviors contribute to a chronically stressful family environments for children of depressed parents (Hammen et al., 2004), and may induce neuroplastic changes in the cortex (Lupien, McEwen, Gunnar, & Heim, 2009). Future studies that directly investigate the influence of genes, chronic stress, and the impact of interventions aimed at protecting against the effects of stress on the brain would be helpful in teasing apart the relation between these factors.
Exploratory analyses of the interaction of risk status and age revealed significant effects in the insula and ACC. These regions typically co-activate under a variety of conditions involving emotional processing and first-person subjective experiences (Medford & Critchley, 2010), and form the core of a salience network (Seeley et al., 2007), which is implicated in the processing of emotionally salient information. Interestingly, although the insula is implicated less consistently in neuroimaging studies of depression, this subregion of the salience network plays a unique role in the learning, processing and regulation of social emotions such as guilt (Shin et al., 2000), which are posited to precede the onset of depression (Tone & Tully, 2014). Anomalous reductions of gray matter in the anterior insula has also been found to be a significant predictor of major depression in children (Belden et al., in press). Given their role in the processing of negatively valenced stimuli, risk-related alterations of the ACC and insula could contribute to an increased vulnerability for depression by influencing how emotionally salient material is processed. Because our study is cross-sectional, however, future studies that involve repeated scans of adolescents over time are needed to test whether the age-related patterns observed here reflect veridical developmental trajectories. Nevertheless, it is noteworthy that the negative relation that we found between thickness and age in our cross-sectional sample of low-risk girls is consistent with prior longitudinal investigations showing that robust reductions in cortical gray matter occur throughout adolescence (Giedd et al., 1999; Sowell et al., 2004).
It is important to note that, on the surface, our finding of risk-related increases in cortical thickness of the insula and ACC of older high-risk girls stands in contrast to reports of gray matter reductions in these regions of chronically depressed adults (Bora et al., 2012). In fact, as we noted above, the ACC is the most commonly reported area in structural neuroimaging studies of MDD. Importantly, however, of the few neuroimaging studies that have been conducted with medication-naïve individuals who are experiencing a first onset of depression, most have found that early in the course of the disorder, gray matter in this and other frontal lobe subregions is abnormally increased (Qiu et al., 2014; Reynolds et al., 2014; van Eijndhoven et al., 2013). Considering our results and these findings together could suggest an underlying pathological process whereby cortical gray matter thickens immediately prior to the onset of the disorder, but, as prior research in adults suggests (Bora et al., 2012) becomes thinner as individuals experience repeated episodes of depression. Again, future studies that follow high-risk youth longitudinally, starting before puberty and continuing through the onset of depression, will be critical in elucidating the temporal pattern of structural neural anomalies in depression.
While we are conceptualizing age-related increases in cortical thickness in high-risk girls to be related to an increasing vulnerability for depression, we cannot rule out the possibility that the thicker cortical gray matter that we observed in older high-risk girls instead is related to greater resilience. Indeed, because the design of our study required that daughters at familial risk for MDD must not have experienced a clinically significant episode of depression prior to their entry into the study, we cannot rule out the possibility that older girls in our high-risk sample are resilient to developing the disorder. Consistent with this possibility, exploratory partial correlation analyses in the current study indicated that increased cortical thickness in the ACC of high-risk girls was significantly associated with improved expression and regulation of sad emotions. This pattern of a positive association between ACC gray matter and adaptive responding to negative emotions is consistent with findings of a recent study of never-depressed adults (Giuliani, Drabant, & Gross, 2011) and with results of a study that found that a less severe course of depression was associated with significantly thicker ACC gray matter (Frodl, Jäger, et al., 2008).
Although the cellular changes that contribute to associations among cortical thickness, age, and risk status are not yet clear, one possible explanation for these relations is that increases in cortical thickness in older high-risk girls may be secondary to risk-related alterations in synaptic pruning or myelination that are posited to contribute directly to the wave of cortical thinning that is typically observed during adolescence (Giedd et al., 1999). While further testing using multiple scans from the same individuals is certainly needed to test this formulation, such a hypothesis is consistent with one recent longitudinal study of children and young adults found that youth with higher levels of internalizing symptoms at follow-up demonstrated a slower rate of thinning of cortical gray matter over time (Ducharme et al., in press). It is clear that the dynamic changes of the developing brain must be considered in future examinations of depression risk. Research that additionally combines in vivo and ex vivo methodologies will be especially critical in helping to clarify the cellular basis for observable changes in white and gray matter, seen using MRI.
Our findings should be interpreted in light of several limitations. First, as we mention above, because our investigation is cross-sectional, longitudinal studies are needed to conclude whether thinner gray matter of the fusiform gyrus that we observed in high-risk girls is related to an increased vulnerability for depression, as opposed to increased resilience and to conclude whether the group by age interactions that we observed in the insula and ACC are true developmental trends. Second, while our study is the first to examine cortical structure in an adolescent sample of offspring of depressed parents, prior research indicates that a surge newly emergent cases of MDD occurs between 15 and 18 years of age in females (Hankin et al., 1998). Thus, older girls in the high risk group may be particularly resilient. Third, although prior research estimates that nearly half of all Americans will meet criteria for a DSM-IV disorder sometime in their life (Kessler et al., 2005), inclusion criteria for the current study required that mothers of low-risk daughters must never have experienced any Axis I disorder. Thus, girls in our “ultra-healthy” low-risk group may have driven our findings in the fusiform, ACC and insula just as much as did girls in the high-risk group. Finally, although we found significant associations in exploratory analyses between CSMS scores and thickness of ACC gray matter in high-risk girls, it will be important for future studies to assess whether risk-related alterations in brain structure are associated with other forms of emotion regulation that may be related to vulnerability to depression.
In conclusion, the current study of cortical structure in never-disordered daughters of recurrent depressed mothers provides support for the formulation that intergenerational risk for depression is associated with abnormalities in brain morphometry. The interaction of risk status and age on cortical thickness of the insula and ACC highlights the importance of considering age in neuroimaging investigations of a risk for depression and underscores the need for additional neuroimaging studies that examine the functional consequences of cortical thickness changes as they relate to depression vulnerability. Further investigations that systematically examine the cognitive consequences of thinner gray matter of the fusiform gyri within girls at high risk for depression will also be important in determining whether structural deficits in this area are related to difficulties in emotion identification that have been reported in high-risk youth (Joormann, Talbot, & Gotlib, 2007). And finally, investigations that elucidate the adverse as well as the protective factors that influence risk-related departures from normative developmental trajectories will be critical in advancing our understanding of factors that contribute to the onset of major depression.
Acknowledgements
This work was supported by grants from the National Institute of Mental Health (MH74849 to IHG and MH090617 to LCFR), the National Alliance for Research in Schizophrenia and Affective Disorders (NARSAD; Distinguished Investigator Award to IHG and Young Investigator Award 19018 to LCFR) and from the Hope for Depression Research Foundation (to IHG and LCFR).
Footnotes
Our structural MRI investigation was a part of a larger research effort in which we also assessed interactions between mothers and their daughters, and we did not want current depressed mood in the mothers to influence the nature of those interactions. Thus, we excluded mothers who met diagnostic criteria for current depression.
The low- and high-risk groups did not differ with respect to the length of the interval between the behavioral and imaging assessments, t(54) = 0.99, p = 0.22; we included this interval as a covariate in all analyses relating neural structure with behavior. Further, all participants completed the CDI-S on the day of scanning to ensure an absence of significant depressive symptoms.
Additional analyses examining the effects of depressive symptoms did not yield significant interactions of risk group and CDI-S score (ts < 0.93, ps > 0.36), or significant associations between thickness and CDI-S score either within (ts < 1.40, ps > 0.17), or across groups (ts < 0.80, ps > 0.43). The absence of a main effect of the severity of depressive symptoms is likely due to the restricted range in CDI-S scores, which was a function of girls being excluded from participating in this study if they were experiencing (or had experienced) a depressive disorder.
All authors report no competing or financial interests.
References
- Alemany S, Mas A, Goldberg X, Falcón C, Fatjó-Vilas M, Arias B, Fañanás L. Regional gray matter reductions are associated with genetic liability for anxiety and depression: an MRI twin study. Journal of Affective Disorders. 2013;149:175–181. doi: 10.1016/j.jad.2013.01.019. [DOI] [PubMed] [Google Scholar]
- Allman JM, Tetreault NA, Hakeem AY, Manaye KF, Semendeferi K, Erwin JM, Hof PR. The von Economo neurons in the frontoinsular and anterior cingulate cortex. Annals of the New York Academy of Sciences. 2011;1225:59–71. doi: 10.1111/j.1749-6632.2011.06011.x. [DOI] [PMC free article] [PubMed] [Google Scholar]
- Amaral D, Price J, Pitakanen A, Carmichael S. Anatomical organization of the primate amygdaloid complex. Wiley-Liss; New York: 1992. [Google Scholar]
- Amico F, Meisenzahl E, Koutsouleris N, Reiser M, Moller HJ, Frodl T. Structural MRI correlates for vulnerability and resilience to major depressive disorder. Journal of Psychiatry and Neuroscience. 2011;36:15–22. doi: 10.1503/jpn.090186. [DOI] [PMC free article] [PubMed] [Google Scholar]
- Beardslee WR, Versage EM, Gladstone TR. Children of affectively ill parents: a review of the last 10 years. Journal of the American Academy of Child and Adolescent Psychiatry. 1998;37:11134–11141. doi: 10.1097/00004583-199811000-00012. [DOI] [PubMed] [Google Scholar]
- Belden AC, Barch DM, Oakberg TJ, April LM, Harms MP, Botteron KN, Luby JL. Anterior insula volume and guilt: neurobehavioral markers of recurrence after early childhood major depressive disorder. JAMA Psychiatry. doi: 10.1001/jamapsychiatry.2014.1604. in press. [DOI] [PMC free article] [PubMed] [Google Scholar]
- Berk M, Williams LJ, Jacka FN, O’Neil A, Pasco JA, Moylan S, Maes M. So depression is an inflammatory disease, but where does the inflammation come from? BMC Medicine. 2013;11:1–16. doi: 10.1186/1741-7015-11-200. [DOI] [PMC free article] [PubMed] [Google Scholar]
- Black JM, Tanaka H, Stanley L, Nagamine M, Zakerani N, Thurston A, Hoeft F. Maternal history of reading difficulty is associated with reduced language-related gray matter in beginning readers. Neuroimage. 2012;59:3021–3032. doi: 10.1016/j.neuroimage.2011.10.024. [DOI] [PMC free article] [PubMed] [Google Scholar]
- Bora E, Harrison BJ, Davey CG, Yücel M, Pantelis C. Meta-analysis of volumetric abnormalities in cortico-striatal-pallidal-thalamic circuits in major depressive disorder. Psychological Medicine. 2012;42:671–681. doi: 10.1017/S0033291711001668. [DOI] [PubMed] [Google Scholar]
- Chan SW, Norbury R, Goodwin GM, Harmer CJ. Risk for depression and neural responses to fearful facial expressions of emotion. British Journal of Psychiatry. 2009;194:139–145. doi: 10.1192/bjp.bp.107.047993. [DOI] [PubMed] [Google Scholar]
- Connell AM, Goodman SH. The association between psychopathology in fathers versus mothers and children’s internalizing and externalizing behavior problems: a meta-analysis. Psychological Bulletin. 2002;128:746–773. doi: 10.1037/0033-2909.128.5.746. [DOI] [PubMed] [Google Scholar]
- Dale AM, Fischl B, Sereno MI. Cortical surface-based analysis. I. Segmentation and surface reconstruction. Neuroimage. 1999;9:179–194. doi: 10.1006/nimg.1998.0395. [DOI] [PubMed] [Google Scholar]
- Desikan RS, Ségonne F, Fischl B, Quinn BT, Dickerson BC, Blacker D, Killiany RJ. An automated labeling system for subdividing the human cerebral cortex on MRI scans into gyral based regions of interest. Neuroimage. 2006;31:968–980. doi: 10.1016/j.neuroimage.2006.01.021. [DOI] [PubMed] [Google Scholar]
- Dowlati Y, Herrmann N, Swardfager W, Liu H, Sham L, Reim EK, Lanctôt KL. A meta-analysis of cytokines in major depression. Biological Psychiatry. 2010;67:446–457. doi: 10.1016/j.biopsych.2009.09.033. [DOI] [PubMed] [Google Scholar]
- Ducharme S, Albaugh MD, Hudziak JJ, Botteron KN, Nguyen TV, Truong C, Group., F. t. B. D. C. Anxious/depressed symptoms are linked to right ventromedial prefrontal cortical thickness maturation in healthy children and young adults. Cerebral Cortex. doi: 10.1093/cercor/bht151. in press. [DOI] [PMC free article] [PubMed] [Google Scholar]
- Dziobek I, Bahnemann M, Convit A, Heekeren HR. The role of fusiform-amygdala system in the pathophysiology of Autism. JAMA Psychiatry. 2010;67:397–405. doi: 10.1001/archgenpsychiatry.2010.31. [DOI] [PubMed] [Google Scholar]
- Feng X, Keenan K, Hipwell AE, Henneberger AK, Rischall MS, Butch J, Babinski DE. Longitudinal associations between emotion regulation and depression in preadolescent girls: moderation by the caregiving environment. Developmental Psychology. 2009;45:798–808. doi: 10.1037/a0014617. [DOI] [PMC free article] [PubMed] [Google Scholar]
- First MB, Spitzer RL, Gibbon M, Williams JBW. Structured Clinical Interview for DSM–IV Axis I Disorders—Clinician Version (SCID-CV) American Psychiatric Press; Washington, DC: 1996. [Google Scholar]
- Fischl B, Dale A. Measuring the thickness of the human cerebral cortex from magnetic resonance images. Proceedings of the National Academy of Sciences of the United States of America. 2000;97:11050–11055. doi: 10.1073/pnas.200033797. [DOI] [PMC free article] [PubMed] [Google Scholar]
- Foland-Ross LC, Gotlib IH. Cognitive and neural aspects of information processing in major depressive disorder: an integrative perspective. Frontiers in Psychology. 2012;3 doi: 10.3389/fpsyg.2012.00489. [DOI] [PMC free article] [PubMed] [Google Scholar]
- Frodl TS, Jäger M, Born C, Ritter S, Kraft E, Zetzsche T, Meisenzahl E. Anterior cingulate cortex does not differ between patients with major depression and healthy controls, but relatively large anterior cingulate cortex predicts a good clinical course. Psychiatry Research. 2008;163:76–83. doi: 10.1016/j.pscychresns.2007.04.012. [DOI] [PubMed] [Google Scholar]
- Frodl TS, Koutsouleris N, Bottlender R, Born C, Jäger M, Scupin I, Meisenzahl EM. Depression-related variation in brain morphology over 3 years: effects of stress? Archives of General Psychiatry. 2008;65:1156–1165. doi: 10.1001/archpsyc.65.10.1156. [DOI] [PubMed] [Google Scholar]
- Giedd J, Blumenthal J, Jeffries N, Castellanos F, Liu H, Zijdenbos A, Rapoport J. Brain development during childhood and adolescence: a longitudinal MRI study. Nature Neuroscience. 1999;2:861–863. doi: 10.1038/13158. [DOI] [PubMed] [Google Scholar]
- Giuliani NR, Drabant EM, Gross JJ. Anterior cingulate cortex volume and emotion regulation: is bigger better? Biological Psychology. 2011;86:379–382. doi: 10.1016/j.biopsycho.2010.11.010. [DOI] [PMC free article] [PubMed] [Google Scholar]
- Hagler DJJ, Saygin AP, Sereno MI. Smoothing and cluster thresholding for cortical surface-based group analysis of fMRI data. Neuroimage. 2006;33:1093–1103. doi: 10.1016/j.neuroimage.2006.07.036. [DOI] [PMC free article] [PubMed] [Google Scholar]
- Hammen C, Brennan PA, Keenan-Miller D. Patterns of adolescent depression to age 20: the role of maternal depression and youth interpersonal dysfunction. Journal of Abnormal Child Psychology. 2008;36:1189–1198. doi: 10.1007/s10802-008-9241-9. [DOI] [PubMed] [Google Scholar]
- Hammen C, Brennan PA, Shih JH. Family discord and stress predictors of depression and other disorders in adolescent children of depressed and nondepressed women. Journal of the American Academy of Child and Adolescent Psychiatry. 2004;43:994–1002. doi: 10.1097/01.chi.0000127588.57468.f6. [DOI] [PubMed] [Google Scholar]
- Hankin BL, Abramson LY, Moffitt TE, Silva PA, McGee R, Angell KE. Development of depression from preadolescence to young adulthood: emerging gender differences in a 10-year longitudinal study. Journal of Abnormal Psychology. 1998;107:128–140. doi: 10.1037//0021-843x.107.1.128. [DOI] [PubMed] [Google Scholar]
- Haxby JV, Hoffman EA, Gobbini MI. The distributed human neural system for face perception. Trends in Cognitive Sciences. 2000;4:223–233. doi: 10.1016/s1364-6613(00)01482-0. [DOI] [PubMed] [Google Scholar]
- Joormann J, Talbot L, Gotlib IH. Biased processing of emotional information in girls at risk for depression. Journal of Abnormal Psychology. 2007;116:135–143. doi: 10.1037/0021-843X.116.1.135. [DOI] [PubMed] [Google Scholar]
- Kanwisher N, McDermott J, Chun MM. The fusiform face area: a module in human extrastriate cortex specialized for face perception. Journal of Neuroscience. 1997;17:4302–4311. doi: 10.1523/JNEUROSCI.17-11-04302.1997. [DOI] [PMC free article] [PubMed] [Google Scholar]
- Kaufman J, Birmaher B, Brent D, Rao U, Flynn C, Moreci P, Ryan N. Schedule for Affective Disorders and Schizophrenia for School-Age Children–Present and Lifetime Version (K-SADS-PL): initial reliability and validity data. Journal of the American Academy of Child and Adolescent Psychiatry. 1997;36:980–988. doi: 10.1097/00004583-199707000-00021. [DOI] [PubMed] [Google Scholar]
- Kessler RC, Berglund P, Demler O, Jin R, Merikangas KR, Walters EE. Lifetime prevalence and age-of-onset distributions of DSM-IV disorders in the National Comorbidity Survey Replication. Archives of General Psychiatry. 2005;62:593–602. doi: 10.1001/archpsyc.62.6.593. [DOI] [PubMed] [Google Scholar]
- Kessler RC, Wang PS. Epidemiology of depression. Second Edition Guilford; New York: 2009. [Google Scholar]
- Kovacs M. The Children’s Depression Inventory (CDI) Multi-Health Systems; North Tonawanda: 1992. [Google Scholar]
- Lee HY, Tae WS, Yoon HK, Lee BT, Paik JW, Son KR, Ham BJ. Demonstration of decreased gray matter concentration in the midbrain encompassing the dorsal raphe nucleus and the limbic subcortical regions in major depressive disorder: an optimized voxel-based morphometry study. Journal of Affective Disorders. 2011;133:128–136. doi: 10.1016/j.jad.2011.04.006. [DOI] [PubMed] [Google Scholar]
- Leung KK, Lee TM, Wong MM, Li LS, Yip PS, Khong PL. Neural correlates of attention biases of people with major depressive disorder: a voxel-based morphometric study. Psychological Medicine. 2009;399:1097–1106. doi: 10.1017/S0033291708004546. [DOI] [PubMed] [Google Scholar]
- Lewinsohn PM, Rohde P, Seeley JR, Klein DN, Gotlib IH. Natural course of adolescent major depressive disorder in a community sample: predictors of recurrence in young adults. American Journal of Psychiatry. 2000;157:1584–1591. doi: 10.1176/appi.ajp.157.10.1584. [DOI] [PubMed] [Google Scholar]
- Lieb R, Isensee B, Höfler M, Pfister H, Wittchen HU. Parental major depression and the risk of depression and other mental disorders in offspring: a prospective-longitudinal community study. Archives of General Psychiatry. 2002;59:365–374. doi: 10.1001/archpsyc.59.4.365. [DOI] [PubMed] [Google Scholar]
- Lovejoy MC, Graczyk PA, O’Hare E, Neuman G. Maternal depression and parenting behavior: A meta-analytic review. Clinical Psychology Review. 2000;20:561–592. doi: 10.1016/s0272-7358(98)00100-7. [DOI] [PubMed] [Google Scholar]
- Lupien SJ, McEwen BS, Gunnar MR, Heim C. Effects of stress throughout the lifespan on the brain, behaviour and cognition. Nature Reviews in Neuroscience. 2009;10:434–445. doi: 10.1038/nrn2639. [DOI] [PubMed] [Google Scholar]
- March J, Parker J, Sullivan K, Stallings P, Conners C. The Multidimensional Anxiety Scale for Children (MASC): Factor structure, reliability and validity. Journal of the Academy of Child and Adolescent Psychiatry. 1997;36:554–565. doi: 10.1097/00004583-199704000-00019. [DOI] [PubMed] [Google Scholar]
- Mayberg HS. Limbic-cortical dysregulation: a proposed model of depression. Journal of Neuropsychiatry and Clinical Neuroscience. 1997;9:471–481. doi: 10.1176/jnp.9.3.471. [DOI] [PubMed] [Google Scholar]
- Medford N, Critchley HD. Conjoint activity of anterior insular and anterior cingulate cortex: awareness and response. Brain Structure and Function. 2010;214:535–549. doi: 10.1007/s00429-010-0265-x. [DOI] [PMC free article] [PubMed] [Google Scholar]
- Montag C, Weber B, Fliessbach K, Elger C, Reuter M. The BDNF Val66Met polymorphism impacts parahippocampal and amygdala volume in healthy humans: incremental support for a genetic risk factor for depression. Psychological Medicine. 2009;39:1831–1839. doi: 10.1017/S0033291709005509. [DOI] [PubMed] [Google Scholar]
- Murray C, Lobez A. The Global Burden of Disease: A comprehensive assessment of mortality and disability from diseases, injuries and risk factors in 1990 and projected to 2020. Cambridge, MA: 1996. [Google Scholar]
- Nelson DR, Hammen C, Brennan PA, Ullman JB. The impact of maternal depression on adolescent adjustment: The role of expressed emotion. Journal of Consulting and Clinical Psychology. 2003;71:935–944. doi: 10.1037/0022-006X.71.5.935. [DOI] [PubMed] [Google Scholar]
- Nolan CL, Moore GJ, Madden R, Farchione T, Bartoi M, Lorch E, Rosenberg DR. Prefrontal cortical volume in childhood-onset major depression: preliminary findings. Archives of General Psychiatry. 2002;59:173–179. doi: 10.1001/archpsyc.59.2.173. [DOI] [PubMed] [Google Scholar]
- Nolen-Hoeksema S, Hilt LM. Gender differences in depression. In: Gotlib IH, Hammen CL, editors. Handbook of Depression. 2nd Edition Guilford Press; New York, NY: 2008. pp. 386–404. [Google Scholar]
- Pannekoek JN, van der Werff SJ, van den Bulk BG, van Lang ND, Rombouts SA, van Buchem MA, van der Wee NJ. Reduced anterior cingulate gray matter volume in treatment-naïve clinically depressed adolescents. Neuroimage Clinical. 2014;4:336–342. doi: 10.1016/j.nicl.2014.01.007. [DOI] [PMC free article] [PubMed] [Google Scholar]
- Paus T, Keshavan M, Giedd JN. Why do many psychiatric disorders emerge during adolescence? Nature Reviews Neuroscience. 2008;9:947–957. doi: 10.1038/nrn2513. [DOI] [PMC free article] [PubMed] [Google Scholar]
- Peterson BS, Warner V, Bansal R, Zhu H, Hao X, Liu J, Weissman MM. Cortical thinning in persons at increased familial risk for major depression. Proceedings of the National Academy of Sciences of the United States of America. 2009;106:6273–6278. doi: 10.1073/pnas.0805311106. [DOI] [PMC free article] [PubMed] [Google Scholar]
- Pezawas L, Meyer-Lindenberg A, Drabant EM, Verchinski BA, Munoz KE, Kolachana BS, Weinberger DR. 5-HTTLPR polymorphism impacts human cingulate–amygdala interactions: a genetic susceptibility mechanism for depression. Nature Neuroscience. 2005;8:828–834. doi: 10.1038/nn1463. [DOI] [PubMed] [Google Scholar]
- Phillips ML, Ladouceur CD, Drevets WC. A neural model of voluntary and automatic emotion regulation: implications for understanding the pathophysiology and neurodevelopment of bipolar disorder. Molecular Psychiatry. 2008;13:833–857. doi: 10.1038/mp.2008.65. [DOI] [PMC free article] [PubMed] [Google Scholar]
- Preacher KJ, Curran PJ, Bauer DJ. Computational tools for probing interaction effects in multiple linear regression, multilevel modeling, and latent curve analysis. Journal of Educational and Behavioral Statistics. 2006;31:437–448. [Google Scholar]
- Qiu L, Lui S, Kuang W, Huang X, Li J, Li J, Gong Q. Regional increases of cortical thickness in untreated, first-episode major depressive disorder. Translational Psychiatry. 2014;4 doi: 10.1038/tp.2014.18. [DOI] [PMC free article] [PubMed] [Google Scholar]
- Rajkowska G. Postmortem studies in mood disorders indicate altered numbers of neurons and glial cells. Biological Psychiatry. 2000;48:766–777. doi: 10.1016/s0006-3223(00)00950-1. [DOI] [PubMed] [Google Scholar]
- Rajkowska G, Miguel-Hidalgo JJ, Wei J, Dilley G, Pittman SD, Meltzer HY, Stockmeier CA. Morphometric evidence for neuronal and glial prefrontal cell pathology in major depression. Biological Psychiatry. 1999;45:1085–1098. doi: 10.1016/s0006-3223(99)00041-4. [DOI] [PubMed] [Google Scholar]
- Reynolds S, Carrey N, Jaworska N, Langevin LM, Yang XR, Macmaster FP. Cortical thickness in youth with major depressive disorder. BMC Psychiatry. 2014;14 doi: 10.1186/1471-244X-14-83. [DOI] [PMC free article] [PubMed] [Google Scholar]
- Salat D, Buckner R, Snyder A, Greve D, Desikan R, Busa E, Fischl B. Thinning of the cerebral cortex in aging. Cerebral Cortex. 2004;14:721–730. doi: 10.1093/cercor/bhh032. [DOI] [PubMed] [Google Scholar]
- Shin LM, Dougherty DD, Orr SP, Pitman RK, Lasko M, Macklin ML, Rauch SL. Activation of anterior paralimbic structures during guilt-related script-driven imagery. Biological Psychiatry. 2000;48:43–50. doi: 10.1016/s0006-3223(00)00251-1. [DOI] [PubMed] [Google Scholar]
- Seeley WW, Menon V, Schatzberg AF, Keller J, Glover GH, Kenna H, Greicius MD. Dissociable intrinsic connectivity networks for salience processing and executive control. Journal of Neuroscience. 2007;27:2349–2356. doi: 10.1523/JNEUROSCI.5587-06.2007. [DOI] [PMC free article] [PubMed] [Google Scholar]
- Sowell E, Thompson P, Leonard C, Welcome S, Kan E, Toga A. Longitudinal mapping of cortical thickness and brain growth in normal children. Journal of Neuroscience. 2004;24:8223–8231. doi: 10.1523/JNEUROSCI.1798-04.2004. [DOI] [PMC free article] [PubMed] [Google Scholar]
- Sullivan PF, Neale MC, Kendler KS. Genetic epidemiology of major depression: review and meta-analysis. American Journal of Psychiatry. 2000;157:1552–1562. doi: 10.1176/appi.ajp.157.10.1552. [DOI] [PubMed] [Google Scholar]
- van Eijndhoven P, van Wingen G, Katzenbauer M, Groen W, Tepest R, Fernández G, Tendolkar I. Paralimbic cortical thickness in first-episode depression: evidence for trait-related differences in mood regulation. American Journal of Psychiatry. 2013;170:1477–1486. doi: 10.1176/appi.ajp.2013.12121504. [DOI] [PubMed] [Google Scholar]
- Vuilleumier P, Armony JL, Driver J, Dolan RJ. Effects of attention and emotion on face processing in the human brain: an event-related fMRI study. Neuron. 2001;30:829–841. doi: 10.1016/s0896-6273(01)00328-2. [DOI] [PubMed] [Google Scholar]
- Vuilleumier P, Schwartz S. Emotional facial expressions capture attention. Neurology. 2001;56:153–158. doi: 10.1212/wnl.56.2.153. [DOI] [PubMed] [Google Scholar]
- Weissman MM, Gammon GD, John K, Merikangas KR, Warner V, Prusoff BA, Sholomskas D. Children of depressed parents. Increased psychopathology and early onset of major depression. Archives of General Psychiatry. 1987;44:847–853. doi: 10.1001/archpsyc.1987.01800220009002. [DOI] [PubMed] [Google Scholar]
- Weschler D. The Weschler Intelligence Scale for Children. Psychological Corporation; San Antonio, TX: 1991. [Google Scholar]
- Williamson DE, Birmaher B, Axelson DA, Ryan ND, Dahl RE. First episode of depression in children at low and high familial risk for depression. Journal of the American Academy of Child and Adolescent Psychiatry. 2004;43:291–297. doi: 10.1097/00004583-200403000-00010. [DOI] [PubMed] [Google Scholar]
- Winkler AM, Kochunov P, Blangero J, Almasy L, Zilles K, Fox PT, Glahn DC. Cortical thickness or grey matter volume? The importance of selecting the phenotype for imaging genetics studies. Neuroimage. 2009;53 doi: 10.1016/j.neuroimage.2009.12.028. [DOI] [PMC free article] [PubMed] [Google Scholar]
- Wust S, Federenko I, Hellhammer DH, Kirschbaum C. Genetic factors, perceived chronic stress, and the free cortisol response to awakening. Psychoneuroendocrinology. 2000;25:707–720. doi: 10.1016/s0306-4530(00)00021-4. [DOI] [PubMed] [Google Scholar]
- Zeman J, Shipman K, Penza-Clyve S. Development and initial validation of the Children’s Sadness Management Scale. Journal of Nonverbal Behavior. 2001;25:187–205. [Google Scholar]
- Zhang X, Yao S, Zhu X, Wang X, Zhu X, Zhong M. Gray matter volume abnormalities in individuals with cognitive vulnerability to depression: a voxel-based morphometry study. Journal of Affective Disorders. 2013;136:443–452. doi: 10.1016/j.jad.2011.11.005. [DOI] [PubMed] [Google Scholar]