Abstract
The war against cancer has yielded important advances in the early diagnosis and treatment of certain cancer types, but the poor detection rate and 5-year survival rate for lung cancer remains little changed over the past 40 years. Early detection through emerging lung cancer screening programs promises the most reliable means of improving mortality. Sputum cytology has been tried without success because sputum contains few malignant cells that are difficult for cytologists to detect. However, research has shown that sputum contains diagnostic malignant cells and could serve as a means of lung cancer detection if those cells could be detected and correctly characterized. Recently, the National Lung Cancer Screening Trial reported that screening by three consecutive low-dose X-ray CT scans provides a 20% reduction in lung cancer mortality compared to chest X-ray. This reduction in mortality, however, comes with an unacceptable false positive rate that increases patient risks and the overall cost of lung cancer screening. This article reviews the LuCED® test for detecting early lung cancer. LuCED is based on patient sputum that is enriched for bronchial epithelial cells. The enriched sample is then processed on the Cell-CT®, which images cells in three dimensions with sub-micron resolution. Algorithms are applied to the 3D cell images to extract morphometric features that drive a classifier to identify cells that have abnormal characteristics. The final status of these candidate abnormal cells is established by the pathologist's manual review. LuCED promotes accurate cell classification which could enable cost effective detection of lung cancer.
Keywords: Dysplasia, induced sputum, spontaneous sputum, lung cancer, sensitivity, specificity, sputum cytology, lung cancer screening, LuCED, Cell-CT
Introduction
Lung cancer is the world's most deadly cancer with little progress toward a cure since the National Cancer Act was voted into law more than 40 years ago (1). While significant increases in the five-year survival rates of breast, colon, prostate and cervical cancer have been recorded, the lung cancer survival rates have remained static (2). Recently, the results of the National Lung Cancer Screening Trial (NLST) showed a 20% reduction in lung cancer mortality due to lung cancer screening based on the use of low-dose X-ray computed tomography (LDCT), as compared with conventional chest X-ray (3). Based on the strength of this data, the Center for Medicare/Medicaid Services (CMS) has decided to cover lung cancer screening by LDCT (4). However, a troublesome issue with lung cancer screening using LDCT has been the costs associated with false positive indications. Although lung cancer typically is found in just over 1% of the patients who are at high risk for the disease (5), 24% of the screened population emerged with a positive LDCT result implying a 96% false positive rate. An increase in the minimum tumor size for LDCT triage has been proposed to reduce the false positive rate, at the cost of reduced sensitivity (6). Among lung cancer clinicians, the debate has largely turned to the management of suspicious cases and the costs associated with screening.
The use of enhanced cytology methods has the potential to improve the accuracy of lung cancer screening. The LuCED® test (VisionGate, Phoenix, AZ) is based upon high sensitivity and high specificity abnormal cell detection in sputum for highly accurate and cost-effective screening.
Overview of the LuCED Test
LuCED is based on processing of patient sputum with the goal of discovering abnormal epithelial cells if present in the sample.
An overview of the LuCED test is shown in Figure 1. Sputum collection is done through spontaneous coughs in the patient's home or through induction in the clinic. Sputum is processed to remove contaminants and non-bronchial epithelial cells (de-bulking the white cells and oral squamous cells). The enriched specimen is processed on the Cell-CT® platform that images cells digitally in true 3D with isometric, sub-micron resolution. The bio-signatures associated with cancer are measured on the 3D cell images and combined into a score that is used to identify those few cells that have cancer characteristics. These cells are then displayed for manual cytologist review using the CellGazer® (VisionGate, Phoenix, AZ) review station. Here, the cytologist views cell images in 2D and 3D to establish the final normal or abnormal status.
Figure 1.

Sputum Collection
Earlier attempts at the development of a lung cancer-screening program were based on sputum cytology (7) which showed an insufficient sensitivity to disease detection (about 60% on average) but with very good specificity. This experience led some to conclude that sputum is not valuable for detection of lung cancer. A careful analysis involving sputum embedded in paraffin blocks showed that the specimen actually contains abnormal cells in 86% of cancer patients (8). Collection by morning coughs over three successive days yielded optimal results. A further analysis showed that abnormal cells are present in sputum stratified by all relevant clinical factors, including tumor histologic type, size, stage and location (9). Based on these specimen characteristics, LuCED employs spontaneous cough sputum. Initial evaluations have shown satisfactory results using sputum fixation by either CytoLyt (Hologic, Marlborough, MA) or Saccomanno's method. The question of specimen adequacy is also important for sputum cytology. Attempts at increasing the volume of the sputum expectorate have met with varied success. Sputum induction (10,11) increases production of phlegm to help achieve an overall adequate sample.
Sputum Enrichment and Preparation
In the LuCED test, sputum specimens undergo three stages of processing prior to Cell-CT analysis: 1) Sputum cell isolation and cryopreservation; 2) enrichment by fluorescence activated cell sorting (FACS); and 3) embedding of enriched cells into optical oil that is index-matched to the optical components of the Cell-CT imaging system.
Cryopreservation and FACS enrichment
Sputum is treated with the mucolytic agent dithiothreitol (DTT) (Fisher Scientific, Waltham, MA). For longer term storage, the specimen is then filtered through a 41μm nylon net and kept at -80°C in 15% dimethyl sulfoxide (DMSO) (Fisher Scientific, Waltham, MA).
After filtration, an aliquot of up to 100μL of the preserved specimen is removed for LuCED analysis. First, sputum cells are stained with hematoxylin (Electron Microscopy Sciences, Hatfield, Pennsylvania) for downstream LuCED imaging. Cells are then treated with an antibody cocktail containing fluorescent conjugates chosen to both enrich for bronchial epithelial cells and to deplete contaminating inflammatory cells (neutrophils and macrophages). An anti-cytokeratin-FITC conjugate cocktail (Cell Signaling, Danvers, Massachusetts) targets cytokeratins expressed in both normal and malignant epithelial cells. An Anti-CD45-APC conjugate (Mylteni, Bergisch Gladbach, Germany) targets inflammatory cells for negative selection. Cells are also stained with DAPI (Life Technologies, Grand Island, New York) prior to cell sorting. For FACS enrichment, a DAPI-positive mother gate is created to exclude doublet cells and debris, followed by exclusion of high side-scatter events, which are primarily oral squamous cells. Subsequently, a cytokeratin-high (High FITC) and CD45-Low (Low APC) daughter gate is drawn. The population of cells in this daughter gate are the enriched target epithelial cells sorted for a more efficient and downstream LuCED analysis using the Cell-CT.
Embedding of Enriched Cells
Following FACS enrichment, cells are dehydrated in ethanol followed by suspension in xylene. The cells are then transferred to and embedded in a suitable volume of the optical medium. The optical medium is a viscous oil with matching refractive index for the Cell-CT. Once embedded, cells are injected into a disposable cartridge for imaging on the Cell-CT.
Cell-CT Cell Imaging
The Cell-CT is an automated, high-resolution 3D tomographic microscope and computing system for imaging cells in flow. Although the technology is not limited to any one contrast method, the LuCED test specifically targets cell morphology based on the traditionally used hematoxylin stain.
In the LuCED application, the Cell-CT computes 3D cell images with equal resolution in all dimensions (isotropic resolution) allowing measurements to be independent of orientation. Further, eliminating the focal plane ambiguity and view orientation dependencies typical of conventional microscopy provides information content to automatically recognize a broad spectrum of cell types, and unambiguously identify rare abnormal cells in a predominantly normal cell population. The Cell-CT output identifies about 0.5% of all cells as abnormal candidates to be verified using the CellGazer (VisionGate, Phoenix, AZ) dashboard, an imaging software tool that allows human review of images free of focal plane and orientation ambiguity.
Imaging Process
Cell-CT imaging is performed on a small-volume liquid suspension. For LuCED, these cells are from the enriched epithelial cell population noted above. Because the Cell-CT can separate closely coincident objects, a narrowly focused core of single file cell flow (a requirement in standard flow cytometry) is unnecessary.
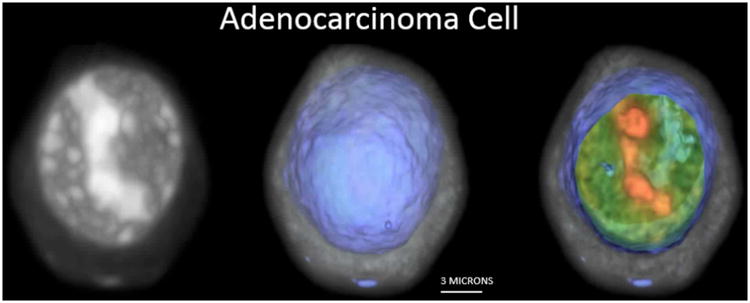
The Cell-CT microscope is illustrated in Figure 2. Stained nuclei are suspended in a media and injected into a capillary tube (62 μm inner diameter). The capillary system has been designed to be disposable, thus eliminating the possibility of cross-contamination between specimens. Pressure applied to the fluid moves objects into position for imaging, before 3D data is collected as the tube rotates. A mirror is actuated to sweep the plane of focus through the object, and the image is integrated by the camera to create a pseudo-projection from a single perspective (12). Not shown in Figure 2 is the glass holder that interfaces the capillary to the Cell-CT. The holder has a hole cut through the middle that is slightly larger than the outside diameter of the capillary and glass flats on either side to allow optical coupling to the objective and condenser lenses. A capillary that is loaded with cells embedded in transport medium is threaded through the holder. The transport media that holds the cells, the glass capillary, capillary holder, oil to interface to the lenses and the lenses themselves are made from materials of the same optical index. As a consequence, rays of light pass through the Cell-CT optics, capillary and cells without refraction while the cell may be rotated to allow capture of a set of 500 pseudo-projections is taken as the capillary rotates through 360°. Because the cells are suspended in a fluid medium, they are prone to a small amount of movement while pseudo-projection images are collected. Cell images in the pseudo-projections, therefore, must be registered to a common center so that the cell features reinforce one another during the reconstruction. The set of corrected pseudo-projections is processed using a filtered back-projection algorithm, similar to that in use in conventional X-ray CT, to compute the tomographic 3D cell reconstruction (13). Figure 2 illustrates pseudo-projections taken at three angular positions: 0°, 90° and 180°. Illumination is provided by light at 585nm wavelength to optimize image contrast based on the hematoxylin absorption spectrum. In the reconstruction, 3D pixels or voxels are cubic, with a size of 70 nm in each dimension. Reconstruction volumes vary in size, as the image collection volume is cropped around the object. Typically, volumes are approximately 200-300 pixels on the side. An example 3D image of an adenocarcinoma cell as imaged by the Cell-CT is shown in Figure 3.
Figure 2.
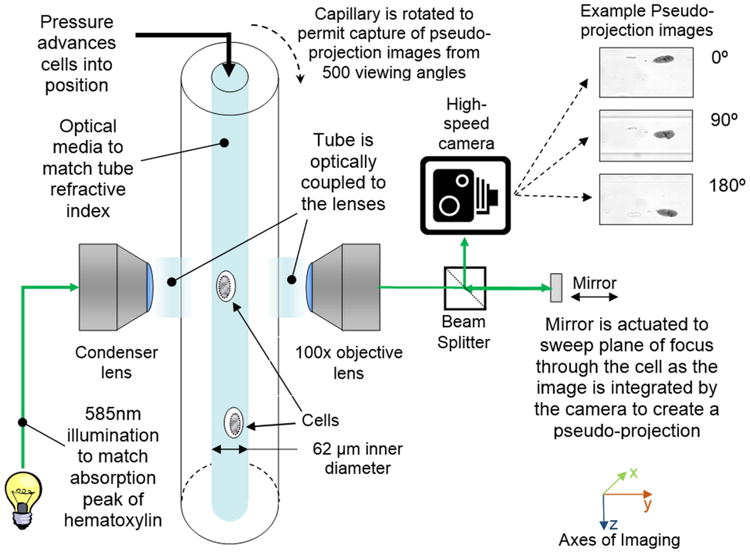
Figure 3.
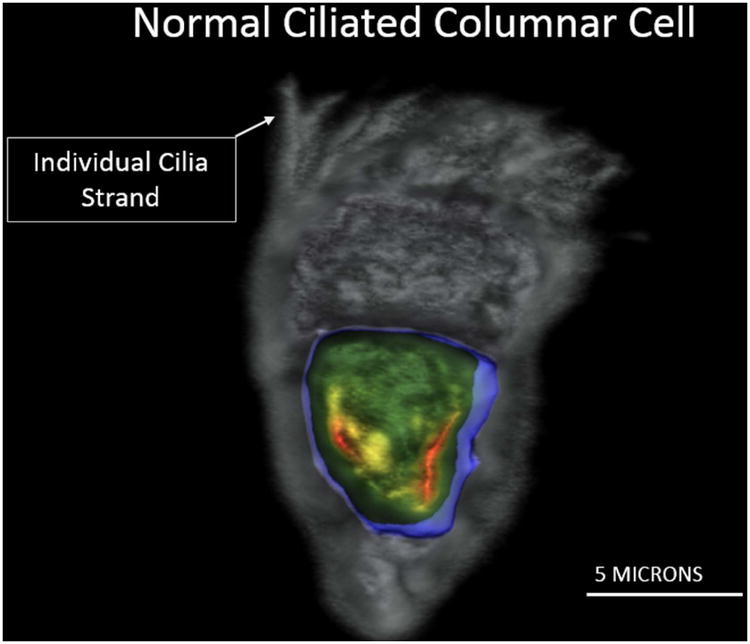
An imaged normal bronchial epithelial cell showing individual cilia strands is observed in Figure 4 demonstrating the resolution of the Cell-CT.
Figure 4.
Throughput
The Cell-CT is currently capable of producing several hundred high-resolution 3D cell images per hour. In research modes, the instrument can store 0.5 terabytes of cell information per hour for later analysis.
Wafer Test
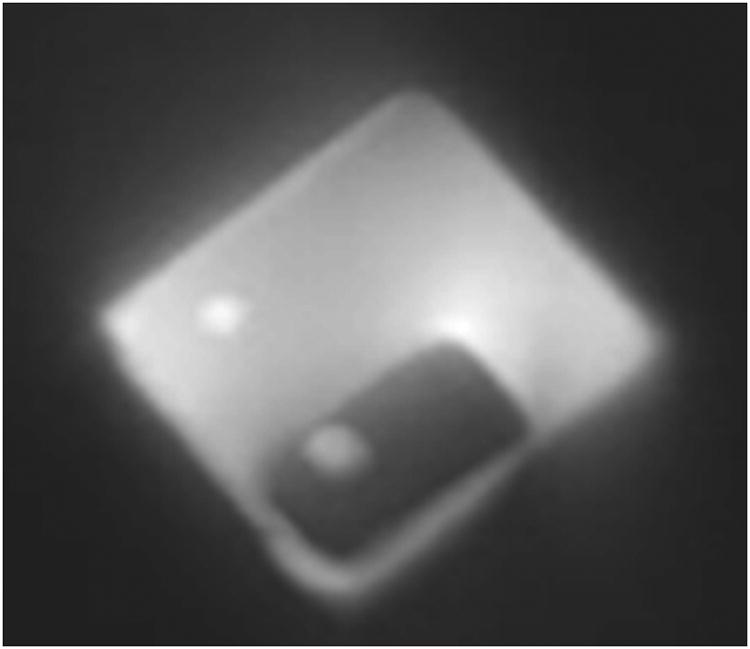
LuCED incorporates a 3D self-test reference object, the “wafer”, which is added to each specimen and imaged to ensure that the Cell-CT is operating within normal parameters. The wafer is a micro-fabricated two-layer silicon chip which is 10 microns square. The wafer flows through the capillary tube just like cells, presenting the Cell-CT with necessary imaging and sample handling features to effect instrument calibration; as well as to test its imaging, focus, motion, fluidic stability, and timing. An image of the wafer is shown in Figure 5.
Figure 5.
Cell Classification
The full potential of the Cell-CT technology arises from automated 3D cell analysis, which can detect cell features that are too subtle or too complex for human reviewers. Automated classification eliminates highly variable human review of specimens. Moreover, classification based on 3D images sidesteps inherent limitations associated with classification based on standard 2D, fixed focal plane images, as the 2D slice may not carry the essential image information to comprehensively identify the cell disease state (14). Cell classification has the potential to automatically identify a few rare abnormal cells from the thousands of normal cells that are processed by LuCED.
Several cell classification algorithms make up the LuCED test. Figure 6 shows a diagram of the algorithm processing flow.
Figure 6.
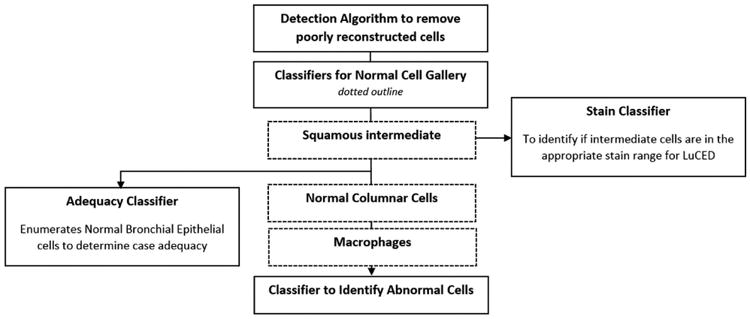
The classification steps include:
Classifier to detect poor reconstructions: The Cell-CT system includes a means to correct for motion arising during image capture. Most cell images emerge from filtered back-projection in a well-reconstructed way. This algorithm identifies cells that were poorly reconstructed so they can be rejected from further processing.
Normal cell gallery: These classifiers identify normal cells to serve as a reference point for human identification of abnormal cells using CellGazer. There are three classifiers that identify these normal cell types: normal squamous intermediate cells, normal columnar epithelial cells, and normal macrophages.
Stain classifier: This classifier processes cells identified by LuCED as squamous intermediate cells. The nucleus of a squamous intermediate cell has constant ploidy, making its overall integrated greyscale optical density value an ideal means to assess whether specimen staining is in the correct range for optimal absorption contrast.
Adequacy classifier: This classifier enumerates normal bronchial epithelial cells and is used to determine if the processing of the specimen is adequate based on overall cell numbers (see Figure 8).
Abnormal Cell Classifier: Most importantly, the LuCED test includes a classifier to identify cells having abnormal characteristics. These cells (typically 0.5% of all cells processed) go on to be examined by a pathologist using the CellGazer workstation.
Figure 8.
Classifier Training – Inputs and Methods
Creation and optimization of these classifiers is generally referred to as “classifier training,” as the process aims to accurately diagnose cells according to a reference or ground truth. There are two aspects to accuracy: first is specificity (normal cells being called normal by the classifier), and second is sensitivity (abnormal cells being called abnormal by the classifier). Algorithm training methods include proprietary techniques that have been developed at VisionGate and other methods used elsewhere to address machine learning problems that are encountered in face recognition and voice recognition. These methods include Adaptively Boosted Logistic Regression (18) and Random Forest (19).
The methods used to train the classifier ensure the best possible outcome given the data used as input. Primarily, classifier accuracy is ensured when the inputs to the classifier training process accurately describe clinically relevant aspects of the cells and are robust to environmental factors that could influence Cell-CT results:
As shown by Figure 4, three-dimensional cell images generated by the Cell-CT have high resolution, allowing precise measurements of critical features that support correct classification.
Some features that are useful in classification emerge only in the 3D image (17). Consequently, the 3D feature set is not only more descriptive of the cell but also richer making classification based on three-dimensional imaging more accurate versus 2D imaging (16).
Three-dimensional, image segmentation algorithms have been developed to isolate the whole cell from the background and the nucleus from the cell. The accuracy of these segmentation algorithms was verified by comparing the segmented trace with human derived cell or nuclear envelope traces.
Feature measurements describe various aspects of the cell, cell nucleus, cytoplasm and cell nucleoli. 594 features are computed for each 3D cell image that represent object shape, volume, distribution of chromatin, and other, more subtle morphometric elements. Computation of these features has been verified to be independent of the orientation of the cell.
Diagnostic truth (the gold standard of pathology) for the classifier training is based on hierarchical cell diagnoses provided by two cytotechnologists and a cytopathologist. Users of CellGazer must first complete a training and testing program that emphasizes performance on cells that have been adjudicated to be normal or abnormal.
Classifier Training – Statistical Considerations
Secondarily, accuracy of the classifier training process was ensured through a rigorous process that encompassed three aspects:
The database that was used to train the classifier was formulated to contain sufficient material to ensure that binomial 95% confidence intervals (21) maintain variance of performance estimates within acceptable bounds.
Over-training is one potential pitfall of the training process where too much information could be included into the classifier so that the result could become over-specialized to the data used in the training. This situation generates an overly optimistic estimate for classifier performance. The risks of over-training can be mitigated through cross-validation (20) which involves taking a portion of the training data and using it as testing data. Limits for the amount of information that can be used in the classifier are reached when performance estimates based on training data exceed the estimates from testing data
Finally, as further assurance against over-training, the classifier was tested on data from a second set of cells that were not a part of the training process.
Abnormal Cell Classifier Training Summary
The Classifier training process is illustrated for the abnormal cell classifier. These considerations were used to define the parameters governing the training for the LuCED abnormal cell classifier:
Since abnormal cells in LuCED are scarce, and non-diagnostic elements in sputum are plentiful the classifier must operate with high sensitivity and very high specificity. As described later in Table 4, high case detection sensitivity is maintained when the single cell classifier sensitivity is 75% and the specimen contains more than one abnormal cell.
To ensure workload for LuCED is maintained within reasonable limits, the goal for LuCED specificity was set at 99%.
Intervals for the lower binomial 95% confidence bound (21) were to be maintained within 70% for sensitivity and within 98.5% for specificity.
Table 4. Relationship between cell sensitivity, number of abnormal cells in the analysis and case sensitivity.
| Number of Abnormal Cells in the analysis | Case sensitivity based on 71% individual cell sensitivity (%) |
|---|---|
| 1 | 71.0 |
| 2 | 91.6 |
| 3 | 97.6 |
Based on these considerations, the training required at least 325 abnormal cells and 2,500 normal objects.
Table 1 gives the cell counts used to train the LuCED abnormal cell classifier and shows the above requirements were met.
Table 1. Numbers of cell image sets used to train the LuCED abnormal cell classifier.
| Cell Type | Numbers of Cells |
|---|---|
| Abnormal | 554 |
| Normal | 23,626 |
The LuCED Receiver Operator Characteristic (ROC) curve in Figure 7 shows that LuCED meets performance objectives. Moreover, the numbers of samples in the training set indicated in Table 1 supports this classification performance within a very narrow binomial 95% confidence interval. Table 2 shows that sensitivity and specificity of LuCED with confidence intervals (21) meets the minimum intended goal.
Figure 7.
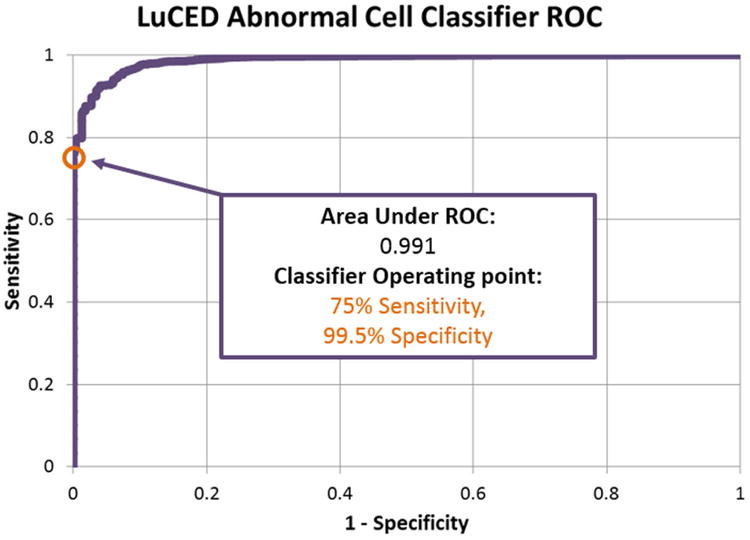
Table 2. LuCED abnormal cell classifier performance values for classifier training.
| Performance Category | Measured Value (%) | 95% Confidence Interval (%) | Goal for lower 95% confidence bound (%) |
|---|---|---|---|
| Single Cell Sensitivity | 75 | 71 - 79 | 70 |
| Single Cell Specificity | 100 | 99.5 - 99.6 | 98.5 |
The performance shown in Table 2 has also been verified using cells that were not included in the classifier training. Table 3 shows that performance projections based on training generalized to the cell population at large.
Table 3. LuCED abnormal cell classifier values for testing.
| Performance Category | Cell Type | Number of Cells | 95% Confidence Interval (%) |
|---|---|---|---|
| Sensitivity | A549 | 26,717 | 86.0 - 86.8 |
| Specificity | Cells from sputum collected from normal patients |
35,419 | 99.5 - 99.7 |
Note that in Table 3, that the A549 (American Type Culture Collection, Manassas, Virginia) cell line was used to test the classifier sensitivity. A549 is a cell line generated from a lung adenocarcinoma. As noted in Table 6 below, LuCED is trained to identify many different abnormal cell types. Adenocarcinoma and squamous cancer cells (including A549 cells) have the most distinctive features and are identified at a greater rate than the baseline 75% shown in Table 2.
Table 6. Cell types that LuCED is trained to recognize for CellGazer review.
| Cell Category | Specific Cell types |
|---|---|
| Cancer | Squamous cancer (keratinizing and non-keratinizing), adenocarcinoma, small cell cancer. |
| Other abnormal cells | Moderate and Marked dysplasia, Alveolar Pneumocyte (Type II), Columnar Cell – Atypical, Goblet Cell – Atypical, Pleomorphic Parakeratosis. |
In the end, we desire a high detection rate for each positive case. Sensitivity of single cell detection translates to detection of the abnormal case as shown in Table 4. The LuCED abnormal classifier operates with an individual cell sensitivity of 75% at 99.5% specificity. The lower 95% binomial confidence bound for sensitivity indicated by Table 2 is 71%. Assuming independence of cell analysis, case sensitivity may be computed based on the probability of detecting any one cell and the knowledge of the number of abnormal cells that appear in the analysis. Independence is a good assumption since the Cell-CT processes cells one-at-a-time. Alternatively, factors relating to specimen processing or the fact that cells are from the same part of the lesion might influence scoring of the cells from a case. As a conservative measure against an overly optimistic estimate of case detection performance based on cell detection sensitivity, we have estimated case detection sensitivity using the lower 95% confidence bound for individual cell detection sensitivity. Using this conservative figure, we can estimate the case detection sensitivity based on the number of abnormal cells encountered during the analysis. For example, if only one abnormal cell was encountered, the lower limit of case sensitivity would be 71%. If two abnormal cells were encountered the case sensitivity would be 100% * (1 – 0.29*0.29) = 91.6%. This trend of case detection vs. number of abnormal cells encountered is shown in Table 4.
The implications of Table 2, Table 3, and Table 4 are important for LuCED. Results shown in these tables indicate that if an abnormal cell is in the group analyzed by LuCED, it will be confidently detected so that the case will be identified with high sensitivity. This leaves the question of abnormal cell presence in the LuCED analysis as the remaining factor determining the cancer detection rate.
Specimen Adequacy
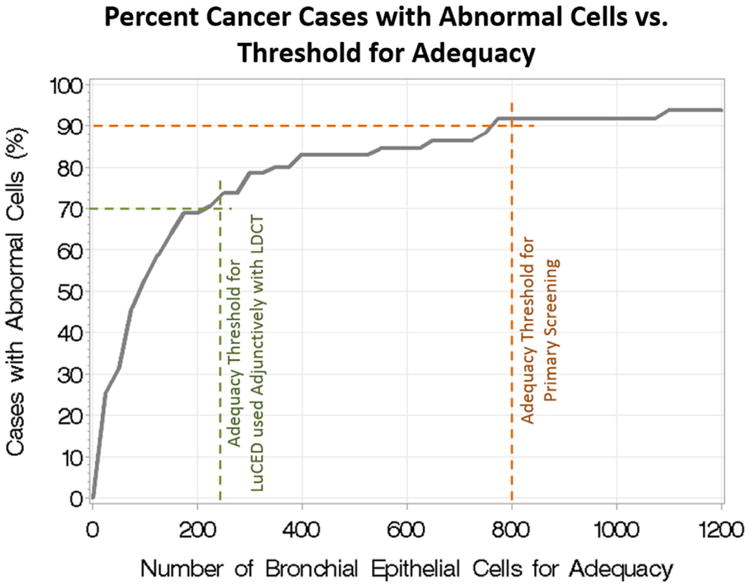
Because sputum is a highly variable specimen from patient to patient, a means is needed to evaluate whether the cells analyzed by LuCED comprise sufficient lung sampling for disease detection. Classical sputum adequacy is assessed based on the presence of abundant alveolar macrophages (22); however, these cell types are not preserved through the LuCED cell enrichment process. Furthermore, prior evaluations of the relationship between macrophage presence and abnormal cell presence in sputum have not given confidence in this adequacy determination method. Consequently, LuCED adequacy is based on an enumeration of normal bronchial epithelial cells including metaplastic cells and columnar cells. As noted above, LuCED automatically enumerates these cells so that a separate manual analysis for adequacy is not required. As noted, LuCED specimen processing removes non-diagnostic elements in the sputum. This processing has the effect of randomizing the cellular content within the enriched cell pellet. This implies that the likelihood of encountering an abnormal cell during LuCED analysis of a specimen from a cancer patient depends primarily on the ratio of abnormal cells with the number of normal cells in the sample and the number of normal cells processed by LuCED. This ratio depends on many factors including the lesion size, dynamics of the cough, etc. Case detection then becomes primarily dependent on processing enough normal bronchial epithelial cells so that the abnormal cells are also processed. The relationship between the number of cases with abnormal cells and the number of normal bronchial epithelial cells in the analysis is shown in Figure 8. Note that the trend in Figure 8 is valid for specimens produced through spontaneous coughs. Since induction changes cough dynamics, a different curve would likely need to be created for specimens collected through induction.
Use of LuCED depends on how the test is integrated with clinical practice. There are two modes: primary screener and adjunct with LDCT. In primary screening mode, LuCED is used as a first line screener with the goal of detecting lung cancer before it advances to an invasive condition. In this mode, LuCED sensitivity is set to be greater than 90 percent (23). Referring to the graph in Figure 8, this level of sensitivity happens when LuCED has processed 800 normal bronchial epithelial cells. Thus, for primary screening, 800 is the required number of normal bronchial epithelial cells for adequacy. In Adjunct mode, LuCED follows LDCT to determine which positive cases from LDCT truly have abnormal cells, a lower LuCED sensitivity of 70% is acceptable, since the clinician would be availed of two orthogonal screening results. Referring to Figure 8 above, a LuCED sensitivity of 70% could be achieved when 250 normal bronchial epithelial cells have been identified.
To summarize, LuCED has two modes of operation with the conditions for adequacy and the expected case sensitivity given in Table 5.
Table 5. Description of LuCED test modes.
| LuCED Mode | Number of normal bronchial epithelial cells required for adequacy |
Expected LuCED sensitivity (%) |
|---|---|---|
| Primary Screening | 800 | >90 |
| Adjunctive use with x-ray CT | 250 | >70 |
After reaching the adequacy criterion with no identification of any abnormal cells, the test may be safely terminated and the case called normal. Note that discovery of an abnormal cell by LuCED obviates considerations of adequacy. In this case, an abnormal result is reported by LuCED.
Cell Gazer
The CellGazer workstation is driven by VisionGate's proprietary software used by cytotechnologists and pathologists to view and attach diagnostic labels to each cell image that the Cell-CT has classified as potentially abnormal.
The system allows the user to select a cell for viewing and examine it in multiple ways.
The Image Stack presents a black and white cell image with interactive focusing and image enhancing tools that allow the user to focus up and down through all of the focal planes as if the cell were being viewed through a light microscope. An example of the Image stack display is shown in Figure 9.
Volume Interaction allows interactive viewing of the 3D cell image. The user may rotate the cell image to allow viewing from any perspective. The cell may be digitally sectioned for more detailed examination. Two images of the cell shown in Figure 9 are also shown represented in maximum intensity from two perspectives in the 3D cell viewer of CellGazer in Figure 10.
Figure 9.
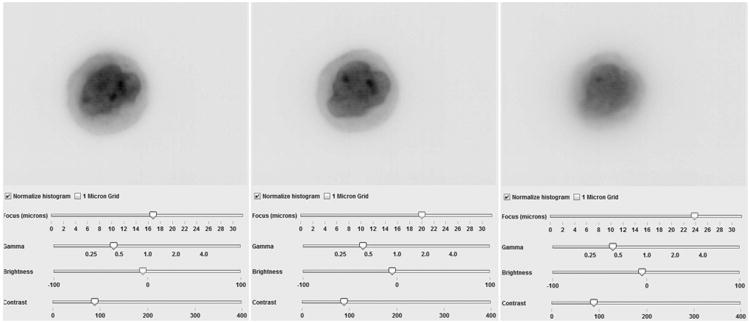
Figure 10.
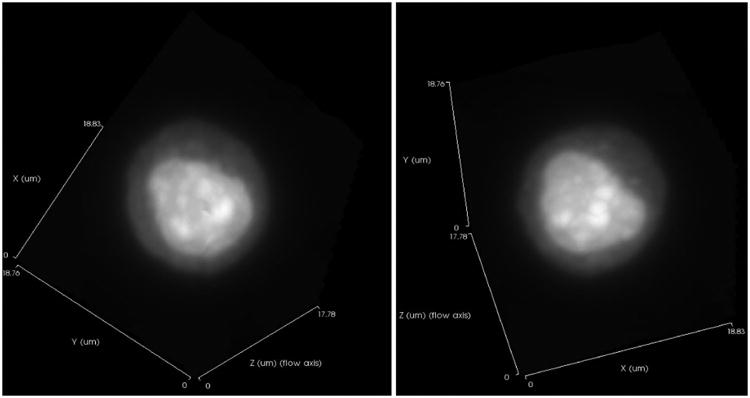
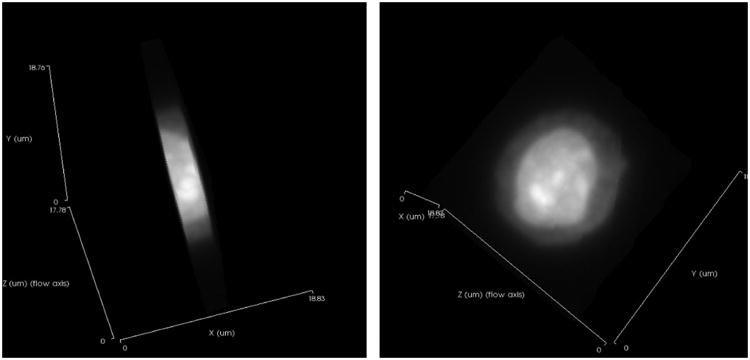
Using the Volume Interaction utilities, the cell image at right in Figure 10 was cropped and then rotated to show the face of the cell in Figure 11.
Figure 11.
For each sputum specimen, the LuCED test presents the cytologist with all cells that are positive by the LuCED abnormal classifier. Also shown is a gallery of squamous intermediate cells, normal macrophages, and normal columnar cells identified by LuCED cell classifiers. The normal cell gallery is intended to show the cytologist the specimen's normal cellular characteristics to use as a reference when determining if a classifier-identified potentially abnormal cell is truly abnormal.
Typically, a cytotechnologist first reviews the potentially abnormal classifier-identified cells, followed by hierarchical cytopathologist confirmation of the abnormal status for any cells flagged as suspect. This process can involve detailed labels to indicate the cell type and degree of abnormality. For the purposes of the LuCED test, all malignant and premalignant cells are considered abnormal. The complete list of abnormal cell types for LuCED is as listed in Table 6. Because the classifiers identify 99.5% of normal cells as such, the number of potential abnormal cells presented to manual observers is typically small. Thus, manual review is not a time consuming process, generally taking no longer than 10-15 minutes per case in practice.
LuCED Test Result
The final result of the LuCED test is summarized in the test report, generated automatically from data gathered during specimen receipt, preparation, Cell-CT processing and CellGazer review. There are three possible outcomes:
Specimen processing reaches adequacy and no abnormal cells were discovered – Case status is adequate: normal.
During processing at least one abnormal cell was discovered – Case status is: abnormal cells discovered.
Processing of the specimen did not discover abnormal cells and did not reach adequacy – Case status is inadequate.
This report is taken into context with other patient factors to inform the clinician as the next steps in patient care are being considered, including the recommendation for sputum induction.
Conclusion
This paper describes the LuCED test for the detection of early lung cancer. The LuCED test is based on patient sputum which is processed by the Cell-CT platform that produces isometric, sub-micron resolution 3D cell images that are then interrogated by automated feature extraction and classification algorithms to identify abnormal cells in sputum with high accuracy. Since abnormal cells are rare in sputum and non-diagnostic contaminants are plentiful, only a system capable of cell detection with high sensitivity and very high specificity can manage the lung cancer detection in sputum in an efficient way. LuCED has the potential for use as a primary screener for lung cancer and also as a test to use adjunctively with LDCT to reduce false positives and costs of screening by LDCT alone.
Acknowledgments
This work was funded through private investment and an NIH grant 1RC3GM093818-01, “Development of high-throughput, commercially viable, Cell-CT instrument with initial applications to lung cancer and research”.
Footnotes
Disclosures: Michael Meyer, Jon Hayenga, Rahul Katdare, Chris Presley, David Steinhauer, Timothy Bell, Christy Lancaster and Alan Nelson are all employees of VisionGate, Inc., Phoenix, AZ.
Thomas Neumann, M.D. is a former employee of VisionGate, Inc.
References
- 1.NCI. The National Cancer Act of 1971. The National Cancer Institute; [Accessed March 19, 2015]. Retrieved from. URL http://legislative.cancer.gov/history/phsa/1971. [Google Scholar]
- 2.Jemal A, Siegel R, Ward E, et al. Cancer statistics, 2008. CA Cancer J Clin. 2008;58:71–96. doi: 10.3322/CA.2007.0010. [DOI] [PubMed] [Google Scholar]
- 3.Aberle D, Adams A, Berg C, Black W, Clapp J, Fagerstrom R, et al. Reduced Lung-Cancer Mortality with Low-Dose Computed Tomographic Screening. New England Journal of Medicine. 2011;365(5):395–409. doi: 10.1056/NEJMoa1102873. [DOI] [PMC free article] [PubMed] [Google Scholar]
- 4.Mulcahy N. [Accessed March 19, 2015];It's Final: CMS to Cover Lung Cancer Screening. Retrieved from Medscape, URL http://www.medscape.com/viewarticle/839363.
- 5.Freedman N, Leitzmann M, Hollenbeck A, Schatzkin A, Abnet C. Cigarette smoking and subsequent risk of lung cancer in men and women: analysis of a prospective cohort study. Lancet Oncology. 2008;9(7):649–656. doi: 10.1016/S1470-2045(08)70154-2. [DOI] [PMC free article] [PubMed] [Google Scholar]
- 6.Yurkiewicz S. [Accessed March 19, 2015];New Lung Ca Screening Criteria Reduce False Positives. Retrieved from MedPageToday: URL http://www.medpagetoday.com/Pulmonology/LungCancer/49940.
- 7.Schreiber G, McCrory D. Performance Characteristics of Different Modalities for Diagnosis of Suspected Lung Cancer. Chest. 2003;123(1):115S–128S. doi: 10.1378/chest.123.1_suppl.115s. [DOI] [PubMed] [Google Scholar]
- 8.Böcking A, Biesterfeld S, Chatelain R, Gien-Gerlach G, Esser E. Diagnosis of Bronchail Carcinoma on Sections of Parraffin-Embedded Sputum. Acta Cytologica. 1992;36(1):37–47. [PubMed] [Google Scholar]
- 9.Neumann T, Meyer M, Patten F, Johnson F, Erozan Y, Frable J, et al. Premalignant and Malignant Cells in Sputum from Lung Cancer Patients. Cancer Cytopathology. 2009;117(6):473–481. doi: 10.1002/cncy.20052. [DOI] [PubMed] [Google Scholar]
- 10.Paggiaro P, Chanez P, Holz O, Ind P, Djukanović R, Maestrelli P, et al. Sputum Induction. European Respiratory Journal. 2002;20(37):3S–8S. doi: 10.1183/09031936.02.00000302. [DOI] [PubMed] [Google Scholar]
- 11.Pedersen B, Brøns M, Holm K, Pedersen D, Lund C. The value of provoked expectoration in obtaining sputum samples for cytologic investigation. A prospective, consecutive and controlled investigation of 134 patients. Acta Cytologica. 1985;29(5):750–752. [PubMed] [Google Scholar]
- 12.Fauver M, Seibel E, Rahn JR, Meyer M, Patten F, Neumann T, Nelson A. Three-dimensional imaging of single isolated cell nuclei using optical projection tomography. Optics Express. 2005;13(11):4210–4223. doi: 10.1364/opex.13.004210. [DOI] [PubMed] [Google Scholar]
- 13.Deans S. The Radon Transform and some of its applications. Malabar: Dover; 2007. [Google Scholar]
- 14.Raswiki. [Accessed March 19, 2015];Maximum intensity projection (MIP) Retrieved from Radiopaedia.org URL http://radiopaedia.org/articles/maximum-intensity-projection-mip.
- 15.Dartmouth. [Accessed March 19. 2015];Cilia and Flagella. 2004 Retrieved from www.dartmouth.edu: URL http://www.dartmouth.edu/∼cbbc/courses/bio15/2004W/slides/L13.pdf.
- 16.Meyer M, Fauver M, Rahn JR, Neumann T, Patten F, Seibel E, Nelson A. Automated cell analysis in 2D and 3D: A comparative study. Pattern Recognition. 2009;42(1):141–146. [Google Scholar]
- 17.Meyer M, Patten F, Presley C, Neumann T, Nelson A. Three-Dimensional Cellular Morphometry: A New Horizon for Cytology and Cancer Detection. Journal of the American Society of Cytopathology. 2012;1(1):6–7. [Google Scholar]
- 18.Schapire R, Freund Y. Boosting, foundations and algorithms. Cambridge: MIT press; 2012. [Google Scholar]
- 19.Breiman L. Random Forests. Machine Learning. 2001;45(1):5–32. [Google Scholar]
- 20.Geisser S. Predictive Inference. New York: Chapman and Hall; 1993. [Google Scholar]
- 21.Clopper C, Pearson E. The use of confidence fiducial limits illustrated in the case of the binomial. Biometrika. 1934;26(4):404–413. [Google Scholar]
- 22.Mody, D. Retrieved from www.cap.org: URL http://www.cap.org/apps//cap.portal?_nfpb=true&cntvwrPtlt_actionOverride=%2Fportlets%2FcontentViewer%2Fshow&_windowLabel=cntvwrPtlt&cntvwrPtlt%7BactionForm.contentReference%7D=cap_today%2Fpap_ngc%2FNGC0803_adequacy.html&_state=maximized&_pageLabel=cntvwr [Accessed March 19, 2015]
- 23.Meyer M, Katdare R, Presley C, Wilbur D, Neumann T, Hayenga J, et al. Early detection of lung cancer based on three-dimensional, morphometric analysis of cells from sputum. Journal of Clinical Oncology. 2014;32:5s. [Google Scholar]


