Abstract
Doubled haploids are routinely created and phenotypically selected in plant breeding programs to accelerate the breeding cycle. Genomic selection, which makes use of both phenotypes and genotypes, has been shown to further improve genetic gain through prediction of performance before or without phenotypic characterization of novel germplasm. Additional opportunities exist to combine genomic prediction methods with the creation of doubled haploids. Here we propose an extension to genomic selection, optimal haploid value (OHV) selection, which predicts the best doubled haploid that can be produced from a segregating plant. This method focuses selection on the haplotype and optimizes the breeding program toward its end goal of generating an elite fixed line. We rigorously tested OHV selection breeding programs, using computer simulation, and show that it results in up to 0.6 standard deviations more genetic gain than genomic selection. At the same time, OHV selection preserved a substantially greater amount of genetic diversity in the population than genomic selection, which is important to achieve long-term genetic gain in breeding populations.
Keywords: genomic selection, haplotype, genetic gain, genetic diversity, doubled haploid, shared data resource, GenPred
THE creation of doubled haploids is an important component of many plant breeding programs (Mohan Jain et al. 1996). It allows for the creation of completely homozygous individuals from heterozygous plants and therefore can substantially shorten the time from variety development to commercialization. Choosing the best doubled haploid for inclusion in breeding programs or varietal development is most commonly accomplished by phenotypic selection.
An alternative way to increase selection efficiency is through the use of genomic selection. Genomic selection is a statistical method of genetic evaluation that uses phenotypic (e.g., trait observations such as disease resistance and quality attributes) and genomic data (Meuwissen et al. 2001). It results in trait effect estimates for all markers and their sum produces a genomic estimated breeding value (GEBV) for an individual. The usual implementation of genomic selection requires a reference population with phenotypes and genotypes where marker effects are estimated, the so-called prediction equation. This prediction equation can then be applied to individuals with only genotypes to predict a GEBV. The main advantage of genomic prediction is that an individual’s genomic breeding values can be accurately predicted before it exhibits a phenotype, such as the juvenile plant, embryo, or tissue. Such early selection decisions could potentially increase genetic gain, shorten breeding cycles, and reduce growing costs as inferior individuals can be eliminated before expensive field trials.
An individual’s genomic breeding value is the sum of all allele effects. However, the doubled haploids that could be produced from a heterozygous parent vary because different combinations of haplotypes can be inherited and then doubled. Certain combinations of haplotypes would be vastly superior to others because, by chance, they combine the best alleles. The concept of the best combination of haplotypes has been discussed in terms of selection limits and selection for the ultimate animal. In outbred species such as cattle, haplotype values were calculated and the best possible bull was predicted (Cole and Vanraden 2010, 2011). Similarly, in silico selection programs made use of genetic algorithms to breed the ultimate cow that contained the best haplotypes (Kemper et al. 2012). In fish, a simulation study exploited certain combinations of doubled haploids in the genomic selection reference population to increase genomic prediction accuracy (Nirea et al. 2012).
However, to the best of our knowledge, no study has combined the selection of best haplotypes and the production of elite doubled haploids. We propose the selection of individuals for genomic optimal haploid value (OHV), which is the best doubled haploid that could be produced from an individual. We show with computer simulation that this method of selection increases both genetic gain and genetic diversity when compared to genomic selection.
Materials and Methods
An important step in a breeding program using genomic selection is the estimation of marker effects. This is also true in OHV selection. Any method that estimates marker effects can be used, such as ridge regression BLUP, BayesA, BayesCπ, or BayesR (Meuwissen et al. 2001; Habier et al. 2011; Erbe et al. 2012), because the estimation step of the marker effects is identical in genomic selection and OHV selection. The two methods differ only in how they predict the genetic value of individuals (potential doubled haploid individuals in the case of OHV). As shown by Meuwissen et al. (2001), an individual’s GEBV is the sum of all marker effects across the entire genome,
where l is the number of loci genome-wide; is the individual’s genotype at locus j taking values of 0, 1, or 2; and is the marker allele substitution effect at locus j. As the name implies, the calculation of OHV requires considerations relating to the optimum and the haplotype. The key difference between GEBV and OHV is that GEBV is the realized genetic value (after Mendelian sampling), while the OHV is the best future predicted breeding value that can result from an individual when doubled haploids are produced from it, given Mendelian sampling is such that the best chromosome segments are inherited and doubled at each position in the genome. The ploidy level of an individual determines the number of haplotypes it carries at any given position. In the following we assume diploidy, but extension to polyploidy is simple. In OHV selection, haplotype values (HV) are calculated for both haplotypes in a genomic segment,
where m is the total number of loci in the haplotype or OHV segment, k is the locus within the segment, and is the individual’s haplotype at locus k, taking values of 0 or 1. The length of the haplotype considered can be varied and optimized to maximize genetic gain. To calculate the OHV we gather the best (optimal) HV in each segment and sum them over segments,
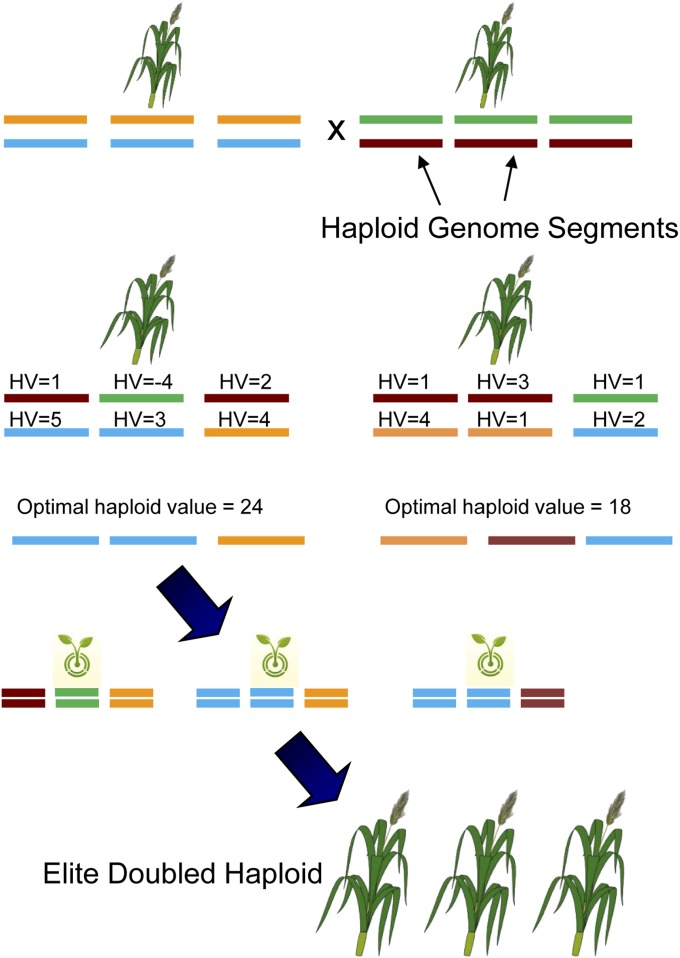
where n is the number of OHV segments, and o is the genomic segment. Multiplication by 2 allows direct comparisons with the GEBV and fully shows the genetic level of the potential doubled haploid. Cole and Vanraden (2011) presented equations that calculate selection limits at the population level. In contrast, our equations compute the selection limit at the level of the individual (i.e., OHV). The OHV of an individual is always equal or greater than its GEBV. The OHV of a completely homozygous (inbred) plant is equal to its GEBV, because the best doubled haploid that can be produced will be constant regardless of which haplotypes were chosen. Thus, OHV selection differentiates itself from genomic selection only in segregating individuals (crosses, F2’s, etc.). Computation of OHV is applicable wherever genomic selection was considered previously and no extra genotyping or phenotyping is necessary. Figure 1 outlines how OHV selection could be applied in a breeding program. First, outbred individuals are genotyped and their HV and OHV are calculated. Second, the best OHV plants are selected for doubled haploid production. Third, doubled haploid seedlings are genotyped and their GEBVs are predicted. The best will become the new elite variety and/or are used for further breeding.
Figure 1.
An example of applying optimal haplotype value (OHV) to develop a new wheat variety. Two heterozygous parents are crossed, each offspring is genotyped, and haplotype values (HV) and OHV are calculated in silico, leading to selection of elite individuals from which to produce doubled haploids. All doubled haploids are genotyped, their genomic breeding values are predicted, and the doubled haploid with highest genetic value is the new elite individual. Note that the line with the highest OHV may not be the plant with the highest average genomic breeding value.
Breeding program simulation
Computer simulations were performed to compare genomic selection and OHV selection in bread wheat. A key component for genomic selection is the linkage disequilibrium (LD) structure of the population. We used the empirical Illumina iSelect Bead Chip 9K array genotypes (Cavanagh et al. 2013) of 1110 wheat lines that are publicly available from the Triticeae Coordinated Agriculture Project (TCAP 2014). This ensured that the LD structure and allele frequency distribution in our base population closely matched those of a contemporary wheat population. Removal of individuals and SNPs with >10% missing data reduced the number of subgenome-specific SNPs (e.g., A, B, and D genomes) to 4788. The SNPs were placed on 21 chromosomes (i.e., three subgenomes, each with 7 chromosomes) and each chromosome measured 150 cM. Missing genotypes were not imputed. Crossovers were randomly placed on the genome at a rate of 1/M during the creation of gametes, either in conventional offspring or during creation of doubled haploids. Various haplotype or OHV segment lengths were investigated.
QTL were selected at random and marker effects were sampled from a double exponential distribution. The marker effects were assumed to be known without error, which is valid for the main purpose of this study that compared genomic and OHV selection. Inaccuracy in marker effect estimation was assumed to affect both genomic selection and OHV selection equally. However, the total genetic gain achieved in this study is higher than in actual genomic selection-based breeding programs where inaccuracy of marker effects reduces genetic gain. Program executable and example files are available on github (Daetwyler 2015).
Breeding program
Two breeding scenarios were simulated: genomic selection (GS), where selection was based on GEBVs, and OHV, where selection was based on optimal haploid values. All parameters, such as selection intensity, were the same between GS and OHV and the only difference was that selection was either on GEBV or OHV.
The generic breeding program was as follows and specific scenarios are described subsequently. Of the initial inbred 1110 lines, the best 30% were used as parents of the F1 generation to achieve a population size of 55,000 individuals (Figure 1, Figure 2). Every selected inbred line was crossed with all other selected lines. One progeny was then genotyped per cross (as all were identical) and the top individuals were selected to produce the next generation (F2). In the outbred F2–F10 generations it was assumed that each individual could be mated only to only one other individual due to limited seed. All mating was random. The number of offspring per outbred cross was varied and the total breeding population was kept constant at 55,000 individuals by varying selection intensity. In each generation, the most elite plants were selected for doubled haploid production and a varied number of doubled haploids were produced. The most elite doubled haploids could optionally be used for breeding two generations later to account for the time lag for creation and doubled haploid seed collection. This was then repeated for several generations and in each generation OHV and GEBV were recalculated, which captured new recombination events.
Figure 2.
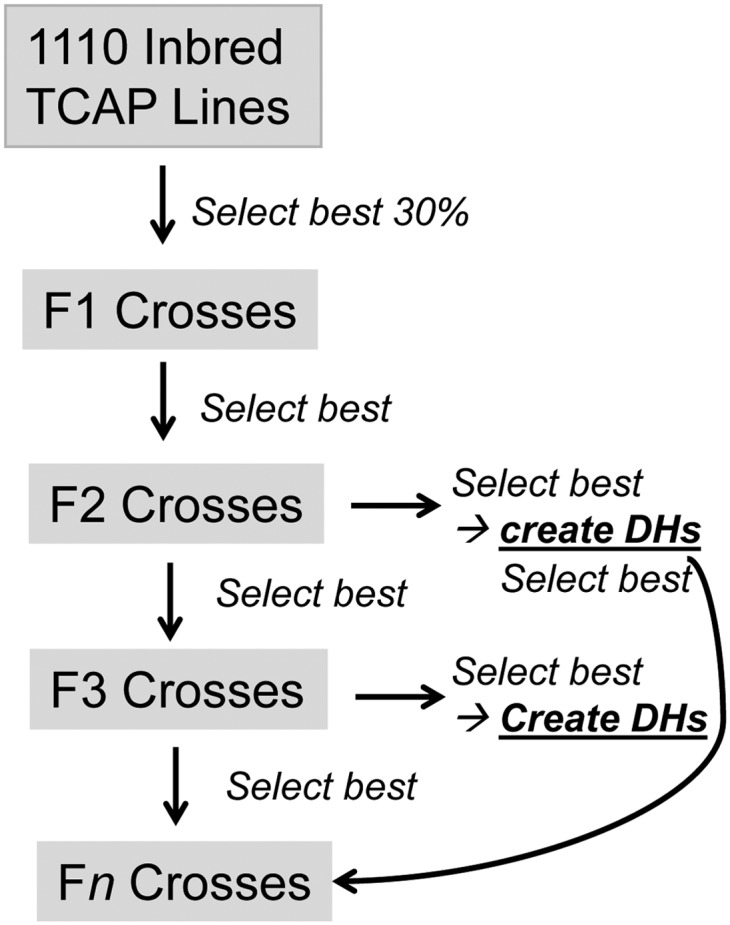
Generic genomic breeding program design, where DH is doubled haploid, and n is number of generations. Selection was on either optimal haploid or genomic estimated breeding value. Elite doubled haploids can be cycled back into the breeding population in the second generation after creation.
Investigated scenarios
In the DEFAULT scenario 100 offspring were produced per outbred cross, 10 elite individuals were selected to create 100 doubled haploids each, and the best 50 doubled haploids were cycled back into the breeding program. Various scenarios investigated the number of offspring produced per outbred cross (nOff), elite individuals selected to produced doubled haploids (nEliteInd), doubled haploids produced per elite individual (nDH), elite doubled haploids cycled back into the breeding program two generations later (nDHcycled), QTL simulated (nQTL), haplotype segments per chromosome (nSeg), and the number of generations (nGen). All scenario groups and levels within are listed in Table 1. Each scenario was replicated 100 times and standard errors (SE) are given in figure legends. The results on genetic gain focus on the difference between OHV and GS in genetic standard deviations (SD) of the base generation (i.e., gain OHV – gain GS), where “gain” was defined as the mean GEBV across 100 replicates of the best doubled haploid in a generation for each method divided by the mean genetic base standard deviation across replicates. The proportion of additional genetic gain from OHV selection was calculated for one scenario ((gain OHV – gain GS)/gain GS). Genetic diversity is reported as the true genetic variance, calculated as the variance of all GEBVs in a generation.
Table 1. The scenario groups investigated with description and a list of levels.
| Scenario group | Variation | Levels |
|---|---|---|
| DEFAULT | Default scenario | nOff 100, nEliteInd 10, nDH 100, nDHcycled 50, nQTL 500, nSeg 3, nGen 10 |
| nOff | No. offspring per outbred cross | 10, 20, 50, 80, 100, 200, 500, 1000 |
| nEliteInd | No. elite individuals chosen to produce DHs | 1, 5, 10, 20, 50, 100 |
| nDH | No. DHs produced per elite individual | 10, 20, 50, 80, 100, 200, 500, 1000 |
| nDHcycled | No. DHs cycled back into breeding program | 0, 10, 20, 50, 80, 100, 200, 500 |
| nQTL | No. QTL simulated | 100, 500, 1000 |
| nSeg | No. haplotype segments per chromosome | 1, 2, 3, 6, 12 |
| nGen | No. generations | 10, 20 |
Levels in boldface type relate to the DEFAULT scenario. Only one parameter was perturbed at a time.
Results
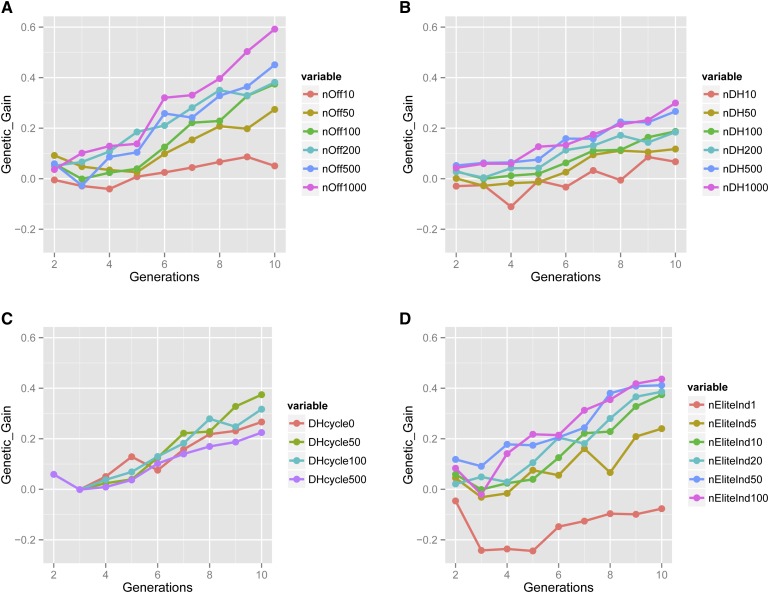
Selection on OHV resulted in increased genetic gain over genomic selection in scenarios where sufficient recombination events were accumulated. In our simulated breeding program recombination occurred in the creation of offspring and doubled haploids. Thus, if we increase the opportunity of recombination, by increasing either the number of offspring or the number of doubled haploids, we can increase the probability that good haplotypes are combined. There was a clear and increasing advantage in genetic gain of OHV as the number of offspring is increased (Figure 3A, Supporting Information, Table S1). As the breeding programs progressed through generations, OHV increasingly outcompeted GS to yield additional genetic gain, which further underlined the need to accumulate and combine recombination and selection events to maximize genetic gain. A maximum difference of 0.6 genetic SD was observed with 1000 offspring in generation 10. As the number of doubled haploids produced from the 10 best individuals was increased, the difference between OHV and GS also increased (Figure 3B, Table S2).
Figure 3.
(A–D) Difference in genetic gain (Genetic_Gain) in base genetic SD between optimal haploid value (OHV) selection and genomic selection (GS), when (A) varying the number of offspring per outbred cross (nOff, SE < 0.21), (B) varying the number of doubled haploids produced per elite plant (nDH, SE < 0.08), (C) varying the number of elite doubled haploids cycled back into the breeding program (nDHcycled, SE < 0.15), and (D) varying the number of elite individuals taken to doubled haploid production (nEliteInd, SE < 0.23).
The number of elite individuals chosen for doubled haploid production affected the superiority of OHV less than the number of offspring per cross and it also depended on the relative superiority of the selected top individuals to the next group of top ranked individuals. We found an increase in the difference between OHV and GS when the number of elite plants was increased (Figure 3D, Table S4). However, the difference was well within the SE once ≥10 individuals were selected. This result was in part due to our program not producing vastly superior outliers (data not shown), as we simulated a large number of QTL. Therefore, the top group was similar in genetic merit and selecting more of them will increase the probability (by chance) that a doubled haploid will achieve a genetic value close to the OHV of the elite individual. Eventually, when the group selected was too large, it became unlikely that the doubled haploids from lower merit individuals exceeded the genetic merit of doubled haploids from the most elite plant. This diminished the return of selecting more individuals to take forward to doubled haploid production.
Cycling elite doubled haploids back into the breeding program had only a minor effect in terms of the difference between OHV and GS (Figure 3C, Table S5). It also did not affect overall genetic gain substantially. The main reason for this was the time lag before doubled haploids could be incorporated back into the breeding program. As their production cannot be completed quickly enough to include them in the next generation of crosses, they can only be incorporated two generations later. In the meantime, the crossing population had gone through another round of selection and its elite individuals were similar in genetic merit to the doubled haploids from two generations ago, leading to only a suggestive additional improvement trend for OHV.
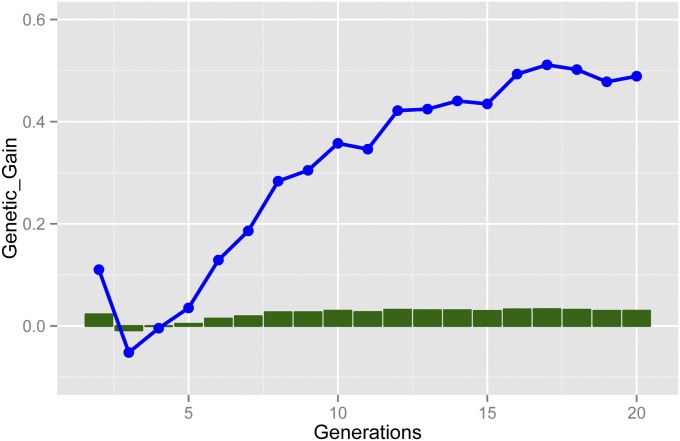
The potential advantage of OHV over time was further investigated in a scenario where selection was over 20 generations and it continued up to ∼16 generations where it appears to asymptote and remain relatively constant (Figure 4, Table S3). The proportional increase of OHV over GS is also shown in Figure 4 and it ranged between −0.01 and 0.03. It is important to note that this proportion is affected by the total magnitude of genetic gain in GS, and it may be larger when less overall gain is achieved with GS, possibly due to inaccuracy of marker effects.
Figure 4.
Difference in genetic gain (Genetic_Gain) in base genetic SD (blue line) and proportion (green bars) between optimal haploid value (OHV) selection and genomic selection (GS), when continuing the DEFAULT scenario for 20 generations (nGen, SE < 0.10).
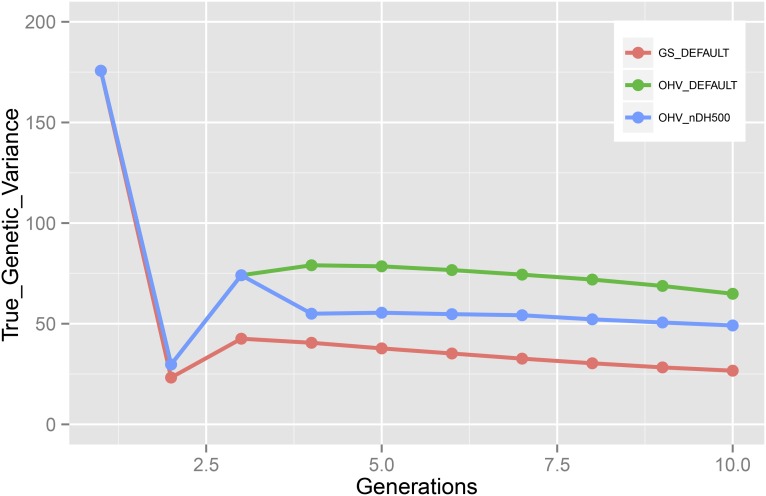
A key advantage of OHV selection is its ability to maintain more genetic variation or diversity in the population than GS. This is strongly demonstrated in Figure 5 and Table S6. The true genetic variance was highest in the unselected base population. First, it declined sharply because only the top 30% of lines were used to generate a completely heterozygous F1 generation. Crossing the F1 then released additional genetic variation because homozygous genotypes were now also observed. In generation 3, the true genetic variance of OHV selection was almost twice that of GS. Furthermore, OHV selection reduced the genetic variance at a slower pace than GS in subsequent generations and OHV diversity was almost 200% greater by generation 10. Note that cycling 500 doubled haploids back into the breeding program reduced the genetic variance substantially in generation 4, because segregating individuals were replaced with doubled haploids generated from 10 heavily selected elites, resulting in a significant narrowing of the genetic base (Figure 4, Table S6). Incidentally, this scenario also showed the smallest difference in genetic gain between OHV and GS (Table S5).
Figure 5.
The true genetic variance in each generation when selection was on optimal haploid value (OHV) or genomic breeding values (GS) for DEFAULT and nDH500 scenarios (SE < 3.64).
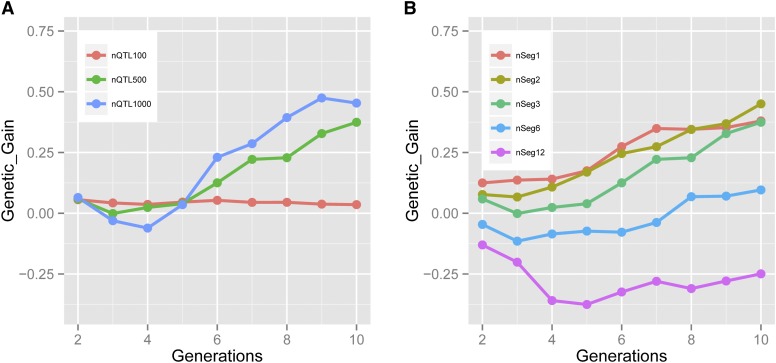
To investigate the effect of genetic architecture on the relative gain from OHV vs. GS, we simulated three different genetic architectures of 100, 500, or 1000 QTL. Generally, the use of OHV was advantageous regardless of the number of QTL affecting the trait (Figure 6A, Table S7). The advantage with OHV was small and consistent across generations with 100 QTL. When 500 or 1000 QTL were simulated, a slight depression of OHV vs. GS was observed, which was overcome by generation 5, after which OHV again consistently performed better than GS. The sustained gain in performance was larger as the trait became more polygenic.
Figure 6.
(A and B) Difference in genetic gain (Genetic_Gain) between OHV and GS when (A) the number of QTL is varied (nQTL, SE < 0.21) or (B) the number of haplotype segments per chromosome is varied (nSeg, SE < 0.17).
The sensitivity of the results to the length of the haplotype or genome segment considered was tested by testing each chromosome as its own separate segment or dividing each into 2, 3, 6, or 12 segments. OHV selection performed better than GS when the number of segments was ≤3. The base scenario had 3 segments per chromosome and showed a reduction in the difference between OHV and GS in generations 3–5 (Figure 6B, Table S8). This reduction was avoided when chromosomes were only divided in two or left intact. GS performed better when the number of segments was increased to 6 or 12. This highlights that model assumptions need to reflect biology or, in our case with simulated data, the biological assumptions. We simulated a mean recombination rate of 1/M. A large number of individuals will not have any or have very few recombinations per chromosome and, therefore, a model with few segments would be most similar. Increasing the number of segments increases the OHV of a particular individual, because haplotypes can be more finely combined in silico to create an elite plant. However, this OHV cannot be achieved in one generation of doubled haploidy. In essence, the 12-segment OHV is the plant that may be achieved in excess of six or more generations of accumulating recombinations. This causes a drift away from the selection goal of picking the plant that can achieve the best doubled haploid in one cycle of selection to the plant that may produce the best doubled haploid several generations later. This drift erodes the entire benefit of OHV over GS.
Discussion
We have described and extensively tested in silico a new breeding framework that optimizes the selection of lines that result in elite doubled haploids, OHV. OHV selection results in more genetic gain than GS and this advantage grows over time. The focus on haplotype selection allows OHV selection to carry substantially more genetic diversity in the breeding population.
The extent of recombination was a major factor influencing the advantage of OHV over GS. The creation of elite doubled haploids requires that good haplotypes are combined in one individual. The accumulation of recombination, through either crossing or doubled haploidy, increases the number of different haplotype combinations, the best of which can then be selected using genomic tools. The breeding population described here is perhaps quite different from that of current commercial practice. Here we maintain a breeding population in the outbred state indefinitely over potentially many generations. Recurrent selection increases the frequency of favorable haplotype combinations in this population. A line is “fixed” only if it has potential to produce elite germplasm. There are considerable costs involved in forcibly outbreeding a natural inbreeder such as wheat. However, these costs can be offset first by increased genetic gain and, second, by selecting for multiple traits simultaneously via a multiple-trait selection index approach. The second component will drastically reduce the time spent in backcross and trait stacking cycles. The maintenance of parallel outbred populations in multiple field locations would be difficult as seed would need to be bulked for each outbred plant. However, it is necessary only to plant reference populations in multiple locations that then can be used to predict potential performance of outbreds for each location based on their DNA (Cooper et al. 2014). Doubled haploids from elite outbreds could be planted in all locations to update the reference population and guard against the decay of accuracy across generations.
Relying on naturally occurring recombination may be a limiting factor in areas of the genome that tend not to recombine. There is some evidence that areas of low recombination exist in wheat, for example near the Sr36 introgression (Cavanagh et al. 2013) or near telomeres. In contrast, distal ends on chromosomes exhibit higher recombination rates (Akhunov et al. 2003). These recombination deserts are expected to affect each method equally. However, extension of OHV methodology with dynamic haplotype lengths to account for differential recombination rates may further increase its performance.
Extensions of the OHV concept to polyploidy are simplest if subgenome-specific SNPs are identified that can be treated as de facto diploid. In autotetraploid species where subgenome-specific SNPs do not exist, adaption of OHV would require the number of potential haplotypes that are passed from parent to offspring to increase. For example, in an autohexaploid it would be three. Furthermore, phasing of haplotypes for outbred allo- and autopolyploids would be required and is not trivial. Here we assumed that we can track haplotypes through the generations, starting from the inbred base population.
The end goal in plant breeding is very often a superior fixed line and this is currently accomplished largely with doubled haploids. OHV selects explicitly on the potential genetic value of such a line and more closely matches this ultimate goal and, thus, performs better than GS. However, OHV also needs to be finely tuned to what is achievable in one cycle of recombination (i.e., doubled haploidy). Performance of OHV will be reduced when haplotype lengths considered in the OHV steps are reduced substantially and the plant’s potential is evaluated too far into the future (Figure 5B). A simple way to assess OHV is to calculate the efficiency of attaining a parent plant’s OHV with a certain number of doubled haploids. When segment length was decreased from 3 to 6 or 12 segments per chromosome, the efficiency of achieving the parent OHV decreased (data not shown). This demonstrates the drift away from the goal of achieving the best doubled haploid within one cycle.
A significant increase in genetic diversity was observed with OHV selection when compared to GS. This increased true genetic variance is likely due to a more explicit selection of the haplotype with OHV. In GS, the GBV is the sum of all allele effects, so if an individual carries unfavorable alleles, it will reduce their GBV. Thus, GS will tend toward increasing the total frequency of the haplotype in the population (i.e., homozygosity). OHV sums only the best haplotype value in each segment, and therefore it will ignore low merit alleles if the other haplotype at the segment is superior. There is no additional benefit to carrying two favorable haplotypes, as the individual’s OHV will remain the same. This maintains a more diverse set of haplotypes in the breeding population and leads to a substantive and striking increase in diversity from OHV selection. The haplotypes maintained may be inferior, because they carry a number of unfavorable QTL alleles, but such haplotypes can also include one or more favorable alleles. Over time recombination can “release” such favorable alleles into an average or favorable back ground, and then these haplotypes can be increased in frequency by selection.
Population genetic diversity is particularly important for long-term genetic gain. One disadvantage of strong selection pressure without regard to diversity or inbreeding is that low-frequency variants are lost (e.g., Jannink 2010). Maintaining low-frequency alleles or haplotypes in the population longer allows for selection to slowly increase their frequency until they explain a larger proportion of the genetic variance. OHV selection, through its selection on one haplotype rather than on the sum of the two haplotypes, is likely to maintain low-frequency variants longer. The increasing advantage of OHV at later generations is a manifestation of increased long-term genetic gain that is expected to be directly due to its greater genetic variance carried in the breeding population. Our study demonstrates that a clear breeding strategy that preserves genetic diversity results in more long-term genetic gain.
We have assumed that marker effects were known without error and that this assumption would affect both methods equally. This study has shown that OHV selection will result in more diverse breeding populations. Larger reference populations may be needed to achieve the same prediction accuracy as in less diverse GS schemes, potentially leading to greater cost for OHV. Further investigation of OHV in fully stochastic simulations that include estimation of marker effects is needed to fully explore this aspect.
Reducing the selection pressure away from the sum of the haplotypes to individual haplotypes allows for more efficient multitrait selection programs. It allows favorable haplotypes to be maintained, even when they are in trans, thereby providing more opportunities for crop improvement. For example, in GS an individual carrying a favorable disease resistance allele in one haplotype and a favorable yield allele in the other haplotype in the same genomic segment is likely to result in the selection of only one haplotype due to the two segments explicitly competing. In contrast, OHV allows both haplotypes to be maintained more easily in the breeding population, thus increasing the probability that in time a recombination event will combine both favorable alleles in the same haplotype. Of course, if a doubled haploid is created before this recombination event, one of the favorable alleles would be lost in OHV selection as well. However, the increased diversity makes a desired recombination event more likely in OHV than in GS.
We have demonstrated OHV selection in simulations using bread wheat genotype data. The method is feasible in any inbred or outbred species. Its advantages are most clear when doubled haploids are produced and when the genetics in production environments are separate but derived from a breeding population. Increased diversity of OHV selection means that, overall, the GEBV of the breeding population will be slightly lower than with conventional GS. However, its ability to produce elite doubled haploids is increased. Of course homozygous plants can also be produced by selfing for several generations, which may make OHV selection relevant for plant systems without doubled haploid capability. The effect on genetic gain of time spent in selfing cycles would have to be explicitly modeled. Even without doubled haploids or selfing, maintaining the diversity of chromosome segments in the population can lead to increased long-term genetic gains (e.g., Kemper et al. 2012). An OHV strategy is one way to achieve this.
A breeding program applying OHV is expected to work well in systems where elite varieties are commercialized to growers such as most plant breeding programs. Application in livestock, while principally possible, would require more investigation, because there is significant overlap of production and breeding individuals. The key question in those systems is whether the increase in long-term genetic gain is worth the short-term reduction in uniformity due to increased genetic variance. Finally, it is important to note that some of the OHV schemes proposed here would require extra resources in the breeding program [for example, for large-scale doubled haploid (DH) creation]. A cost benefit analysis of OHV schemes, together with the design of optimal reference (training) sets for OHV-based breeding schemes, is the subject of ongoing research.
Supplementary Material
Footnotes
Communicating editor: I. Hoeschele
Supporting information is available online at www.genetics.org/lookup/suppl/doi:10.1534/genetics.115.178038/-/DC1.
Literature Cited
- Akhunov E. D., Goodyear A. W., Geng S., Qi L.-L., Echalier B., et al. , 2003. The organization and rate of evolution of wheat genomes are correlated with recombination rates along chromosome arms. Genome Res. 13: 753–763. [DOI] [PMC free article] [PubMed] [Google Scholar]
- Cavanagh, C. R., S. Chao, S. Wang, B. E. Huang, S. Stephen et al., 2013 Genome-wide comparative diversity uncovers multiple targets of selection for improvement in hexaploid wheat landraces and cultivars. Proc. Natl. Acad. Sci. USA 110: 8057–8062. [DOI] [PMC free article] [PubMed] [Google Scholar]
- Cole J. B., VanRaden P. M., 2010. Visualization of results from genomic evaluations. J. Dairy Sci. 93: 2727–2740. [DOI] [PubMed] [Google Scholar]
- Cole J. B., VanRaden P. M., 2011. Use of haplotypes to estimate Mendelian sampling effects and selection limits. J. Anim. Breed. Genet. 128: 446–455. [DOI] [PubMed] [Google Scholar]
- Cooper M., Messina C. D., Podlich D., Totir L. R., Baumgarten A., et al. , 2014. Predicting the future of plant breeding: complementing empirical evaluation with genetic prediction. Crop Pasture Sci. 65: 311–336. [Google Scholar]
- Daetwyler, H. D., 2015 OHVsim - program to compare genomic and optimal haploid value selection in a multi-year wheat breeding program. Available at: https://github.com/hansdd/OHVsim. Accessed: June 17, 2015.
- Erbe M., Hayes B. J., Matukumalli L. K., Goswami S., Bowman P. J., et al. , 2012. Improving accuracy of genomic predictions within and between dairy cattle breeds with imputed high-density single nucleotide polymorphism panels. J. Dairy Sci. 95: 4114–4129. [DOI] [PubMed] [Google Scholar]
- Habier D., Fernando R., Kizilkaya K., Garrick D., 2011. Extension of the Bayesian alphabet for genomic selection. BMC Bioinformatics 12: 186. [DOI] [PMC free article] [PubMed] [Google Scholar]
- Jannink J.-L., 2010. Dynamics of long-term genomic selection. Genet. Sel. Evol. 42: 35. [DOI] [PMC free article] [PubMed] [Google Scholar]
- Kemper K. E., Bowman P. J., Pryce J. E., Hayes B. J., Goddard M. E., 2012. Long-term selection strategies for complex traits using high-density genetic markers. J. Dairy Sci. 95: 4646–4656. [DOI] [PubMed] [Google Scholar]
- Meuwissen T. H. E., Hayes B. J., Goddard M. E., 2001. Prediction of total genetic value using genome-wide dense marker maps. Genetics 157: 1819–1829. [DOI] [PMC free article] [PubMed] [Google Scholar]
- Mohan Jain, S., S. K. Sopory, and R. E. Veilleux, 1996 In Vitro Haploid Production in Higher Plants. Springer-Science+Business Media, Dordrecht, The Netherlands. [Google Scholar]
- Nirea K., Sonesson A., Woolliams J., Meuwissen T., 2012. Strategies for implementing genomic selection in family-based aquaculture breeding schemes: double haploid sib test populations. Genet. Sel. Evol. 44: 30. [DOI] [PMC free article] [PubMed] [Google Scholar]
- TCAP, 2014 The Triticeae Coordinated Agriculture Project. Available at: http://www.triticeaecap.org/. Accessed: June 2, 2014.
Associated Data
This section collects any data citations, data availability statements, or supplementary materials included in this article.


