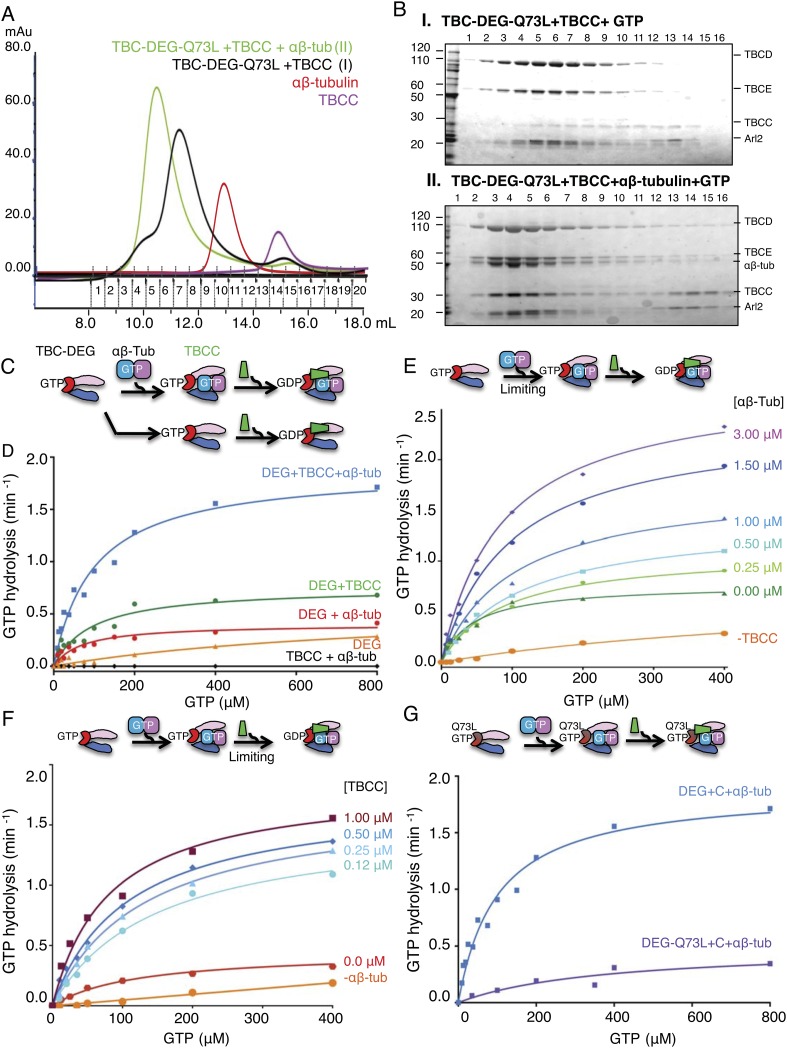
Figure 3. TBCC activates dual GTP hydrolyses in Arl2 and αβ-tubulin on TBC-DEG: αβ-tubulin complexes.
(A) Size exclusion chromatography (SEC) intensity traces of TBC-DEG-Arl2-Q73L (TBC-DEG-Q73L) assembly with TBCC and αβ-tubulin; TBC-DEG-Q73L+TBCC (black), TBC-DEG-Q73L+αβ-tubulin+TBCC (green), αβ-tubulin (red), and TBCC (purple). (B) Analysis of SEC fractions described in A by SDS-PAGE. Panel I, TBC-DEG-Q73L+TBCC+GTP; panel II, TBC-DEG-Q73L+TBCC+αβ-tubulin-GTP. (C) Scheme for GTP hydrolysis by TBC-DEG and the effect of αβ-tubulin binding and TBCC on the GTP hydrolysis pathway. (D) Steady-state GTP hydrolysis assays of different 1 μM TBC-DEG, αβ-tubulin, and TBCC assemblies. TBC-DEG (red) and TBC-DEG+αβ-tubulin (orange) hydrolyze GTP very slowly. TBCC+αβ-tubulin (black) hydrolyzes negligible amounts of GTP. TBC-DEG+αβ-tubulin+TBCC hydrolyzes GTP (blue; 1.8 min−1) at a rate roughly twofold higher than TBC-DEG+TBCC (green; 0.8 min−1). Km and kcat values are reported in Table 3. (E) The effect of αβ-tubulin binding on TBC-DEG GTP hydrolysis. Top panel, scheme for GTP hydrolysis by TBC-DEG and the effect of limiting or varying the αβ-tubulin concentration on GTP hydrolysis. Bottom panel, titrating αβ-tubulin concentrations (0–3.0 μM) to 1 μM TBC-DEG and 1 μM TBCC. The curves are labeled with the concentration at the plateau point for each curve. (F) The effect of TBCC concentration on TBC-DEG GTP hydrolysis. Top panel, scheme for GTP hydrolysis by TBC-DEG and the effect of limiting or varying the TBCC concentration on GTP hydrolysis. Bottom panel, titrating TBCC concentration (0.12–1.0 μM) to 1 μM TBC-DEG and 1 μM αβ-tubulin. The curves are labeled with the concentration at the plateau point for each curve. (G) The effect of Arl2-Q73L on TBC-DEG GTP hydrolysis. Top panel, scheme for GTP hydrolysis by TBC-DEG-Q73L and the effect of αβ-tubulin binding and TBCC on the GTP hydrolysis reaction. Bottom panel, steady-state GTP hydrolysis assays of 1 μM TBC-DEG+αβ-tubulin+TBCC (blue) compared to TBC-DEG-Q73L+αβ-tubulin+TBCC (purple). Km and kcat values are reported in Table 3.


