

Abstract
High-performance affinity chromatography (HPAC) was used in a variety of formats to examine multi-site interactions between glimepiride, a third-generation sulfonylurea drug, and normal or in vitro glycated forms of the transport protein human serum albumin (HSA). Frontal analysis revealed that glimepiride interacts with normal HSA and glycated HSA at a group of high affinity sites (association equilibrium constant, or Ka, 9.2–11.8 × 10⁵ M−1 at pH 7.4 and 37°C) and a group of lower affinity regions (Ka, 5.9–16.2 × 10³ M−1). Zonal elution competition studies were designed and carried out in both normal- and reversed-role formats to investigate the binding by this drug at specific sites. These experiments indicated that glimepiride was interacting at both Sudlow sites I and II. Allosteric effects were also noted with R-warfarin at Sudlow site I and with tamoxifen at the tamoxifen site on HSA. The binding at Sudlow site I had a 2.1- to 2.3-fold increase in affinity in going from normal HSA to the glycated samples of HSA. There was no significant change in the affinity for glimepiride at Sudlow site II in going from normal HSA to a moderately glycated sample of HSA, but a slight decrease in affinity was seen in going to a more highly glycated HSA sample. These results demonstrated how various HPAC-based methods can be used to profile and characterize multi-site binding by a drug such as glimepiride to a protein and its modified forms. The information obtained from this study should be useful in providing a better understanding of how drug-protein binding may be affected by glycation and of how separation and analysis methods based on HPAC can be employed to study systems with complex interactions or that involve modified proteins.
Keywords: High-performance affinity chromatography, Human serum albumin, Glycation, Glimepiride, Drug-protein binding
1. Introduction
The sulfonylureas are a class of drugs that are commonly used to treat type II diabetes. These drugs stimulate the secretion of insulin from beta cells in the pancreas to alleviate elevated levels of glucose in the blood stream [1]. These drugs are often divided into groups such as “first-generation” and “second-generation”, which differ in their effectiveness for treatment and their ability to be metabolized by the body [2–4]. Glimepiride (Fig. 1) is a third-generation sulfonylurea drug that can be used at even lower dosages than second-generation drugs like gliclazide and glibenclamide [1]. The effectiveness of glimepiride is similar to that of glibenclamide; however, glimepiride can be taken only once daily, while glibenclamide and other sulfonylurea drugs are administered 1–2 times per day [1].
Figure 1.

Structure of glimepiride. The section in the dashed box shows the core structure of a sulfonylurea drug.
First- and second-generation sulfonylurea drugs are known to bind to and be transported by human serum albumin (HSA), the most abundant protein in blood plasma [5–13]. Such binding is an important function of HSA, which aids in the transportation of many endogenous and exogenous substances throughout the body (e.g., drugs, low mass hormones, and fatty acids) [14–19]. Sudlow sites I and II are the two main binding sites for drugs on HSA [14,20,21]. Bulky heterocyclic anionic drugs such as warfarin, azapropazone, phenylbutazone, and salicylate tend to bind at Sudlow site I [14,17,20,22]. Ibuprofen, ketoprofen, benzodiazepines, and L-tryptophan are examples of drugs and solutes that bind to Sudlow site II [14,17,20,23]. There are some additional sites on HSA that have been reported for drugs such as tamoxifen and digitoxin (i.e., the tamoxifen and digitoxin sites) [24–26]. A number of first- and second-generation sulfonylurea drugs have been reported to bind to Sudlow sites I and II; glibenclamide has also been found to bind at the digitoxin site [4–7,9–13].
Several recent reports have found that the binding of sulfonylurea drugs to HSA can be affected by non-enzymatic glycation [6,7,9–13,27,28]. Glycation occurs when glucose reacts with free amine groups on a protein such as HSA [16,29–33]. A Schiff base is initially formed by this reaction but can rearrange to form a stable Amadori product, or ketoamine [16,29–33]. There is roughly a 2- to 5-fold increase in the amount of glycated HSA in patients with diabetes versus normal individuals [34]. Studies based on mass spectrometry have shown that some of these glycation-related modifications can occur at or near Sudlow sites I and II [13,35–37].
The goal of this study is to investigate the possible multi-site binding of glimepiride to HSA and in vitro glycated HSA through the use of high-performance affinity chromatography (HPAC). HPAC is a liquid chromatographic technique that utilizes an immobilized biological molecule (e.g., HSA) as the stationary phase [38]. One application of HPAC is as a tool for studying biological interactions [27,28,38–45]. In the use of HPAC to study drug interactions with normal HSA, it has been frequently noted that the binding parameters that can be obtained are comparable to those of traditional solution-phase techniques or reference methods (e.g., equilibrium dialysis and ultrafiltration) [38–47]. It has also been found recently that HPAC can be used to profile drug interactions with glycated HSA [6–13].
Glimepiride has a limited solubility in an aqueous solution (e.g., < 1 mg/L in water) [48]. Previous work based on fluorescence spectroscopy has used relatively non-polar solvents (e.g., 2.5–10% dimethyl sulfoxide) to make it possible to investigate the interactions of this drug with normal HSA [49–51]. This current report will use HPAC to examine these interactions directly in aqueous solutions and at a physiological pH, while also expanding such studies to see how glycation affects these binding processes. A variety of HPAC methods, including frontal analysis and both normal- and reversed-role zonal elution competition studies, will be developed and used to examine the overall binding and interactions for glimepiride on normal HSA and glycated HSA. Some of these experiments will be further used to provide a detailed depiction of the interactions, including positive or negative allosteric effects, for glimepiride with probes for specific sites on HSA. A comparison between the binding by glimepiride with normal HSA and glycated HSA will also be made, as well as with previous binding parameters that have been reported for first- and second-generation sulfonylurea drugs to similar protein preparations [5–7,9–13,27]. These experiments should provide a more complete picture of how glimepiride and sulfonylurea drugs interact with HSA and of how glycation may affect these processes. In addition, the results obtained for glimepiride with various separation and analysis formats based on HPAC should provide useful information on how similar tools might be used in examining additional multi-site interactions involving other classes of drugs and normal or modified proteins.
2. Experimental
2.1. Chemicals
Glimepiride (≥ 96% pure) was purchased from Santa Cruz Biotechnology (Dallas, Texas, USA). The racemic warfarin (≥ 99%), R-warfarin (≥ 97%), L-tryptophan (≥ 97%), digitoxin (≥97%), tamoxifen (≥ 99%), β-cyclodextrin (> 98%), D-(+)-glucose (≥ 99.5%), sodium azide (95%), and HSA (essentially fatty acid free, ≥ 96%) were from Sigma Aldrich (St. Louis, MO, USA). Nucleosil Si-300 (7 μm particle diameter, 300 Å pore size) was purchased from Macherey-Nagel (Düren, Germany). In vitro glycated HSA samples were purified by using Econo-Pac 10DG desalting columns from Bio-Rad Laboratories (Hercules, CA, USA) and Slide-A-Lyzer digest 7K dialysis cassettes (7 kDa MW cutoff; 0.5–3, 3–12 or 12–30 mL sample volumes) from Thermo Scientific (Rockford, IL, USA). A fructosamine assay kit (Diazyme Laboratories, San Diego, CA, USA), was used to measure the modification levels of the in vitro glycated HSA samples. A bicinchoninic acid (BCA) protein assay was used to determine the protein content of the chromatographic supports; the reagents for this assay were obtained from Pierce (Rockford, IL, USA). All aqueous solutions were prepared in water purified by a Milli-Q-Advantage A 10 system (EMD Millipore Corporation, Billerica, MA, USA). The same solutions were filtered through 0.20 μm GNWP nylon membranes from EMD Millipore.
2.2. Apparatus
The HPLC system contained two PU-2080 pumps, a DG-2080 degasser, an AS-2057 autosampler, a CO-2060 column oven, and an UV-2075 absorbance detector from Jasco (Tokyo, Japan). This system also included a Rheodyne Advantage PF six-port valve (Cotati, CA, USA). Jasco LC Net and ChromNav software were used to control the system. The chromatograms were analyzed by using Peakfit 4.12 software (Jandel Scientific Software, San Rafael, CA, USA). DataFit 8.1.69 (Oakdale, PA, USA) was used for data analysis by non-linear regression.
2.3. In vitro Glycation of HSA
In vitro glycated HSA was prepared at physiological concentrations of HSA and glucose, as described previously [8,52,53], to prepare samples that were representative of glycation levels found in patients with prediabetes or confirmed diabetes. These two samples will be referred to as “gHSA1” and “gHSA2”, respectively. To prevent bacterial growth during the glycation process, all materials (e.g., glassware and spatulas) were first sterilized in an autoclave. A pH 7.4, 0.20 M potassium phosphate buffer for use in this procedure was prepared that contained 1 mM sodium azide. This buffer was also sterilized in an autoclave to prevent bacterial growth.
The in vitro glycated HSA was prepared by adding 840 mg of normal HSA to either a solution containing 15 mM glucose (for gHSA1) or 30 mM glucose (for gHSA2) that was prepared in the sterile pH 7.4, 0.20 M phosphate buffer. The final HSA concentration of the glycated solutions was 42 mg/L of HSA. These mixtures were then incubated for four weeks at 37 °C. The protein samples were later purified through the use of size exclusion chromatography by using desalting columns and pH 7.4, 0.067 M potassium phosphate buffer to remove the excess glucose [8]. The collected samples were dialyzed against water using a volume that was 200–500 times the volume of sample to remove any remaining glucose or phosphate salts [8]. The resulting protein solutions were then lyophilized and stored at −80 °C until further use.
A fructosamine assay was conducted in duplicate to determine the glycation level of the in vitro glycated samples, as described previously [8]. The measured glycation levels were 1.39 (± 0.28) and 3.20 (± 0.13) mol hexose/mol HSA for gHSA1 and gHSA2, respectively. The glycation level for the normal HSA was 0.24 (± 0.13) mol hexose/mol HSA.
2.4. Column preparation
The chromatographic supports were made from Nucleosil Si-300 silica that had been converted into a diol-bonded form [54–56]. Supports containing normal HSA or glycated HSA were immobilized to this support through the Schiff base method [56]. A previous study that determined which amine groups on HSA are involved in the Schiff base method has found that these residues tend to be different from those that are involved in glycation [57]. Control columns were prepared in the same manner but with no protein being added during the immobilization step. The protein content for each final support was determined in triplicate by a BCA assay, with soluble and normal HSA being used as the standard and the control support being used as the blank. The protein content for the individual supports was 97 (± 2), 85 (± 4), and 95 (± 4) mg HSA/g silica for the normal HSA, gHSA1, and gHSA2 supports, respectively.
The supports were downward slurry packed using pH 7.4, 0.067 M potassium phosphate buffer as the packing solution. The supports were placed into separate 2.0 cm × 2.1 mm i.d. stainless steel columns at 3500 psi (24 MPa). All of the columns and support materials were stored in pH 7.4, 0.067 M phosphate buffer at 4 °C until further use. Previous work has found that such columns can be stable over the course of up to 500 sample applications without any appreciable changes in their drug-binding properties [58].
2.5. Chromatographic studies
The glimepiride, racemic warfarin, R-warfarin, L-tryptophan, digitoxin and tamoxifen solutions were each prepared in pH 7.4, 0.067 M phosphate buffer. The limited solubility of glimepiride in this buffer required similar methods of solution preparation to those described for a related drug with low solubility, glibenclamide [10]. This procedure involved preparing the solutions of glimepiride in such a buffer by using repeated 4 h periods of stirring and sonication on a daily basis and in a covered container held at 35–50 °C for 5 days. This method allowed for the preparation of a stable 50 μM glimepiride solution, which could then be used in further dilution steps to prepare working solutions for the chromatographic studies. Although glimepiride is a weak acid (pKa, 6.3), the pH of the final buffered solutions was not affected by the presence of this drug at the concentrations of this agent that were employed in this study [49].
Digitoxin and tamoxifen also have limited solubility in aqueous solutions (e.g., around 4 mg/L and 0.17 mg/L in water, respectively). These drugs were dissolved by adding a solubilizing agent (i.e., β-cyclodextrin) [59,60]. Previous studies that have used β-cyclodextrin as a solubilizing agent in HPAC have found that there are no notable changes due to this agent in the binding constants measured for the interactions between an applied drug and immobilized HSA [24–26]. A 25 μM stock solution of digitoxin was prepared in pH 7.4, 0.067 M phosphate buffer that contained 0.88 mM β-cyclodextrin; a stock solution of 10 μM tamoxifen was prepared by also adding 2.2 mM β-cyclodextrin to the pH 7.4, 0.67 M phosphate [24–26]. Racemic warfarin and R-warfarin solutions were prepared in the pH 7.4, 0.067 M phosphate buffer by stirring overnight. The glimepiride, tamoxifen, digitoxin, racemic warfarin, and R-warfarin solutions were used within two weeks of preparation [8,58,61]. Previous studies have shown that solutions of L-tryptophan in pH 7.4 phosphate buffer are only stable for a period of 2–9 days, so these solutions were prepared and used within one day of preparation [8,61,62].
The pH 7.4, 0.067 M phosphate buffer was also used as the mobile phase in the chromatographic experiments for both sample application and isocratic elution. Prior to use, the mobile phases and applied solutions were passed through 0.2 μm filters and degassed for 10–15 min. All of the chromatographic experiments, including both the frontal analysis and zonal elution studies, were carried out at 0.50 mL/min and 37 °C. The backpressure under these conditions was approximately 300 psi (2.1 MPa). Previous studies have indicated that reproducible drug binding parameters (e.g., retention factors, binding capacities and association equilibrium constants) can be obtained on comparable HSA columns under the same chromatographic conditions [5–11].
Frontal analysis experiments were conducted by first equilibrating each column with the pH 7.4, 0.067 M phosphate buffer. A switch was then made, through the use of a six-port valve, to the same buffer that contained a known concentration of glimepiride (i.e., one of twelve solutions containing 0.5–50 μM glimepiride). This application step resulted in the formation of a breakthrough curve as the elution of glimepiride was monitored at 255 nm, as is shown in Fig. 2(a) (Note: the response for each glimepiride solution was within the linear range of the detector). Following the formation of the breakthrough curve and a stable plateau, which took approximately 5–14 min in Fig. 2(a), a switch was made back to only pH 7.4, 0.067 M phosphate buffer; this buffer was passed through the column to allow for elution of the retained glimepiride and regeneration of the column. The same experiments were conducted on the control column. Each concentration of glimepiride was run in quadruplicate for the various HSA columns and the control column.
Figure 2.

(a) Example of a frontal analysis experiment and (b) analysis of such data by using Eq. (2). These results were obtained for glimepiride on a 2.0 cm × 2.1 mm i.d. column containing normal HSA. Other experimental conditions are given in the text. The glimepiride concentrations in (a) were 50, 30, 20, 15, 10, or 5 μM (top-to-bottom). The results in (b) are for twelve glimepiride concentrations ranging from 0.5 to 50 μM. The inset in (b) shows the deviations occurring at low 1/[Glimepiride] values from the best-fit line that was determined from a linear region at high values of 1/[Glimepiride]. The data points in (b) represent an average of four runs with relative standard deviations that ranged from 0.04–3.2%.
The first derivative of each breakthrough curve was found through the use of the smoothing function of Peakfit 4.12, and the mean of this derivative was determined by utilizing the equal area function (i.e., the point at which the areas are equal on either side of the given curve) [61]. A correction for the system void time and non-specific binding by glimepiride to the support was made by subtracting the breakthrough time for the control column from the breakthrough times for columns that contained normal HSA or glycated HSA. Roughly 42–45% of the measured binding for 50 μM glimepiride was due to non-specific interactions on the normal HSA or glycated HSA columns. This was similar to levels of non-specific binding that have been noted for glibenclamide on the same types of column, and for which a correction was successfully made by also using binding data obtained from control columns [10].
In the zonal elution competition studies, R-warfarin was used as a probe for Sudlow site I, while L-tryptophan was used as a probe for Sudlow site II [5–11]. Two other minor sites on HSA are the digitoxin and tamoxifen sites, which were investigated by using tamoxifen and digitoxin as site-specific probes, respectively [24–26]. These competition studies were conducted by using eight mobile phases that contained 0.0 to 20.0 μM glimepiride in pH 7.4, 0.067 M phosphate buffer (i.e., conditions found experimentally to produce measurable shifts in retention for probes that had direct or indirect interactions with glimepiride). The probe samples were made using the same competing agent concentrations as were present in the mobile phase and were applied in 20 μL injections. The elution of R-warfarin, L-tryptophan, digitoxin and tamoxifen was monitored at 308, 280, 205, or 205 nm, respectively. The void time was determined by making a 20 μL injection of 20 μM sodium nitrate, which was used as a non-retained solute that was monitored at 205 nm. The experiments for each probe were conducted in quadruplicate on all of the columns. Peakfit 4.12 was used to determine the central point of each peak by using the equal area function [61].
Similar competition studies were carried out by using warfarin and tamoxifen as competing agents in the mobile phase while glimepiride was injected as the probe. Eight mobile phase solutions containing racemic warfarin were made, using warfarin concentrations ranging from 0.0 to 20.0 μM. Racemic warfarin was used in this case instead of the separate warfarin enantiomer because of the lower cost of the racemic mixture and the fact that R- and S-warfarin have similar binding affinities and the same binding site on HSA [22]. Experiments with tamoxifen acting as the competing agent made use of a set of eight solutions that contained 0.0 to 10.0 μM of this drug in the mobile phase. The concentrations used for both the warfarin and tamoxifen solutions were again selected due to their ability to produce measurable shifts in retention for the probe (i.e., glimepiride, in this case) if it had direct or indirect interactions with these agents. These warfarin and tamoxifen solutions were used to prepare 5 μM samples of glimepiride. A 20 μL portion of these glimepiride samples were then injected into their corresponding mobile phases and onto each column while the elution of glimepiride was monitored at 255 nm. Sodium nitrate was again used as a non-retained solute and was injected under the same chromatographic conditions. These experiments were performed in quadruplicate for all of the mobile phases and columns. The central point of the peak for glimepiride was determined by using the equal area function of Peakfit 4.12 [61].
3. Results and Discussion
3.1. Determination of Overall Binding Model
Frontal analysis was first used to profile the overall interactions between glimepiride and normal HSA or glycated HSA. This method was used to provide information about the number and general types of binding sites for these interactions [38–41,61]. Examples of these experiments are shown in Fig. 2(a), in which the mean breakthrough times occurred within 4–12 min after the application of glimepiride to the normal HSA column. The mean point of each breakthrough curve was used to determine the moles of applied drug that were required to reach that point at a given glimepiride concentration. These results were then fit to various models to determine the number of binding sites and equilibrium constants for the system [38–41,61].
These data were first examined by using a binding model for a one-site reversible interaction, as represented by the equivalent expressions in Eqs. (1–2) [38–41,61].
| (1) |
| (2) |
In these equations, mLapp represents the moles of applied analyte or drug that were required to reach the mean point of the breakthrough curve at a given molar concentration of the analyte, [A] [38–41,61]. The terms Ka and mL represent the association equilibrium constant and total moles of active binding sites for this interaction. Eq. (1) can be rearranged into Eq. (2) by taking the reciprocal of both sides of Eq. (1) [38–41,61].
Similar models can be employed for interactions that occur at multiple binding sites. Eqs. (3–4) describe a system with interactions that occur at two types of regions [38–41,61].
| (3) |
| (4) |
In these equations, the association equilibrium constants for the higher and lower affinity regions are given by Ka1 and Ka2, and the moles of these regions are described by mL1 and mL2 [38–41,61]. Another term that appears in Eq. (4) is α1, which is the fraction of all binding sites that consist of the highest affinity regions, or α1 = mL1/mL [38–41,61]. Eq. (4) also includes the term β1, which is the ratio of the association equilibrium constants for the lower versus higher affinity sites, or β2 = Ka2/Ka1 for Ka1 > Ka2 [38–41,61].
Previous studies with both first- and second-sulfonylurea drugs have found that these drugs interact with both normal and glycated HSA through a two-site model [5–7,9,10]. The presence of two or more groups of binding sites for glimepiride was tested by first plotting its frontal analysis data according to Eq. (2) [5–7,9,10]. This equation predicts that a plot of 1/mLapp versus 1/[A] will result in a linear relationship for a system with a single group of binding sites. However, as shown in Fig. 2(b) for normal HSA, deviations from linearity were noted in these plots at low values of 1/[Glimepiride], or at high concentrations of this drug [5–7,9,10]. The same type of behavior was seen on the glycated HSA columns. These deviations indicated that a multisite interaction was occurring between glimepiride and normal HSA or glycated HSA.
The same data were next examined by using non-linear regression and Eqs. (1) or (3). The fits that were obtained for glimepiride with normal HSA are shown in Fig. 3. The best-fit line for the two-site model gave a correlation coefficient of 0.9992 (n = 12), which was higher than the correlation coefficient of 0.9609 that was obtained for the one-site model. The residual plot for the two-site model also resulted in a more random distribution of the data points about the best-fit line when compared to the fit for the one-site model (see insets for Fig. 3). In addition, the sum of the squares of the residuals for each fit was much smaller for the two-site model than for the one-site model (i.e., 2.5 × 10⁻¹⁸ vs. 1.3 × 10⁻¹⁶), as confirmed at the 95% confidence level by comparing these results through the use of an F-test (or Fisher test). The use of higher-order models (e.g., three-site binding) did not result in any further improvement in the fit of this data set. All of this information indicated that glimepiride was interacting with normal HSA through two general groups of sites, as has been noted for other sulfonylurea drugs [5–7,9,10].
Figure 3.

Comparison of frontal analysis data analyzed by (a) a one-site model or (b) a two-site model for the binding of glimepiride with normal HSA. These results are for twelve solutions of glimepiride with concentrations ranging from 0.5 to 50 μM and that were applied to a 2.0 cm × 2.1 mm i.d. normal HSA column. Other experimental conditions are given in the text. The residual plots for each fit are provided in the insets. Each data point is the average of four values, with relative standard deviations that ranged from ± 0.04–3.2%.
Similar results were obtained for glimepiride with the glycated HSA columns. For both types of glycated HSA, the two-site model gave a better fit than the one-site model (e.g., correlation coefficients of 0.9987 vs. 0.9450 for gHSA1, and 0.9993 vs. 0.9555 for gHSA2). A more random distribution about the best-fit line was noted in each case for the two-site model over the one-site model. The sums of the squares of the residuals again had much smaller values for the two-site model than the one-site model (i.e., 5.1 × 10⁻¹⁸ vs. 2.6 × 10⁻¹⁶ for gHSA1 and 2.7 × 10⁻¹⁸ vs. 1.7 × 10⁻¹⁶ for gHSA2), as determined by comparing these results with an F-test that was conducted at the 95% confidence level. These general trends agreed with behavior that has been observed for other sulfonylurea drugs with similar preparations of glycated HSA [6,7,9,10].
3.2. Estimation of Overall Binding Constants and Amount of Binding Sites
The frontal analysis data and a two-site model were next used to estimate the overall association equilibrium constants for glimepiride with normal HSA or glycated HSA. Table 1 summarizes these results. The two groups of sites that were present were divided into a set of relatively high affinity regions and a group of weaker binding sites, as represented in Table 1 by the association equilibrium constants Ka1 and Ka2, respectively. The values of Ka1 and Ka2 that were obtained for normal HSA and glimepiride were 9.2 (± 0.9) × 105 M−1 and 7.4 (± 4.5) × 103 M−1. These two types of sites were present in about a 1:2.6 ratio on the normal HSA column. Using a one-site model, a global affinity of 1.4 × 10⁵ M−1 has previously been reported for this same system when using fluorescence spectroscopy and normal HSA in solution at pH 7.4 and 37°C [49]. Estimation of the global affinity based on the results in Table 1 gave a value of 2.6 (± 0.9) × 105 M−1, which agreed within ± 2 S.D. with the result that was reported in Ref. [49].
Table 1.
Association equilibrium constants (Ka) and binding capacities (mL) determined for glimepiride with normal HSA or glycated HSA when using a two-site binding modela
| Type of HSA | Ka1 (M−1 × 10⁵) | mL1 (mol × 10−8) | Ka2 (M−1 × 10³) | mL2 (mol × 10−8) |
|---|---|---|---|---|
| Normal HSA | 9.2 (± 0.9) | 3.1 (± 0.1) | 7.4 (± 4.5) | 8.0 (± 3.2) |
| gHSA1 | 10.6 (± 1.5) | 3.1 (± 0.2) | 5.9 (± 4.4) | 12.4 (± 6.7) |
| gHSA2 | 11.8 (± 1.5) | 2.8 (± 0.2) | 16 (± 5) | 6.3 (± 0.8) |
The results were measured at 37 °C in the presence of pH 7.4, 0.067 M potassium phosphate buffer. The values in parentheses represent a range of ±1 S.D., as based on error propagation and the precisions of the best-fit slopes and intercepts when using Eq. (3) (n = 12). The glycation levels for gHSA1 and gHSA2 were 1.39 (± 0.28) and 3.20 (± 0.13) mol hexose/mol HSA.
The Ka1 value measured for glimepiride with normal HSA was approximately 7- to 13-fold higher than association equilibrium constants that have been reported at the highest affinity sites for several other sulfonylurea drugs with normal HSA (i.e., acetohexamide, tolbutamide, and gliclazide) [5–7,9]. The structure of glimepiride contains more non-polar functional groups than these other sulfonylurea drugs, which could have attributed to this larger affinity. Such a model agrees with a previous report that suggested hydrophobic interactions play an important role in the binding of glimepiride with normal HSA [49]. The Ka1 for glimepiride with normal HSA was also 1.5-fold lower than the highest affinity interactions of this protein with glibenclamide, another relatively non-polar sulfonylurea drug [10]. This latter difference may be attributed to the fact that glibenclamide has its strongest binding to the digitoxin site on HSA, which is separate from the regions that have been found to bind most sulfonylurea drugs [10].
The values of Ka1 and Ka2 that were measured for glimepiride with gHSA1 were 10.6 (± 1.5) × 105 M−1 and 5.9 (± 4.4) × 103 M−1, and the values obtained for gHSA2 were 11.8 (± 1.5) × 105 M−1 and 1.6 (± 0.5) × 104 M−1. When comparing the values for the highest affinity sites (Ka1), a 15 to 28% increase in affinity was observed for gHSA1 or gHSA2 versus normal HSA, which was significant at the 95% confidence interval. Differences in affinity due the changes in the glycation level of HSA have been noted with similar protein preparations and other sulfonylurea drugs; these changes have been suggested to be due to the effects of glycation-related modifications that occur at or near the drug binding sites of HSA [6,7,9,10,36,37].
The fit of the frontal analysis data to a two-site model was also used to determine the moles of binding sites that were present for each group of sites on the normal HSA and glycated HSA columns. These results are included in Table 1 and were in the general range of 30–125 nmol protein, with the higher and lower affinity sites being present in ratios that ranged from 1:2.3 to 1:4.0. Based on the known protein content of each column, it was possible to further determine the specific activity for each type of site. For instance, the specific affinities for the high and low affinity sites in the normal HSA column were 0.67 (± 0.03) and 1.8 (± 0.7) mol/mol HSA. The specific activities for the gHSA1 column were 0.78 (± 0.05) and 3.1 (± 1.7) mol/mol HSA, and the values for gHSA2 column were 0.63 (± 0.04) and 1.3 (± 0.2) mol/mol HSA. These results were comparable to those acquired in previous work with other sulfonylurea drugs [6,7,9,10] and indicated that the high affinity interactions involved at least one major binding site, while the low affinity interactions involved a larger group of weaker binding sites.
3.3. Interactions with Sudlow Site II
The binding of glimepiride at specific sites on HSA was evaluated through the use of zonal elution competition studies. Examples of the chromatograms that were obtained in such a competition study are shown in Fig. 4, and typically required only 1–7 min per injection. This type of zonal elution experiment, when carried out in the traditional or “normal-mode” format, involves the injection of a small plug of a probe compound (A) in the presence of a known concentration of a potential competing agent (I) in the mobile phase [38–41,61]. The retention time (tR) for the probe is measured under each set of conditions and is used along with the column void time (tM, or the elution time of a non-retained solute such as sodium nitrate) to find the retention factor (k) for the probe, where k = (tR − tM)/tM [38–41,61]. The change in the retention factor for the probe as the concentration of the competing agent is varied is then examined to obtain information on the type of interaction that is taking place between the probe and competing agent as they bind to the column [38–42].
Figure 4.

Example of a zonal elution competition study. These results were obtained using R-warfarin as an injected site-specific probe for Sudlow site I and glimepiride concentrations in the mobile phase of 10, 5, 2.5, 1, or 0 μM (left-to-right). Other experimental conditions are given in the text. The vertical dashed line is shown for reference and indicates the position of the peak for R-warfarin in the presence of 0 μM glimepiride in the mobile phase.
If direct competition exists between the probe and competing agent at a single type of site and the probe has no other binding sites, Eq. (5) can be used to describe the interaction between these two agents [38–41,61].
| (5) |
The terms KaA and KaI are the association equilibrium constants for the probe and competing agent at their site of competition [38–41,61]. The void volume is represented by VM, and mL is the total moles of common binding sites in the column. If a linear response is obtained for a plot of 1/k versus [I], the association equilibrium constant for the competing agent at its site of competition with the probe can be found from the ratio of the slope over intercept [38–41,61].
Previous studies have found that Sudlow site II is a high or moderate affinity site for many first- and second-generation sulfonylurea drugs [5–7,9,10]. Based on these past reports, competition studies with glimepiride were conducted on columns containing normal HSA or glycated HSA and by using L-tryptophan as a site-specific probe for Sudlow site II [5–11]. As is shown in Fig. 5(a), a linear response was observed when the experimental data for all of the columns were fit to Eq. (5), with correlation coefficients that ranged from 0.9958 to 0.9996 (n = 8). These results indicated that glimepiride was competing directly with L-tryptophan for Sudlow site II in each of the preparations of normal HSA or glycated HSA. This agrees with previous solution-phase displacement studies, which have also indicated that glimepiride interacts at Sudlow site II of normal HSA [49].
Figure 5.

Fit to a direct competition model, as described by Eq. (5), for competition data obtained with (a) L-tryptophan or (b) digitoxin as site-specific probes and glimepiride as a competing agent on 2.0 cm × 2.1 mm i.d. columns containing normal HSA (●), gHSA1 (■), or gHSA2 (▲). Other experimental conditions are given in the text. The equations for the best-fit lines in (a) are y = [1.7 (± 0.1) × 105] x + [0.4 (± 0.1)], with a correlation coefficient of 0.9969 (n = 8) for normal HSA; y = [1.0 (± 0.1) × 105] x + [0.2 (± 0.1)], with a correlation coefficient of 0.9958 (n = 8) for gHSA1; and y = [9.5 (± 0.1) × 104] x + [0.3 (± 0.1)], with a correlation coefficient of 0.9996 (n = 8) for gHSA2. The dashed reference line in (b) is the result expected for a system with no competition between the injected probe and competing agent. Each point is the average of four values with relative standard deviations that ranged from (a) ± 0.5–20% or (b) ± 0.5–4.9%.
The best-fit lines in Fig. (5) were used to determine the association equilibrium constants for glimepiride at Sudlow site II for normal HSA and glycated HSA (see Table 2). The association equilibrium constant obtained for glimepiride at this site on normal HSA was 4.2 (± 0.6) × 105 M−1. This value makes this site part of the higher affinity regions observed in the frontal analysis studies. This result is 7- to 32-fold higher than association equilibrium constants that have been reported for first- and second-generation sulfonylurea drugs at the same site on normal HSA [5–7,9,10]. As noted earlier, this difference may be due to the relatively non-polar side chains on glimepiride and their contribution to the interactions of this drug with HSA [49].
Table 2.
Association equilibrium constants (KaI) and coupling constants (βI→A) measured for the interactions of glimepiride with probes for Sudlow sites I and II and the tamoxifen site of normal HSA or glycated HSAa
| Interactions with probe for Sudlow site IIb | Interactions with probe for Sudlow site Ic | Interactions with probe for tamoxifen sited | |||
|---|---|---|---|---|---|
| Type of HSA | KaI (M−1 × 10⁵) | KaI (M−1 × 10⁵) | Coupling constant, βI→A | KaI (M−1 × 10⁴) | Coupling constant, βI→A |
| Normal HSA | 4.2 (± 0.6) | 5.5 (± 0.3) | 0.13 (± 0.01) | 4.1 (± 0.9) | 9.5 (± 2.2) |
| gHSA1 | 4.5 (± 0.8) | 11.5 (± 0.1) | 0.14 (± 0.01) | 7.9 (± 0.9) | 6.3 (± 0.9) |
| gHSA2 | 3.7 (± 0.1) | 12.4 (± 0.2) | 0.13 (± 0.01) | 12.2 (± 1.4) | 4.6 (± 0.5) |
These results were measured at 37 °C in the presence of pH 7.4, 0.067 M potassium phosphate buffer. The values in parentheses represent a range of ± 1 S.D., as based on error propagation. The glycation levels for the HSA samples were the same as listed in Table 1.
These association equilibrium constants were determined by fitting Eq. (5) to the results of competition studies using L-tryptophan as a probe for Sudlow site II (n = 8).
These values were determined from the best-fit slopes and intercepts that were obtained when using Eq. (6) and data obtained from competition studies using R-warfarin as a probe for Sudlow site I (n = 7).
These values were determined from the best-fit slopes and intercepts that were obtained when using Eq. (6) and data from competition studies using tamoxifen as a probe for the tamoxifen site (n = 7).
Similar association equilibrium constants at Sudlow site II to those found for normal HSA were obtained for gHSA1 and gHSA2, which gave values of 4.5 (± 0.8) × 105 M−1 and 3.7 (± 0.1) × 105 M−1, respectively. No significant differences were observed at the 95% confidence interval when comparing the values for normal HSA and gHSA1. However, a 12 to 18% decrease, which was significant at the 95% confidence level, was observed when comparing gHSA2 with normal HSA or gHSA1. Previous work with other sulfonylurea drugs have found that either an increase or decrease in affinity can occur as the level of glycation is increased [6,7,9,10]. These changes have been attributed to differences in the types of modifications or extent of glycation that occur at or near Sudlow site II [36,37].
3.4. Interactions with the Digitoxin Site
The second-generation sulfonylurea drug glibenclamide has been found in prior work to interact strongly at the digitoxin site of normal HSA and glycated HSA [10]. Thus, competition studies were next performed with glimepiride and by using digitoxin as a probe for this binding site [10]. Some typical results are shown in Fig. 5(b). The data indicated that the presence of glimepiride in the mobile phase had no detectable change on the retention of digitoxin. The retention factor for digitoxin showed only random variations of ± 8.1% for normal HSA, ± 5.7% for gHSA1, and ± 4.0% for gHSA2 over the range of glimepiride concentrations that were used in these competition experiments. It was determined from these results that glimepiride was not binding to or interacting with the digitoxin site on the normal HSA or glycated HSA columns.
3.5. Interactions with Sudlow Site I
Sudlow site I is another region of normal HSA and glycated HSA that has strong interactions with first- and second-generation sulfonylurea drugs [5–7,9,10]. Solution-phase displacement studies have also indicated that glimepiride interacts at Sudlow site I [49]. The binding of glimepiride at this region was first examined in this current report by carrying out a competition study that used R-warfarin as a site-specific probe for Sudlow site I [5–11].
The data from these experiments were plotted according to Eq. (5). Previous studies have shown that many sulfonylurea drugs compete directly with R-warfarin for Sudlow site I [5–7,9,10], as would be indicated by a linear fit in a plot made according to Eq. (5). However, the response obtained for glimepiride gave clear deviations from linearity, as is demonstrated for the gHSA1 column in Fig. 6(a). The same behavior was seen for the normal HSA and gHSA2 columns. This result indicated that a more complex interaction than simple direct competition was occurring between glimepiride and R-warfarin as they were each binding to these columns. The type of behavior that is seen in Fig. 6(a) could have been caused by a negative allosteric effect by glimepiride during the binding of R-warfarin to HSA, as has been noted between some other solutes that bind to this protein [26]. This type of behavior is also consistent with fluorescence studies which have noted a conformational change that occurs upon the binding of glimepiride to normal HSA [49].
Figure 6.

Zonal elution competition studies using glimepiride as a competing agent and R-warfarin as an injected probe for Sudlow site I. These results were obtained on a 2.0 cm × 2.1 mm i.d. gHSA1 column. Other experimental conditions are given in the text. The data from these experiments were fit to (a) a direct competition model, as described by Eq. (5), or (b) an allosteric model, as described by Eq. (6). Each point is the average of four values with relative standard deviations that ranged from (a) ± 0.3–8.7% or (b) ± 0.02–11%. The equation for the best-fit line in (b) is y = [−1.0 (± 0.1) × 10−6] x + [−1.2 (± 0.1)], with a correlation coefficient of 0.9976 (n = 7).
Eq. (6) was used to further examine this data and to test for the presence of an allosteric interaction between glimepiride and R-warfarin [26].
| (6) |
The term k0 in Eq. (6) is the retention factor for the injected probe (A, which was R-warfarin in this case) in the presence of no competing agent, and k is the retention factor for the same probe in the presence of a given mobile phase concentration of the competing agent (I, which was glimepiride in this experiment). The term KaI is the association equilibrium constant for the competing agent at the site at which it is binding during the allosteric interaction. The allosteric effect of this competing agent on binding by the probe to the immobilized agent is described by the coupling constant βI→A. A value of βI→A that is greater than zero but less than 1 indicates that a negative allosteric effect is present between I and A [26]. A positive allosteric effect is present when βI→A is greater than 1, direct competition between the probe and competing agent is present when βI→A is equal to 0, and no competition is present when βI→A is equal to 1 [26]. According to Eq. (6), a linear response should be obtained for any of these systems when a plot is made of k0/(k − k0) vs. 1/[I]. The slope and intercept from the fit of the data to Eq. (6) can then be used to determine the value of KaI for the competing agent and the coupling constant βI→A [26].
Fig. 6(b) shows the plot of k0/(k − k0) vs. 1/[Glimepiride] that was obtained when R-warfarin was injected as a probe onto a normal HSA column. Similar plots were obtained with the glycated HSA columns. Each of these graphs gave a linear relationship with correlation coefficients that ranged from −0.9937 to −0.9998 (n = 7). Table 2 lists the association equilibrium constants and coupling constants that were determined from these plots. The results for normal HSA gave an association equilibrium constant of 5.5 (± 0.3) × 105 M−1 for glimepiride and a coupling constant of 0.13 (± 0.01) for its effect on R-warfarin, which indicated that negative allosteric effects were taking place between these two solutes. Similar results were obtained for gHSA1 and gHSA2, which gave association equilibrium constants of 11.5 (± 0.1) × 105 M−1 and 12.4 (± 0.1) × 105 M−1 for glimepiride, respectively, and coupling constants of 0.14 (± 0.01) and 0.13 (± 0.01). These KaI values were in the same range as the Ka1 values that were measured for glimepiride by frontal analysis (see Table 1). This similarity indicated that this interaction site was one of the high affinity regions for glimepiride on normal HSA and glycated HSA.
A comparison was also made between the results that were obtained according to Eq. (6) for the normal HSA versus glycated HSA columns. For instance, a 2.1-fold (110%) increase was observed when comparing the affinity of glimepiride at the site on normal HSA and gHSA1 that had the allosteric effect on binding by R-warfarin. The affinity for glimepiride at the same region on gHSA2 was 2.3-fold (125%) higher than it was for normal HSA. All of these differences were significant at 95% confidence interval. However, there was no significant difference in the coupling constants between glimepiride and R-warfarin for these columns.
The next item considered was whether this allosteric effect between glimepiride and warfarin was occurring at different regions within Sudlow site I or between Sudlow site I and a separate site on HSA. This was examined by using a modified approach based on reversed-role competition studies in which glimepiride was now the injected probe and racemic warfarin was used as the competing agent in the mobile phase. Eqs. (7–8) show how the overall retention factor (k) for an analyte with more than one possible binding site (e.g., glimepiride) is related to the sum of the retention factors for this analyte at a series of n independent sites (k1…kn) (Note: the presence of allosteric effects between two sites is one situation in which the retention factors would not be strictly additive). Eq. (8) is an expanded form of Eq. (7), as derived for this current study, which also makes it possible to consider the effects of a competing agent I and the concentration of this agent, [I], on retention by the analyte at one or more sites at which both the analyte and competing agent can bind.
| (7) |
| (8) |
In these equations, the association equilibrium constants for the analyte at sites 1 through n are described by KaA1 through KaAn, while KaI1 through KaIn represent the association equilibrium constants for the competing agent at the same sites.
To examine the interactions of glimepiride at Sudlow site I during these reversed-role competition experiments, the measured retention factor for glimepiride was corrected for the known interactions of this drug at Sudlow site II and at its weak affinity regions. For instance, the retention factor for glimepiride at Sudlow site II was determined by using the binding constants found in the competition studies with L-tryptophan, as are provided in Table 2. The retention factor for glimepiride at its weak affinity sites was determined from the binding parameters and frontal analysis experimental results that are shown in Table 1. Binding at Sudlow site II made up between 6 and 71% of the total retention factor measured for glimepiride in the presence of the various concentrations of warfarin that were present in the mobile phase during the reversed-role competition studies. The contribution of the weak affinity interactions made up 2 to 20% of the total retention for glimepiride under the same conditions.
An example of a plot that was made according to Eq. (5) of the reciprocal of the corrected retention factor for glimepiride (1/kGlimepiride,Corrected) versus the concentration of warfarin in the mobile phase is shown in Fig. 7(a). A linear region was seen in these plots at low warfarin concentrations, which gave correlation coefficients ranging from 0.9788 to 0.9999 (n = 4) for the normal and glycated HSA columns. The association equilibrium constants that were estimated from this region for warfarin were 1.5 (± 0.1) × 105 M−1 for normal HSA, 1.6 (± 0.1) × 105 M−1 for gHSA1, and 2.3 (± 0.4) × 105 M−1 for gHSA2. These values were comparable to previously-reported association equilibrium constants of 2.3–2.7 × 10⁵ M−1 for warfarin at Sudlow site I of normal HSA or glycated HSA [8,22]. This confirmed that both glimepiride and warfarin were binding to and competing at Sudlow site I under these conditions. However, non-linear behavior was seen at higher warfarin concentrations, which supported a model in which allosteric interactions were also occurring between the binding regions for glimepiride and warfarin within Sudlow site I. Such behavior has not been noted in prior work with other first- or second-generation sulfonylurea drugs with HSA [5–7,9–12].
Figure 7.

Plot of 1/(kGlimepiride,Corrected) versus the concentration of (a) warfarin or (b) tamoxifen in the mobile phase during reversed-role competition studies. The error bars represent a range of ± 1 S.D. Each point is the average of four values with relative standard deviations that ranged from (a) ± 0.4–7.5% or (b) ± 0.5–10.2%.
3.6. Interactions with the Tamoxifen Site
Previous studies have shown that the binding of warfarin to Sudlow site I is allosterically-linked to the tamoxifen site of HSA [26,60]. Thus, zonal elution competition experiments were conducted to see if glimepiride and tamoxifen (i.e., a probe for the tamoxifen site) [64,65] also had allosteric interactions on normal HSA or glycated HSA. When Eq. (5) was used to analyze the results from these experiments, the plots that were obtained had negative slopes, as shown by the example in Fig. 8(a). This behavior meant that there was an increase in the binding strength of tamoxifen to HSA as the mobile phase concentration of glimepiride was increased, which could have been caused by a positive allosteric effect between glimepiride and tamoxifen [26].
Figure 8.

Zonal elution competition studies using glimepiride as a competing agent and tamoxifen as an injected probe for the tamoxifen site. These results were obtained on a 2.0 cm × 2.1 mm i.d. column containing normal HSA. Other experimental conditions are given in the text. The data from these experiments were fit to (a) a direct competition model, as described by Eq. (5), or (b) an allosteric model, as described by Eq. (6). Each point is the average of four values with relative standard deviations that ranged from (a) ± 0.8–6.8% or (b) ± 1.5–32%. The equation for the best-fit solid line in (b) is y = [2.9 (± 0.1) × 10−6] x + [1.2 (± 0.1) × 10−1], with a correlation coefficient of 0.9991 (n = 7).
Further analysis of this behavior was carried out by fitting the data to Eq. (6). Fig. 8(b) shows a typical graph that was obtained. Plots of k0/(k−k0) vs. 1/[Glimepiride] gave linear fits with positive slopes and correlation coefficients that ranged from 0.9982–0.9992 (n = 7) for the normal HSA and glycated HSA columns. The best-fit line to Eq. (6) gave an association equilibrium constant for glimepiride of 4.1 (± 0.9) × 104 M−1 at its region of interaction with tamoxifen on normal HSA. The coupling constant for this interaction was 9.5 (± 2.2), which represented a positive allosteric interaction [60]. Similar results were obtained for the gHSA1 and gHSA2 samples, which resulted in coupling constants of 6.3 (± 0.9) and 4.6 (± 0.5), respectively, along with association equilibrium constants for glimepiride of 7.9 (± 0.9) × 104 M−1 and 12.2 (± 1.4) × 104 M−1.
These results were compared for normal HSA and glycated HSA. A 1.9- or 3.0-fold increase in the association equilibrium constant for glimepiride during this interaction was observed in going from normal HSA to gHSA1 or gHSA2, respectively. Each of these differences was significant at the 95% confidence interval. The coupling constants for the same interactions showed an overall decrease due to glycation. A 34–52% decrease in this value was noted in going from normal HSA to gHSA1 or gHSA2. These changes were also significant at the 95% confidence interval.
The interaction between glimepiride and the tamoxifen site on normal HSA and glycated HSA was further investigated by using reversed-role competition studies, in which glimepiride was the injected probe and tamoxifen was the competing agent. Corrections to the overall retention factor for glimepiride for the interactions of this drug at Sudlow site II and its weak affinity regions were again made, as described in the previous section, and plots were prepared according to Eq. (5). Between 6 and 40% of the total retention factor for glimepiride during the reversed-role competition studies was due to binding by this drug at Sudlow site II, while the weak affinity regions contributed 1 to 10%. As shown in Fig. 7(b), a plot of 1/kGlimepiride,Corrected versus the concentration of tamoxifen resulted in a non-linear relationship. This behavior confirmed that allosteric effects were present during the interactions of tamoxifen and glimepiride with normal HSA or glycated HSA.
4. Conclusion
This report explored the use of HPAC to examine the binding of glimepiride, a third- generation sulfonylurea drug, to normal HSA and HSA with various levels of in vitro glycation. Previous studies based on fluorescence spectroscopy have suggested that glimepiride is capable of interacting at both Sudlow sites I and II of normal HSA [49]. The use of HPAC in various formats allowed for a more detailed analysis of these interactions and for these studies to be extended to glycated HSA. For instance, frontal analysis was used to study the overall interactions of glimepiride with normal HSA and glycated HSA. This HPAC method indicated that glimepiride had a set of both high affinity sites (Ka, 9.2–11.8 × 10⁵ M−1) and lower affinity regions (Ka, 5.9–16 × 103 M−1) on these proteins.
Site-specific studies were also conducted through the use of both normal-role zonal elution competition studies and a modified approach that was developed for this work based reversed-role zonal elution competition experiments. A summary of the results that were obtained is given in Fig. 9. The results demonstrated how these HPAC techniques could be used to study a combination of direct competition, non-competition and positive or negative allosteric interactions that were occurring between glimepiride and probes for specific sites on normal HSA and glycated HSA. In these experiments, glimepiride was found to bind to Sudlow site II with an association equilibrium constant of 4.2 × 10⁵ M−1 for normal HSA. No significant changes in this affinity were observed for moderately glycated HSA; however, a small decrease in affinity was observed for more highly glycated HSA. No interactions were found for glimepiride at the digitoxin site of normal HSA or glycated HSA. Results from the competition studies indicated that both direct competition and negative allosteric interactions can occur between glimepiride and R-warfarin (i.e., a probe for Sudlow site I), which was a unique finding of this work. Based on these competition studies, the association equilibrium constant for glimepiride at Sudlow site I was estimated to be 5.5 × 10⁵ M−1 for normal HSA, with around a two-fold increase in affinity being noted for glycated HSA. Glimepiride was also found to have positive allosteric interactions with the tamoxifen site of HSA.
Figure 9.
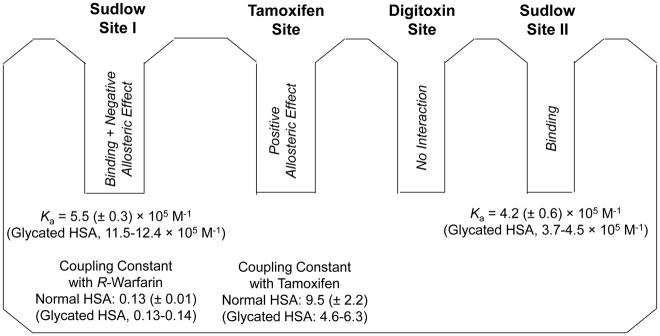
Summary of the association equilibrium constants, coupling constants and binding sites for glimepiride in its interactions with HSA. The values for normal HSA are provided first for reference, followed by the range of values that were measured for gHSA1 and gHSA2, as given in parentheses. The Ka values that are provided for Sudlow site I are based on the best-fit values that were obtained from Eq. (6).
Changes in these interactions are of interest because they could have an effect on the free fraction, or effective dose, of such a drug when it is used to treat type II diabetes [6–13]. In addition, this report shows that glycation can alter both the association equilibrium constants for a drug like glimepiride with HSA and the extent of competition or allosteric effects this drug may have with other drugs or solutes that can bind to the same protein. The results of this study also demonstrate how separation systems and formats based on HPAC can be used to examine complex drug-protein interactions and systems involving either normal or modified proteins. These experiments can be easily automated and were often carried out in this study in less than 12 min (e.g., 1–7 min for a typical zonal elution experiment and 4–12 for frontal analysis). In addition, it is possible to conduct hundreds of experiments on a single column and using the same batch of protein or modified protein, which helped in this report to provide good precision and the ability to detect changes in binding constants that were as small as 12–18% (i.e., as noted for the effects of glycation at Sudlow site II). The same features should make these methods attractive in future work with other drugs and modified proteins and in the analysis of alternative systems that involve complex interactions.
Highlights.
High-performance affinity chromatography was used to study a multisite interaction.
This method was used to examine binding by glimepiride with human serum albumin.
The effects of glycation on these drug-protein interactions were also examined.
Similar methods could be used with other proteins and drugs with multisite binding.
Acknowledgments
This work was funded by the NIH under grant R01 DK069629. R. Matsuda was supported under a fellowship through the Molecular Mechanisms of Disease program at the University of Nebraska.
Footnotes
Publisher's Disclaimer: This is a PDF file of an unedited manuscript that has been accepted for publication. As a service to our customers we are providing this early version of the manuscript. The manuscript will undergo copyediting, typesetting, and review of the resulting proof before it is published in its final citable form. Please note that during the production process errors may be discovered which could affect the content, and all legal disclaimers that apply to the journal pertain.
References
- 1.Gale E. Glimepiride. Review of the first available 3rd generation sulphonylurea. Practical Diabetes International. 1999;16:S1–S3. [Google Scholar]
- 2.Zavod RM, Krstenansky JL, Currie BL. In: Foye’s of Medicinal Chemistry. Lemke TL, Williams DA, editors. Chap 32 Lippincott Williams and Wilkins; Philadelphia: 2008. [Google Scholar]
- 3.Foster DW. In: Harrison’s Principles of Internal Medicine. Isselbacher KJ, Braunwald E, Wilson JD, Martin JB, Fauci AS, Kasper DL, editors. Chap 29 McGraw-Hill; New York: 1998. [Google Scholar]
- 4.Jakoby MG, Covey DF, Cistola DP. Localization of tolbutamide binding sites on human serum albumin using titration calorimetry. Biochemistry. 1995;34:8780–8787. doi: 10.1021/bi00027a029. [DOI] [PubMed] [Google Scholar]
- 5.Joseph KS, Hage DS. Characterization of the binding of sulfonylurea drugs to HSA by high-performance affinity chromatography. J Chromatogr B. 2010;878:1590–1598. doi: 10.1016/j.jchromb.2010.04.019. [DOI] [PMC free article] [PubMed] [Google Scholar]
- 6.Joseph KS, Anguizola J, Jackson AJ, Hage DS. Chromatographic analysis of acetohexamide binding to glycated human serum albumin. J Chromatogr B. 2010;878:2775–2781. doi: 10.1016/j.jchromb.2010.08.021. [DOI] [PMC free article] [PubMed] [Google Scholar]
- 7.Joseph KS, Anguizola J, Hage DS. Binding of tolbutamide to glycated human serum albumin. J Pharm Biomed Anal. 2011;54:426–432. doi: 10.1016/j.jpba.2010.09.003. [DOI] [PMC free article] [PubMed] [Google Scholar]
- 8.Joseph KS, Hage DS. The effects of glycation on the binding of human serum albumin to warfarin and L-tryptophan. J Pharm Biomed Anal. 2010;53:811–818. doi: 10.1016/j.jpba.2010.04.035. [DOI] [PMC free article] [PubMed] [Google Scholar]
- 9.Matsuda R, Anguizola J, Joseph KS, Hage DS. High-performance affinity chromatography and the analysis of drug interactions with modified proteins: binding of gliclazide with glycated human serum albumin. Anal Bioanal Chem. 2011;401:2811–2819. doi: 10.1007/s00216-011-5382-8. [DOI] [PMC free article] [PubMed] [Google Scholar]
- 10.Matsuda R, Anguizola J, Joseph KS, Hage DS. Analysis of drug interactions with modified proteins by high-performance affinity chromatography: binding of glibenclamide to normal and glycated human serum albumin. J Chromatogr A. 2012;1265:114–122. doi: 10.1016/j.chroma.2012.09.091. [DOI] [PMC free article] [PubMed] [Google Scholar]
- 11.Anguizola J, Joseph KS, Barnaby OS, Matsuda R, Alvarado G, Clarke W, Cerny RL, Hage DS. Development of affinity microcolumns for drug-protein binding studies in personalized medicine: interactions of sulfonylurea drugs with in vivo glycated human serum albumin. Anal Chem. 2013;85:4453–4460. doi: 10.1021/ac303734c. [DOI] [PMC free article] [PubMed] [Google Scholar]
- 12.Jackson AJ, Anguizola J, Pfaunmiller EL, Hage DS. Use of entrapment and high-performance affinity chromatography to compare the binding of drugs and site-specific probes with normal and glycated human serum albumin. Anal Bioanal Chem. 2013;405:5833–5841. doi: 10.1007/s00216-013-6981-3. [DOI] [PMC free article] [PubMed] [Google Scholar]
- 13.Anguizola J, Matsuda R, Barnaby OS, Joseph KS, Wa C, Debolt E, Koke M, Hage DS. Review: glycation of human serum albumin. Clin Chim Acta. 2013;425:64–76. doi: 10.1016/j.cca.2013.07.013. [DOI] [PMC free article] [PubMed] [Google Scholar]
- 14.Peters T., Jr . All About Albumin: Biochemistry, Genetics, and Medical Applications. Academic Press; San Diego: 1996. [Google Scholar]
- 15.Tietz NW, editor. Clinical Guide to Laboratory Tests. 2. Saunders; Philadelphia: 1990. [Google Scholar]
- 16.Colmenarejo G. In silico prediction of drug-binding strengths to human serum albumin. Med Res Rev. 2003;23:275–301. doi: 10.1002/med.10039. [DOI] [PubMed] [Google Scholar]
- 17.Otagiri M. A molecular functional study on the interactions of drugs with plasma proteins. Drug Metab Pharmacokinet. 2005;20:309–323. doi: 10.2133/dmpk.20.309. [DOI] [PubMed] [Google Scholar]
- 18.Curry S, Mandelkow H, Brick P, Franks N. Crystal structure of human serum albumin complexed with fatty acid reveals an asymmetric distribution of binding sites. Nature Struct Biol. 1998;5:827–835. doi: 10.1038/1869. [DOI] [PubMed] [Google Scholar]
- 19.Ascoli GA, Domenici E, Bertucci C. Drug binding to human serum albumin: abridged review of results obtained with high-performance liquid chromatography and circular dichroism. Chirality. 2006;18:667–679. doi: 10.1002/chir.20301. [DOI] [PubMed] [Google Scholar]
- 20.Sudlow G, Birkett DJ, Wade DN. Characterization of two specific drug binding sites on human serum albumin. Mol Pharmacol. 1975;11:824–832. [PubMed] [Google Scholar]
- 21.Sudlow G, Birkett DJ, Wade DN. Further characterization of specific drug binding sites on human serum albumin. Mol Pharmacol. 1976;12:1052–1061. [PubMed] [Google Scholar]
- 22.Loun B, Hage DS. Chiral separation mechanisms in protein-based HPLC columns. I. Thermodynamic studies of (R)- and (S)-warfarin binding to immobilized human serum albumin. Anal Chem. 1994;66:3814–3822. doi: 10.1021/ac00093a043. [DOI] [PubMed] [Google Scholar]
- 23.Yang J, Hage DS. Characterization of the binding and chiral separation of D- and L-tryptophan on a high-performance immobilized human serum albumin column. J Chromatogr. 1993;645:241–250. doi: 10.1016/0021-9673(93)83383-4. [DOI] [PubMed] [Google Scholar]
- 24.Sengupta A, Hage DS. Characterization of the binding of digitoxin and acetyldigitoxin to human serum albumin by high-performance affinity chromatography. J Chromatogr B. 1999;725:91–100. doi: 10.1016/s0378-4347(98)00589-1. [DOI] [PubMed] [Google Scholar]
- 25.Hage DS, Sengupta A. Studies of protein binding to non-polar solutes by using zonal elution and high-performance affinity chromatography: interactions of cis- and trans-clomiphene with human serum albumin in the presence of β-cyclodextrin. Anal Chem. 1998;70:4602–4609. doi: 10.1021/ac980734i. [DOI] [PubMed] [Google Scholar]
- 26.Chen J, Hage DS. Quantitative studies of allosteric effects by biointeraction chromatography: analysis of protein binding for low-solubility. Anal Chem. 2006;78:2672–2683. doi: 10.1021/ac052017b. [DOI] [PMC free article] [PubMed] [Google Scholar]
- 27.Matsuda R, Kye S, Anguizola J, Hage DS. Studies of drug interactions with glycated human serum albumin by high-performance affinity chromatography. Rev Anal Chem. 2014;33:79–94. doi: 10.1515/revac-2013-0029. [DOI] [PMC free article] [PubMed] [Google Scholar]
- 28.Zheng X, Matsuda R, Hage DS. Analysis of free drug fractions by ultrafast affinity extraction: interactions of sulfonylurea drugs with normal or glycated human serum albumin. J Chromatogr A. 2014;1371:82–89. doi: 10.1016/j.chroma.2014.10.092. [DOI] [PMC free article] [PubMed] [Google Scholar]
- 29.Mendez DL, Jensen RA, McElroy LA, Pena JM, Esquerra RM. The effect of non-enzymatic glycation on the unfolding of human serum albumin. Arch Biochem Biophys. 2005;444:92–99. doi: 10.1016/j.abb.2005.10.019. [DOI] [PubMed] [Google Scholar]
- 30.Koyama H, Sugioka N, Uno A, Mori S, Nakajima K. Effects of glycosylation of hypoglycemic drug binding to serum albumin. Biopharm Drug Dispos. 1997;18:791–801. doi: 10.1002/(sici)1099-081x(199712)18:9<791::aid-bdd66>3.0.co;2-1. [DOI] [PubMed] [Google Scholar]
- 31.Garlick RL, Mazer JS. The principal site of nonenzymatic glycosylation of human serum albumin in vivo. J Biol Chem. 1983;258:6142–6146. [PubMed] [Google Scholar]
- 32.Iberg N, Fluckiger R. Nonenzymatic glycosylation of albumin in vivo. J Biol Chem. 1986;261:13542–13545. [PubMed] [Google Scholar]
- 33.Nakajou K, Watanabe H, Kragh-Hansen U, Maruyama T, Otagiri M. The effect of glycation on the structure, function and biological fate of human serum albumin as revealed by recombinant mutants. Biochim Biophys Acta. 2003;1623:88–97. doi: 10.1016/j.bbagen.2003.08.001. [DOI] [PubMed] [Google Scholar]
- 34.Roohk HV, Zaidi AR. A review of glycated albumin as an intermediate glycation index for controlling diabetes. J Diabetes Sci Technol. 2008;2:1114–1121. doi: 10.1177/193229680800200620. [DOI] [PMC free article] [PubMed] [Google Scholar]
- 35.Wa C, Cerny R, Hage DS. Obtaining high sequence coverage in matrix-assisted laser desorption time-of-flight mass spectrometry for studies of protein modification: analysis of human serum albumin as a model. Anal Biochem. 2006;349:229–241. doi: 10.1016/j.ab.2005.11.015. [DOI] [PubMed] [Google Scholar]
- 36.Barnaby OS, Cerny RL, Clarke W, Hage DS. Comparison of modification sites formed on human serum albumin at various stages of glycation. Clin Chim Acta. 2011;412:277–285. doi: 10.1016/j.cca.2010.10.018. [DOI] [PMC free article] [PubMed] [Google Scholar]
- 37.Barnaby OS, Cerny RL, Clarke W, Hage DS. Quantitative analysis of glycation patterns in human serum albumin using 16O/18O-labeling and MALDI-TOF MS. Clin Chim Acta. 2011;412:1606–1615. doi: 10.1016/j.cca.2011.05.012. [DOI] [PMC free article] [PubMed] [Google Scholar]
- 38.Schiel JE, Joseph KS, Hage DS. In: Adv Chromatogr. Grinsberg N, Grushka E, editors. Chap 4 Taylor & Francis; New York: 2010. [Google Scholar]
- 39.Hage DS. High-performance affinity chromatography: a powerful tool for studying serum protein binding. J Chromatogr B. 2002;768:3–30. doi: 10.1016/s0378-4347(01)00482-0. [DOI] [PubMed] [Google Scholar]
- 40.Patel S, Wainer IW, Lough WJ. In: Handbook of Affinity Chromatography. 2. Hage DS, editor. Chap 24 Taylor & Francis; New York: 2006. [Google Scholar]
- 41.Hage DS, Anguizola J, Barnaby O, Jackson A, Yoo MJ, Papastavros E, Pfaunmiller E, Sobansky M, Tong Z. Characterization of drug interactions with serum proteins by using high-performance affinity chromatography. Curr Drug Metab. 2011;12:313–328. doi: 10.2174/138920011795202938. [DOI] [PMC free article] [PubMed] [Google Scholar]
- 42.Zheng X, Li Z, Beeram S, Podariu M, Matsuda R, Pfaunmiller EL, White CJ, II, Carter N, Hage DS. Analysis of biomolecular interactions using affinity microcolumns: a review. J Chromatogr B. 2014;968:49–63. doi: 10.1016/j.jchromb.2014.01.026. [DOI] [PMC free article] [PubMed] [Google Scholar]
- 43.Vuignier K, Guillarme D, Veuthey JL, Carrupt PA, Schappler J. High performance affinity chromatography (HPAC) as a high-throughput screening tool in drug discovery to study drug-plasma protein interactions. J Pharm Biomed Anal. 2013;74:205–212. doi: 10.1016/j.jpba.2012.10.030. [DOI] [PubMed] [Google Scholar]
- 44.Duong-Thi MD, Bergstroem G, Mandenius CF, Bergstroem M, Fex T, Ohlson S. Comparison of weak affinity chromatography and surface plasmon resonance in determining affinity of small molecules. Anal Biochem. 2014;461:57–59. doi: 10.1016/j.ab.2014.05.023. [DOI] [PubMed] [Google Scholar]
- 45.Meiby E, Simmonite H, le Strat L, Davis B, Matassova N, Moore JD, Mrosek M, Murray J, Hubbard RE, Ohlson S. Fragment screening by weak affinity chromatography: comparison with established techniques for screening against HSP90. Anal Chem. 2013;85:6756–6766. doi: 10.1021/ac400715t. [DOI] [PubMed] [Google Scholar]
- 46.Yang GX, Li X, Synder M. Investigating metabolite-protein interactions: an overview of available techniques. Methods. 2012;57:459–466. doi: 10.1016/j.ymeth.2012.06.013. [DOI] [PMC free article] [PubMed] [Google Scholar]
- 47.Matsuda R, Bi C, Anguizola J, Sobansky M, Rodriguez E, Vargas-Badilla J, Zheng X, Hage BD, Hage DS. Studies of metabolite-protein interactions: a review. J Chromatogr B. 2014;966:48–58. doi: 10.1016/j.jchromb.2013.11.043. [DOI] [PMC free article] [PubMed] [Google Scholar]
- 48.Frick A, Moller H, Wirbitzki E. Biopharmaceutical characterization of oral immediate release drug products. in vitro/in vivo comparison of phenoxymethylpenicillin potassium, glimepiride, and levofloxacin. Eur J Pharm Biopharm. 1998;46:305–311. doi: 10.1016/s0939-6411(98)00041-1. [DOI] [PubMed] [Google Scholar]
- 49.Seeder N, Kanojia M. Mechanism of interaction of hypoglycemic agents glimepiride and glipizide with human serum albumin. Cent Eur J Chem. 2009;7:96–1041. [Google Scholar]
- 50.Inukai K, Watanabe M, Nakashima Y, Takata N, Isoyama A, Sawa T, Kurihara S, Awata T, Katayama S. Glimepiride enhances peroxisome proliferator-activated receptor-gamma activity in 3T3-L1 adipocytes. Biochem Biophys Res Commun. 2005;328:484–490. doi: 10.1016/j.bbrc.2004.12.190. [DOI] [PubMed] [Google Scholar]
- 51.Ma P, Gu B, Ma J, LE, Wu X, Cao J, Liu H. Glimepiride induces proliferation and differentiation of rat osteoblasts via P13-kinease/Akt pathway. Metabolism. 2010;59:359–366. doi: 10.1016/j.metabol.2009.08.003. [DOI] [PubMed] [Google Scholar]
- 52.Lapolla A, Fedele D, Reitano R, Arico NC, Seraglia R, Traldi P, Marotta E, Tonani R. Enzymatic digestion and mass spectrometry in the study of advance glycation end products/peptides. J Am Soc Mass Spectrom. 2004;25:496–509. doi: 10.1016/j.jasms.2003.11.014. [DOI] [PubMed] [Google Scholar]
- 53.Ney KA, Colley KJ, Pizzo SV. The standardization of the thiobarbituric acid assay for nonenzymatic glucosylation of human serum albumin. Anal Biochem. 1981;118:294–300. doi: 10.1016/0003-2697(81)90585-6. [DOI] [PubMed] [Google Scholar]
- 54.Walters RR. High-performance affinity chromatography: pore-size effects. J Chromatogr A. 1982;249:19–28. [Google Scholar]
- 55.Larsson PO. High-performance liquid affinity chromatography. Methods Enzymol. 104:1984212–223. doi: 10.1016/s0076-6879(84)04091-x. [DOI] [PubMed] [Google Scholar]
- 56.Kim HS, Hage DS. Immobilization methods for affinity chromatography. In: Hage DS, editor. Handbook of Affinity Chromatography. Vol. 2. Chap 3 Taylor & Francis; New York: 2006. [Google Scholar]
- 57.Wa C, Cerny RL, Hage DS. Identification and quantitative studies of protein immobilization sites by stable isotope labeling and mass spectrometry. Anal Chem. 2006;78:7967–7977. doi: 10.1021/ac0609935. [DOI] [PMC free article] [PubMed] [Google Scholar]
- 58.Joseph KS, Moser AC, Basiaga S, Schiel JE, Hage DS. Evaluation of alternatives to warfarin as probes for Sudlow site I of human serum albumin: characterization by high-performance affinity chromatography. J Chromatogr A. 2009;1216:3492–3500. doi: 10.1016/j.chroma.2008.09.080. [DOI] [PMC free article] [PubMed] [Google Scholar]
- 59.Yalkowsky SH, Dannenfelser RM. Aquasol Database of Aqueous Solubility, Ver. 5. Univ. Ariz; Tucson: 1992. [Google Scholar]
- 60.Teko IV, Tanchuk VY, Kasheva TN, Villa AE. Estimation of aqueous solubility of chemical compounds using E-state indices. J Chem Inf Comput Sci. 2001;41:1488–1493. doi: 10.1021/ci000392t. [DOI] [PubMed] [Google Scholar]
- 61.Matsuda R, Anguizola J, Hoy KS, Hage DS. Analysis of drug-interactions by high-performance affinity chromatography: interactions of sulfonylurea drugs with normal and glycated human serum albumin. Methods Mol Biol. 2015;1286:255–277. doi: 10.1007/978-1-4939-2447-9_21. [DOI] [PubMed] [Google Scholar]
- 62.Conrad ML, Moser AC, Hage DS. Evaluation of indole-based probes for high-throughput screening of drugs binding to human serum albumin: analysis by high-performance affinity chromatography. J Sep Sci. 2009;32:1145–1155. doi: 10.1002/jssc.200800567. [DOI] [PMC free article] [PubMed] [Google Scholar]
- 63.Chen J, Hage DS. Quantitative analysis of allosteric drug-protein binding by biointeraction chromatography. Nature Biotech. 2004;22:1445–1447. doi: 10.1038/nbt1022. [DOI] [PubMed] [Google Scholar]
- 64.Sjoholm I. In: Drug-Protein Binding. Reidenburg MM, Erill S, editors. Praeger; New York: 1986. [Google Scholar]
- 65.Sengupta A, Hage DS. Characterization of minor probes for human serum albumin by high-performance affinity chromatography. Anal Chem. 1999;17:3821–3827. doi: 10.1021/ac9903499. [DOI] [PubMed] [Google Scholar]