Abstract
Background
Escherichia coli responds to acid stress by applying various physiological, metabolic, and proton-consuming mechanisms depending on the growth media composition, cell density, growth phase, pH, and aerobic or anaerobic growth conditions. It was reported that at mild acidic conditions (pH 5.8), the Hfq-associated sRNA GadY is activated. It was also reported that the two decarboxylase systems—the lysine decarboxylase system (LDS) and the glutamate decarboxylase system (GDS)—are activated to maintain intracellular balance of protons. The purpose of this study was to establish the role of GadY in high density growth of E. coli and to evaluate the possibility of using this small RNA to create an acid-resistant strain suitable for industrial applications.
Results
Parental E. coli K-12 and constitutively expressing GadY strains were grown to high cell densities in a bioreactor at pH 7.0 and pH 6.0. At pH 7.0, both strains grew to similar cell densities of 43 OD, but the constitutively expressing GadY strain produced around 6 g/L acetate compared with 10 g/L by the parental strain. At pH 6.0, the parental strain grew to an OD of 20 and produced 10 g/L of acetate while the GadY strain grew to an average OD of 31 and produced 4 g/L acetate. After analyzing 17 genes associated with acid stress, it was found that at pH 7.0 LDS was expressed in the early exponential phase and GDS was expressed in the late exponential phase in both strains. However, at pH.6.0, GDS was expressed in the late exponential phase only in the parental strain and not in the constitutively expressing GadY strain, while there was no difference in the LDS expression pattern; it was expressed in the early exponential phase in both strains. This indicates that GadY affects GDS expression at low pH since the GDS was not detected in the GadY strain at pH 6.0.
Conclusions
The constitutive expression of GadY improves E. coli growth at pH 6.0 by deactivating the expression of the GDS in the late exponential growth phase. The expression of GadY also decreases acetate production regardless of pH, which decreases the inhibitory effect of this acid on bacterial growth.
Keywords: Acid resistance, sRNA, GadY, Glutamate decarboxylase, Acetate
Background
Growing E. coli to high cell densities is the preferred method for large scale production of recombinant proteins [1]. During this process, the bacteria are being exposed to various stress parameters that can possibly affect their growth and production capability. Examples of stress parameters are dissolved oxygen (DO) concentration, pH, temperature and osmolality, as well as substrates such as glucose, and metabolites like acetate and ammonia [2]. To prevent potential growth inhibition issues, there is a continuous effort to create bacterial strains that are resistant to different stress conditions and to develop growth strategies that will minimize stress [3].
It was established that exposing E. coli to acid stress triggers physiological and metabolic changes and activates proton consuming systems [4]; each consists of two cytoplasmic decarboxylases that catalyze a proton-dependent decarboxylation reaction of an amino acid, and a membrane antiporter that exchanges external substrate for internal product [5]. Two proton-consuming acid resistance systems active at mild acidic conditions (pH 4.0–5.7) have been described in E. coli: (1) the lysine decarboxylase system (LDS) that is activated in the early exponential growth phase and consists of the enzyme CadA and the lysine/cadaverine antiporter CadB [5–7], and (2) the glutamate decarboxylase system (GDS) that is induced in the late exponential phase and is comprised of the isozymes GadA, GadB, and the glutamate/γ-aminobutyric acid (GABA) antiporter GadC [8, 9]. Two additional proton consuming systems have been described: (1) the arginine decarboxylase system (ADS) that includes the AdiA enzyme and the arginine/agmatine antiporter AdiC which is activated in extreme acid environments under anaerobic conditions [5], and, (2) the ornitine decarboxylase system (ODS) which include the SpeF enzyme and the ornithine/putrescine antiporter PotE that is not well understood [5, 10].
Small RNAs are found to be involved in E. coli exposed to different environmental stresses such as temperature, pH, nutrients concentration and oxygen level [11, 12]. These are non-coding RNA molecules comprised of 50–250 nucleotides; and so far approximately 70 have been identified experimentally [13]. The most studied sRNAs are known to bind to the chaperone Hfq protein for pairing with the target mRNA [14]. The regulatory effects of the Hfq-associated sRNAs are translation repression (e.g. OxyS in oxidative stress), translation activation (e.g. DsrA in low temperature), mRNA degradation (e.g. SgrS in glucose internalization), and mRNA stability (e.g. GadY in acid stress) [11, 14, 15].
In this study, constitutive expression of the sRNA GadY was evaluated as a possible regulator of acid resistance in E. coli grown at high glucose concentration to high density. GadY was selected since the three forms of GadY (GadY 105, GadY 90, and GadY 59) were expressed when E. coli was grown at pH 6.0 in shake flasks [15]. GadY activates the acid resistance genes gadA, gadB, and gadC which are part of the GDS, and positively regulates the target GadX mRNA, which induces the expression of the GDS [15–17]. Depending on the media and the growth phase, GDS can also be induced by 11 regulatory proteins (RpoD, RpoS, EvgAS, YdeO, GadE, GadX, GadW, Crp, TrmE, HNS, and TorR) [5]. The growth characteristics, acetate production and gene expression profile of the strain constitutively expressing GadY (GadY strain) are described in this report. The results suggest that this modified strain can resist the stress caused by lower pH and high acetate concentration.
Methods
Strains
The parental strain is E. coli K-12 MG1655 (F-, λ-, ilvG-, rfb-50, rph-1); the strain that constitutively expressed sRNA GadY (pRI-GadY) is MG1655 that was modified by Dr. Gisela Storz from the National Institute of Child Health and Human Development [15]. The pRI plasmid genotype consists of a PKK177-3 expression vector with an EcoRI site at the transcription start site (Ampr). The complete description of the creation and characterization of the strain are available in the original reference [15].
Bacterial growth
Bacteria were grown in modified LB media containing 10 g/L tryptone, 15 g/L yeast extract, 5 g/L NaCl and 5 g/L K2HPO4 at 37 °C. After sterilization, MgSO4 was added to a final concentration of 10 mM, 1 ml/L of trace elements was added and the glucose concentration was adjusted to 40 g/L [18]. A five liter bioreactor was inoculated with an overnight culture to an initial OD600 of 0.3, pH was controlled at 7.0 by 50 % (v/v) NH4OH, and the dissolved oxygen (DO) was controlled at 30 % air saturation. Bacterial density was measured at OD600 with Ultrospec 3000 UV/V spectrophotometer (GE Healthcare Bio-Sciences, Pittsburgh, PA, USA). Samples were collected and centrifuged at 13,000×g for 5 min and the cell pellet and the supernatant were kept at −80 °C for RNA extraction and metabolites analysis. For acid stress experiment, the culture was grown at pH 7.0 to the middle of the exponential log phase; at that point the pH was reduced to 5.0 with 0.5 M acetic acid for a period of 2 h and then was adjusted back to pH 7.0 with 50 % (v/v) NH4OH. For the growth experiments at pH 6.0, the culture grew at initial pH 7.0 without pH control until the pH decreased naturally to pH 6.0 and was maintained constant with 50 % (v/v) NH4OH. For evaluating the pH effect on bacterial growth, the pH of the culture grown at pH 7.0 was adjusted to 5.0 with 0.5 M acetic acid or with 0.5 M phosphoric acid at a cell density of 2 OD. Experiments were performed in duplicates.
RNA extraction
The Hot phenol method was used for RNA extraction [18]. The cell pellets were resuspended in 0.5 % SDS, 20 mM sodium acetate and 10 mM EDTA and extracted twice with hot acid phenol: chloroform (5:1, pH 4.5) followed by two extractions with phenol:chloroform:isoamyl alcohol (25:24:1). Ethanol was added and the mixture was kept at −80 °C for 15 min before centrifugation at 14,000×g for 15 min; the pellets were washed with 70 % (v/v) ethanol, air dried and resuspended in ultrapure water. Total RNA concentration was estimated by measuring optical density at 260 nm using the NanoDrop 2000/2000c spectrophotometer, and integrity was visualized on a 2 % agarose gel.
Northern blot analyses
Northern blot analyses were performed as described previously [18]. 5 μg of total RNA were separated on a TBE 10 % urea polyacrylamide gel (BioRad, Hercules, CA, USA) and transferred to a positively charged nylon membrane (BioRad, Hercules, CA, USA). A 5′-biotinylated sRNA-specific probe and the Bright-Star® Biodetect™ nonisotopic kit (Life Technologies, Grand Island, NY, USA) were used for probing and detection. The membranes were probed, washed and conjugated with streptavidin–alkaline phosphatase using the BrightStar® Biodetect™ Kit. Chemiluminescent signals were detected using the Fujifilm LAS-4000 imaging system. The 5′–3′ biotinylated sequences of the sRNAs probes used were reported previously [19].
Determination of transcript levels by RT-qPCR
The total RNA extracted was treated with the Turbo DNA-free™ kit (Life Technologies, Grand Island, NY) to remove contaminating DNA. The RNA sample was incubated with the Turbo™ DNAse buffer and the Turbo™ DNAse at 37 °C for 30 min. The DNAse inactivation reagent was added to the RNA sample, incubated at room temperature for 5 min, centrifuged and the supernatant containing the RNA free of DNA was collected. The cDNA was synthesized using Maxima first strand cDNA synthesis kit for RT-qPCR (Cat. No. K1671, Life Technologies, Grand Island, NY, USA). The RNA was incubated with the Maxima enzyme mix and the template RNA at 25 °C for 10 min and then at 50 °C for 15 min. The reaction was stopped at 85 °C for 5 min. The genes analyzed were from the GDS (gadA, gadB, gadC), AGS (adiA), LDS (cadA, cadB, cadC, IldC), and other reported acid resistance genes (gadX, gadE, slp, hdeA, hdeB, hdeD, ydeO, ydeP, and rpoS). The rrsA of the 16S rRNA was selected as the normalizing gene. The primer pairs used for the RT-qPCR assay have been reported previously [20]. RT-qPCR was performed in 40 amplification cycles with each specific primer pair using SYBR® Green PCR Master Mix (Life Technologies, Grand Island, NY, USA) as signal reporter. Reactions were run on an ABI Prism 7900H Sequence Detection System. Each reaction contained 600 ng cDNA and 400 nM of sense and antisense primers in a 20 μL reaction volume. The amplification parameters used for the RT-qPCR were 1 cycle at 95 °C for 10 min, 40 two-step cycles at 95 °C for 15 s and 1 cycle at 60 °C for 1 min. Each sample was analyzed in triplicate. No template and no reverse transcriptase controls were included. The expression of the rrsA gene was used as an endogenous control to normalize the amount of mRNA obtained from a target gene. Data was analyzed using the 2−ΔΔCT method reported elsewhere [19]. The expression obtained for each time-point was normalized to the expression of each gene obtained in the parental strain under same conditions.
Metabolite analysis
Glucose and glutamate were determined by the YSI 2700 SELECT Biochemistry Analyzer (YSI Life Sciences, Yellow Springs, OH, USA). Acetate was determined by HPLC, Hewlett Packard 1100 Series using an Aminex® resin-based HPX-87H column (Bio-Rad, Hercules, CA, USA). The analysis conditions were as follows: the wavelength was 210 nm, the mobile phase was 0.008 N H2SO4, the flow rate 0.6 mL/min, and the temperature 35 °C, and utilizing organic acid analysis standard for calibration (Bio-Rad, Hercules, CA, USA). The non-dissociated form of acetate was calculated using the Henderson–Hasselbalch equation [21].
Cadaverine was determined by ion-exchange chromatography as described previously [22], using 4.6 mm internal diameter, 3.8 cm Shim-pack column No. ISC-05/S0504 (Shimadzu, Columbia, MD, USA) at 70 °C and a standard of 5 nM of cadaverine at a flow rate of 0.7 mL/min. The eluting buffer was 1 M NaCl, 0.2 M sodium citrate and the excitation and emission wavelengths were 360 and 430 nm, respectively. The post column fluorometric determination was done by reaction with fluoraldehyde OPA (o-phthalaldehyde) solution (Thermo Scientific, Rockford, IL, USA), collecting data using the PowerChrom 280 system (eDAQ Pty Ltd, Colorado Springs, CO, USA).
Results
Parental and GadY E. coli strains were grown to high density in complex media in controlled bioreactor at pH 7.0 and 6.0. The growth parameters and the expression of genes related to acid stress response were measured and analyzed in early and late exponential growth phases. The genes evaluated by RT-qPCR were: gadA, gadB, and gadC from the GDS; cadA, cadB, and cadC genes from the LDS; and the adiA from the ADS. In addition, the following genes (not associated with a specific metabolic pathway) were also analyzed: ldcC, gadX, hdeA, hdeB, hdeD, rpoS, slp, ydeO, ydeP, and gadE.
GadY expression in the parental E. coli grown at pH 7.0 and exposed temporarily to pH 5.0
To check the expression of GadY at high cell density culture, the parental strain was grown in a bioreactor at pH 7.0 and was exposed to pH 5.0 for 2 h in the middle of the exponential phase before adjusting the pH back to 7.0. The growth parameters and GadY expression are described in Fig. 1a, b. At pH 7.0, the three forms of GadY (GadY 105, GadY 90, and GadY 59) were expressed throughout the early and late exponential phases. This pattern was similar to the one reported when the bacteria was grown at pH 5.7 in shake flasks (Fig. 1a) [15]. However, when the pH of the growing culture was lowered to pH 5.0 for 2 h, the bacterial growth and the expression of GadY decreased considerably (Fig. 1b). The correlation between the GadY expression and the bacterial growth suggests that constitutively expressing GadY in E. coli may enhance the bacterial ability to overcome acid stress. To investigate this, GadY was constitutively expressed in E. coli and cultured at pH 7.0 (Fig. 2), the growth pattern was comparable to the parental strain (Fig. 1a); but acetate produced by the GadY strain was 6 g/L compared with 11 g/L produced by the parental strain.
-
2.
Growth and acetate production patterns of parental and GadY strains at pH 6.0.
Fig. 1.
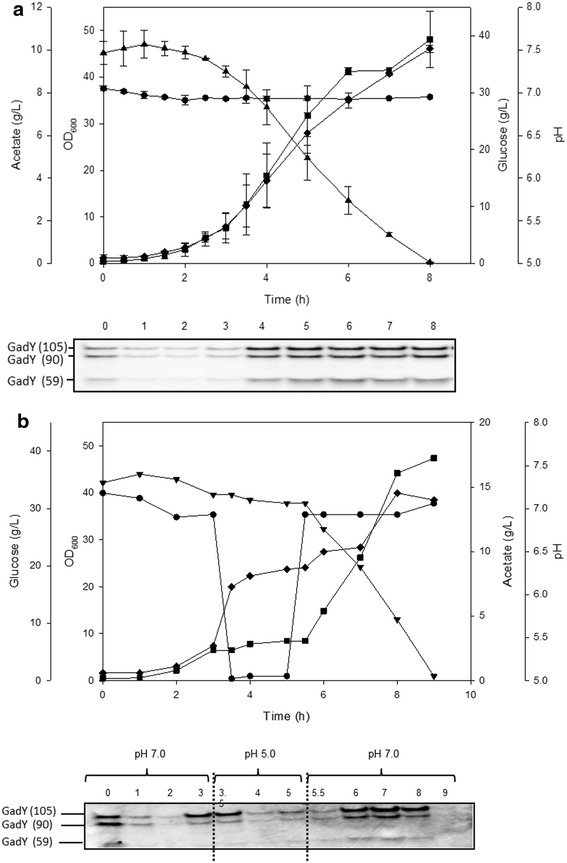
Cell growth parameters and GadY expression of E. coli MG1655 parental strain growing at a pH 7.0 and b pH 7.0 with temporal exposure to pH 5.0. Filled square OD600, filled triangle glucose (g/L), filled diamond acetate (g/L), and filled circle pH. The cells were grown in LB media in a 4L bioreactor. For the acid stress condition the pH was decreased to 5.0 by addition of 0.5 M acetic acid. After 2 h the acid stress was removed by increasing the pH back to 7.0. The expression of GadY was evaluated by Northern Blot loading same amount of total RNA for comparison purposes
Fig. 2.
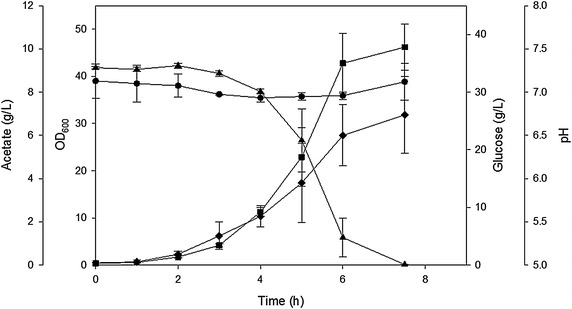
Cell growth parameters of E. coli MG1655 constitutively expressing GadY growing in LB media in a bioreactor at pH 7.0. Filled square OD600, filled triangle glucose (g/L), filled diamond acetate (g/L), and filled circle pH
Growth and acetate production patterns of the parental and the GadY strain at pH 6.0 are shown in Fig. 3a, b. At this condition, the GadY strain reached an average of 31 OD after 8 h of growth, while the parental strain reached 20 OD. At the same time, acetate production by the GadY strain was 4 g/L while the parental strain produced 10 g/L. This is an indication that constitutive expression of GadY improved the bacteria resistance to acid stress at pH 6.0; it reduced acetate accumulation and allowed the cells to grow to higher density.
-
3.
Effect of acetic and phosphoric acids on the growth of the parental and GadY strains.
Fig. 3.
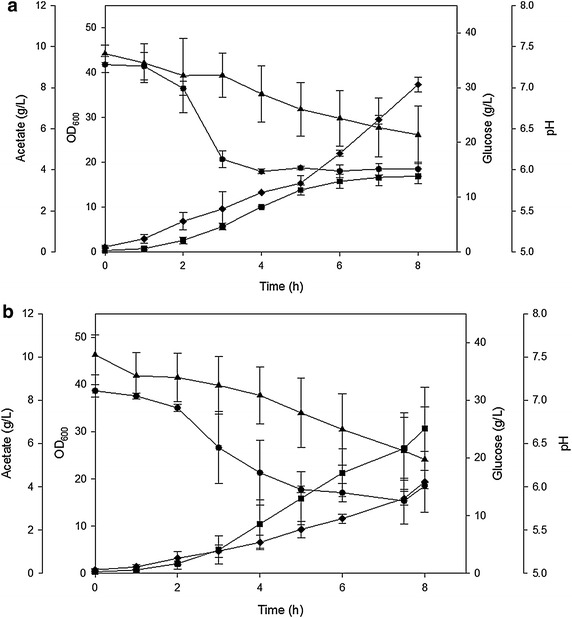
Cell growth parameters of E. coli MG1655 growing in bioreactor at pH 6.0 naturally decreased. a Parental strain and b GadY strain. Filled square OD600, filled triangle glucose (g/L), filled diamond acetate (g/L), and filled circle pH
The growth patterns of the parental and the GadY strains in media where the pH was adjusted to 6.0 by adding 0.5 M acetic acid, and in media where the pH was adjusted to 6.0 by adding 0.5 M phosphoric acid are shown in Fig. 4a, b. The results indicated that the parental stain was affected by the acetic acid but not by the phosphoric acid: it grew to an OD of 7 in the presence of acetic acid and to an OD of 14 in the presence of phosphoric acid. At the same conditions, the GadY strain grew similarly in presence of acetic acid and phosphoric acid; it grew to an OD of 15 in the presence of acetic acid and to an OD of 17 in the presence of phosphoric acid. The concentration of the non-dissociated acetate was determined and was found to be lower in the GadY strain than in the parental strain in both acid conditions (Table 1). The concentration of non-dissociated acetate was 57 and 88 mM for the GadY strain and the parental strain, respectively. This strain was not affected by acetate or by lowering the pH with phosphoric acid, an indication that GadY provides resistance to acetate and not to the effect of low pH.
-
4.
Role of the GDS and LDS in the growth of parental and GadY strains at pH 6.0.
Fig. 4.
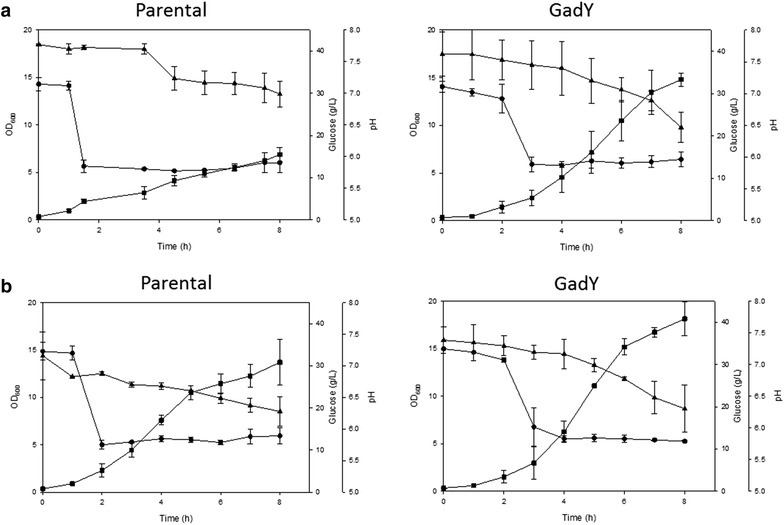
Cell growth parameters of E. coli MG1655 parental and GadY strains growing in bioreactor at pH 6.0. At OD 2.0 the pH was decreased from 7.0 to 6.0 by the addition of a acetic acid or b phosphoric acid. Filled square OD600, filled triangle glucose (g/L), and filled circle pH
Table 1.
Total acetate and non-dissociated acetate concentration in late exponential phase of E. coli MG1655 parental and GadY strains grown at pH 6.0 by the addition of acetic acid or phosphoric acid
| Strain | Acid added | Non-dissociated acetate (mM) | Total acetate (g/L) |
|---|---|---|---|
| Parental | Acetic acid | 88 | 5.3 |
| Parental | Phosphoric acid | 68 | 5.4 |
| GadY+ | Acetic acid | 57 | 5.3 |
| GadY+ | Phosphoric acid | 39 | 4.4 |
For the purpose of explaining the resistance to acetate and lower pH provided by GadY, the expression of the 17 genes reported to be associated with acid resistance was evaluated by RT-qPCR in the parental and in the GadY strains growing at pH 6.0 and 7.0. The expression ratio of the different genes between the GadY strain and the parental strain are presented in Fig. 5. The expression of LDS in early exponential phase and the GDS in the late exponential phase in the GadY strain grown to high density at pH 7.0 (Fig. 5) were found to be similar to the previously reported expression patterns of these two systems in E. coli grown at pH 6.0 [5, 7, 8]. However, when the GadY strain was grown at pH 6.0, the LDS was expressed in the early exponential phase as was observed in pH 7.0, but the GDS was not expressed in the late exponential phase, an indication that high cell growth of E. coli at low pH is independent of the expression of the GDS.
Fig. 5.
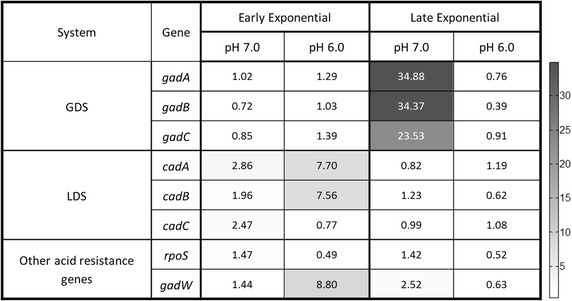
Expressed genes associated to acid resistance in E. coli MG1655 GadY strain. The gene expression was determined by RT-qPCR using the ssrA gene as internal control. The results are expressed in copy number using the parental strain grown under same conditions as reference
The results of gene expression of the LDS and the GDS were confirmed by measuring the cadaverine (Fig. 6) and glutamate (Fig. 7) concentrations in the growth media at early and late exponential phases of the two strains at both pH 6.0 and 7.0. The concentration of cadaverine in the early and late exponential phase was considerably higher in both strains at pH 6.0 than at pH 7.0 (Fig. 6), an indication that at pH 6.0 the LDS is more active than at pH 7.0. When the bacteria grew at pH 7.0, both strains completely consumed the glutamate in the media (Fig. 7). However, at pH 6.0, the partial consumption of glutamate by the parental strain growing at pH 6.0 was associated with the limited growth observed in Fig. 3a. The data obtained showed that the constitutive expression of GadY improves E. coli growth at pH 6.0 by activating the LDS and by decreasing acetate production, and consequently, minimizing the inhibitory effect of acetate accumulation.
Fig. 6.
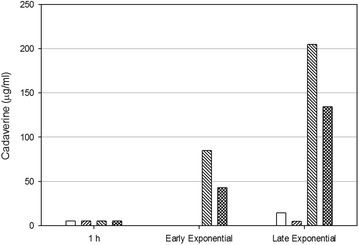
Cadaverine concentration determined in the media from early and late exponential phase of E. coli MG1655 parental and GadY strains. White bars for parental strain at pH 7.0, right stripes for GadY strain at pH 7.0, left stripes for parental strain at pH 6.0, and checked bars for GadY strain at pH 6.0
Fig. 7.
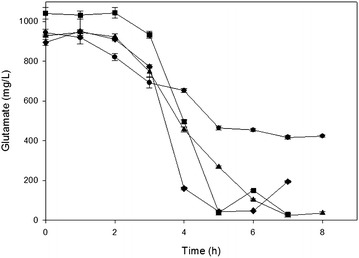
Glutamate consumption by E. coli MG1655 growing in bioreactor. Filled square parental strain at pH 7.0, filled triangle parental strain at pH 6.0, filled diamond GadY strain at pH 7.0, and filled circle GadY strain at pH 6.0
Discussion
The information presented in this study showed that compared with the parental E. coli MG1655 strain, the strain which constitutively expressed the small RNA GadY grew to higher OD at pH 6.0 and produced lower amounts of acetate at both pH 6.0 and 7.0. These results suggest that GadY has a role in the bacterial resistance to acid stress and in reducing acetate production. Acetate is well known to affect growth and recombinant protein production [23, 24], and, therefore, a strain constitutively expressing GadY may be beneficial for industrial application.
No significant difference was observed when the two strains were grown at pH 7.0 concerning bacterial density; however, acetate production from the GadY strain was about 40 % lower. When grown at pH 6.0, the GadY strain grew to higher than the parental strain and also produced less acetate. When evaluating the growth of the GadY strain and the parental strain at pH 6.0 that was generated either by acetic acid or by phosphoric acid, the GadY strain grew comparably in both acids while the parental strain was affected by the acetate and not by the phosphoric acid.
It was previously reported that growth inhibition and cellular damage are caused by the relative concentrations of dissociated acetate (CH3COO–) and non-dissociated (CH3COOH) acetate; where the non-dissociated form is more toxic [21, 23, 25–27]. It was determined that the concentration of the toxic non-dissociated acetate was higher (88 mM) in the culture of the parental strain which possibility caused the cells to grow to lower density in the presence of acetate than in the presence of phosphoric acid. On the other hand, the GadY strain reached similar growth in the presence of either acetic acid or phosphoric acid, likely as a result of the lower concentration of the toxic, non-dissociated from of acetate (57 mM).
The different response of the GadY strain to acid stress can be explained by expression of genes associated with acid stress, the rpoS gene, and the glutamate concentration. Response to acid stress in E. coli has been associated with expression of seventeen genes [20]. Therefore, the expression of these genes was measured in the parental and GadY strains grown at both pH 7.0 and 6.0. The analysis showed that GadY affected the expression of RpoS, GadW, and the genes of both the LDS and the GDS (Fig. 5).
In the GadY strain grown at pH 7.0, the LDS was activated in the early exponential growth phase and the GDS in the late exponential phase, suggesting that both the LDS and the GDS have a role in maintaining intracellular homeostasis linked to acetate accumulation at pH 7.0. This differs from the induction of the GDS and the LDS described previously as acid stress response in E. coli grown at pH 5.8 [5, 7–9, 28, 29]. As observed in this work, the expression of the LDS and the GDS in the GadY strain grown at pH 7.0 is linked to acetate accumulation and not to low pH. The interaction between GadY and the GDS has been previously observed in an acid response regulatory network described in Fig. 8 [5, 15]. In that network, GadY induced GadX, which then activated GadW and the expression of the GDS directly or via gadE. In this study, GadY activated the GDS at pH 7.0 independent of gadE, gadX, and gadW as these three genes were not expressed. Also, it has been reported that the GDS can be induced either by acetate accumulation or by GadW via GadE in the presence of acetate [29–33]. Our results indicated that GadY activated GDS at pH 7.0 possibly, by an alternative mechanism to GadE, GadX, and GadW or by acetate accumulation.
Fig. 8.
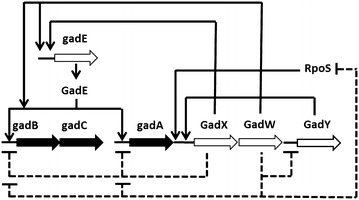
Regulatory network of the glutamate-dependent acid resistance. Modified from Foster, 2004. Large arrows represent genes, small arrows indicate positive control, and dotted lines denote negative control. The genes for the GDS are represented as solid black arrows
Unlike the behavior at pH 7.0, GDS was not induced at pH 6.0 during the late exponential growth phase (Fig. 5), which disagrees with previous studies where GDS was activated in the late exponential phase regardless of the pH [5, 15]. This can be explained by the lower acetate concentration or by the effect of GadY on GadX and or GadW resulting with reducing GDS activation [16, 33–35].
The general stress regulator RpoS was not expressed in the GadY strain at pH 6.0 nor pH 7.0. The higher cell density reached by this strain compared to the parental strain at pH 6.0 suggests acid protective characteristics of GadY independent of RpoS. This agrees with previous reports where acid stress responses were induced in the absence of RpoS [8]. Another explanation for the non-expression of RpoS is that this global regulator may have degraded before it was analyzed [36].
Based on the presented observations, we hypothesize that the improved cell growth of the GadY strain is associated with glutamate concentration in the media. It is known that glutamate enters the TCA cycle providing 88 % of the cellular Nitrogen [37]. The higher cell growth of the GadY strain at pH 6.0 showed low concentration of glutamate, probably as a result of being metabolized by the TCA cycle to maintain cell growth. This hypothesis is supported by the growth profile of the parental strain at pH 6.0 which coincided with high concentration of glutamate in the media. The current study establishes a basis for the role of GadY in acid stress response at high cell growth and the benefit of incorporating this small RNA in E. coli to create a robust strain suitable for industrial application.
Conclusions
Compared with its parental E. coli strain, the strain that constitutively expresses the small RNA GadY produced less acetate at both pH 6.0 and 7.0 and grew better at pH 6.0. Based on these growth properties, we consider this strain to be more suitable for high density growth in a bioreactor for industrial application. It was observed that at pH 7.0, the parental and the GadY strains grew similarly and the LDS was expressed in early exponential phase and GDS was expressed in late exponential phase. At pH 6.0, the GadY strain grew better and there was no expression of GDS at the late exponential phase. This strain produced less acetate at both pH levels. It was concluded that the protective effect of GadY is likely related to the concentration of the non-dissociated form of acetate and not to the low pH itself. These findings contribute to better understanding the role of sRNA GadY in acid resistance response at high cell density cultures.
Authors’ contributions
AN participated in the design of study, performed the fermentations and molecular analysis, analyzed the results and drafted the manuscript. YS participated in the design of study, coordination, and in the writing of the manuscript. Both authors read and approved the final manuscript.
Acknowledgements
Funding was provided by the Intramural program at the National Institute of Diabetes and Digestive and Kidney Diseases, National Institutes of Health. The authors would like to thank Dr. Gisela Storz for providing the GadY constitutively expressing strain and Mrs. D. Livnat for helping editing the manuscript.
Compliance with ethical guidelines
Competing interests The authors declare that they have no competing interests.
Abbreviations
- LDS
lysine decarboxylase system
- GDS
glutamate decarboxylase system
- ADS
arginine decarboxylase system
- ODS
ornitine decarboxylase system
- GABA
γ-aminobutyric acid
- DO
dissolved oxygen
- OD600
Optical density at 600 nm
- RT-Qpcr
quantitative real-time polymerase chain reaction
- TCA
trichloroacetic acid
- sRNA
small RNA
- ssrA
small RNA encoding transcription unit used as internal control
References
- 1.Baeshen MN, Al-Hejin A, Bora RS, Ahmed MM, Ramadan HA, Saini KS, Baeshen NA, Redwan EM. Production of biopharmaceuticals in E. coli: current scenario and future perspectives. J Microbiol Biotechnol. 2015;25:953–962. doi: 10.4014/jmb.1412.12079. [DOI] [PubMed] [Google Scholar]
- 2.Shimizu K. Metabolic regulation of a bacterial cell system with emphasis on Escherichia coli metabolism. ISRN Biochem. 2013;2013:1–47. doi: 10.1155/2013/645983. [DOI] [PMC free article] [PubMed] [Google Scholar]
- 3.Lennen RM, Herrgård MJ. Combinatorial strategies for improving multiple-stress resistance in industrially relevant Escherichia coli strains. Appl Environ Microbiol. 2014;80:6223–6242. doi: 10.1128/AEM.01542-14. [DOI] [PMC free article] [PubMed] [Google Scholar]
- 4.Kanjee U, Houry WA. Mechanisms of acid resistance in Escherichia coli. Annu Rev Microbiol. 2013;67:65–81. doi: 10.1146/annurev-micro-092412-155708. [DOI] [PubMed] [Google Scholar]
- 5.Foster JW. Escherichia coli acid resistance: tales of an amateur acidophile. Nat Rev Microbiol. 2004;2:898–907. doi: 10.1038/nrmicro1021. [DOI] [PubMed] [Google Scholar]
- 6.Tetsch L, Koller C, Haneburger I, Jung K. The membrane-integrated transcriptional activator CadC of Escherichia coli senses lysine indirectly via the interaction with the lysine permease LysP. Mol Microbiol. 2008;67:570–583. doi: 10.1111/j.1365-2958.2007.06070.x. [DOI] [PubMed] [Google Scholar]
- 7.Kanjee U, Gutsche I, Alexopoulos E, Zhao B, Thibault G, Liu K, Ramachandran S, Snider J, Pai EF, Houry WA. Linking the bacterial acid stress and stringent responses: the structure of the inducible lysine decarboxylase. EMBO J. 2011;30:931–944. doi: 10.1038/emboj.2011.5. [DOI] [PMC free article] [PubMed] [Google Scholar]
- 8.Castanie-Cornet MP, Penfound TA, Smith D, Elliott JF, Foster JW. Control of acid resistance in Escherichia coli. J Bacteriol. 1999;181:3525–3535. doi: 10.1128/jb.181.11.3525-3535.1999. [DOI] [PMC free article] [PubMed] [Google Scholar]
- 9.De Biase D, Tramonti A, Bossa F, Visca P. The response to stationary-phase stress conditions in Escherichia coli: role and regulation of the glutamic acid decarboxylase system. Mol Microbiol. 1999;32:1198–1211. doi: 10.1046/j.1365-2958.1999.01430.x. [DOI] [PubMed] [Google Scholar]
- 10.Kashiwagi K, Suzuki T, Suzuki F, Furuchi T, Kobayashi H, Igarashi K. Coexistence of the genes for putrescine transport protein and ornithine decarboxylase at 16 min on Escherichia coli chromosome. J Biol Chem. 1991;266:20922–20927. [PubMed] [Google Scholar]
- 11.Gottesman S, McCullen CA, Guillier M, Vanderpool CK, Majdalani N, Benhammou J, Thompson KM, FitzGerald PC, Sowa NA, FitzGerald DJ. Small RNA regulators and the bacterial response to stress. Cold Spring Harb Symp Quant Biol. 2006;71:1–11. doi: 10.1101/sqb.2006.71.016. [DOI] [PMC free article] [PubMed] [Google Scholar]
- 12.Hoe CH, Raabe CA, Rozhdestvensky TS, Tang TH. Bacterial sRNAs: regulation in stress. Int J Med Microbiol. 2013;303:217–229. doi: 10.1016/j.ijmm.2013.04.002. [DOI] [PubMed] [Google Scholar]
- 13.Vogel J, Sharma CM. How to find small non-coding RNAs in bacteria. Biol Chem. 2005;386:1219–1238. doi: 10.1515/BC.2005.140. [DOI] [PubMed] [Google Scholar]
- 14.Storz G, Opdyke JA, Zhang A. Controlling mRNA stability and translation with small, noncoding RNAs. Curr Opin Microbiol. 2004;7:140–144. doi: 10.1016/j.mib.2004.02.015. [DOI] [PubMed] [Google Scholar]
- 15.Opdyke JA, Kang JG, Storz G. GadY, a small-RNA regulator of acid response genes in Escherichia coli. J Bacteriol. 2004;186:6698–6705. doi: 10.1128/JB.186.20.6698-6705.2004. [DOI] [PMC free article] [PubMed] [Google Scholar]
- 16.Ma Z, Richard H, Tucker DL, Conway T, Foster JW. Collaborative regulation of Escherichia coli glutamate-dependent acid resistance by two AraC-like regulators, GadX and GadW (YhiW) J Bacteriol. 2002;184:7001–7012. doi: 10.1128/JB.184.24.7001-7012.2002. [DOI] [PMC free article] [PubMed] [Google Scholar]
- 17.Waters LS, Storz G. Regulatory RNAs in bacteria. Cell. 2009;136:615–628. doi: 10.1016/j.cell.2009.01.043. [DOI] [PMC free article] [PubMed] [Google Scholar]
- 18.Negrete A, Majdalani N, Phue JN, Shiloach J. Reducing acetate excretion from E. coli K-12 by over-expressing the small RNA SgrS. N Biotechnol. 2013;30:269–273. doi: 10.1016/j.nbt.2011.11.007. [DOI] [PMC free article] [PubMed] [Google Scholar]
- 19.Mandin P, Gottesman S. Integrating anaerobic/aerobic sensing and the general stress response through the ArcZ small RNA. EMBO J. 2010;29:3094–3107. doi: 10.1038/emboj.2010.179. [DOI] [PMC free article] [PubMed] [Google Scholar]
- 20.Hirakawa H, Hayashi-Nishino M, Yamaguchi A, Nishino K. Indole enhances acid resistance in Escherichia coli. Microb Pathog. 2010;49:90–94. doi: 10.1016/j.micpath.2010.05.002. [DOI] [PubMed] [Google Scholar]
- 21.Russell JB. Another explanation for the toxicity of fermentation acids at low pH: anion accumulation versus uncoupling. J Appl Bacteriol. 1992;73:363–370. doi: 10.1111/j.1365-2672.1992.tb04990.x. [DOI] [Google Scholar]
- 22.Chattopadhyay MK, Tabor CW, Tabor H. Polyamines are not required for aerobic growth of Escherichia coli: preparation of a strain with deletions in all of the genes for polyamine biosynthesis. J Bacteriol. 2009;191:5549–5552. doi: 10.1128/JB.00381-09. [DOI] [PMC free article] [PubMed] [Google Scholar]
- 23.Eiteman MA, Altman E. Overcoming acetate in Escherichia coli recombinant protein fermentations. Trends Biotechnol. 2006;24:530–536. doi: 10.1016/j.tibtech.2006.09.001. [DOI] [PubMed] [Google Scholar]
- 24.Waegeman H, Beauprez J, Moens H, Maertens J, De Mey M, Foulquié-Moreno MR, Heijnen JJ, Charlier D, Soetaert W. Effect of iclR and arcA knockouts on biomass formation and metabolic fluxes in Escherichia coli K12 and its implications on understanding the metabolism of Escherichia coli BL21 (DE3) BMC Microbiol. 2011;11:70–86. doi: 10.1186/1471-2180-11-70. [DOI] [PMC free article] [PubMed] [Google Scholar]
- 25.Presser KA, Ratkowsky DA, Ross T. Modelling the growth rate of Escherichia coli as a function of pH and lactic acid concentration. Appl Environ Microbiol. 1997;63:2355–2360. doi: 10.1128/aem.63.6.2355-2360.1997. [DOI] [PMC free article] [PubMed] [Google Scholar]
- 26.Takahashi CM, Takahashi DF, Carvalhal MLC, Alterthum F. Effects of acetate on the growth and fermentation performance of Escherichia coli KO11. Appl Biochem Biotechnol. 1999;81:193–204. doi: 10.1385/ABAB:81:3:193. [DOI] [PubMed] [Google Scholar]
- 27.Zaldivar J, Martínez A, Ingram LO. Effect of selected aldehydes on the growth and fermentation of ethanologenic Escherichia coli. Biotechnol Bioeng. 1999;65:24–33. doi: 10.1002/(SICI)1097-0290(19991005)65:1<24::AID-BIT4>3.0.CO;2-2. [DOI] [PubMed] [Google Scholar]
- 28.Castanie-Cornet MP, Foster JW. Escherichia coli acid resistance: cAMP receptor protein and a 20 bp cis-acting sequence control pH and stationary phase expression of the gadA and gadBC glutamate decarboxylase genes. Microbiology. 2001;147:709–715. doi: 10.1099/00221287-147-3-709. [DOI] [PubMed] [Google Scholar]
- 29.Tucker DL, Tucker N, Conway T. Gene expression profiling of the pH response in Escherichia coli. J Bacteriol. 2002;184:6551–6558. doi: 10.1128/JB.184.23.6551-6558.2002. [DOI] [PMC free article] [PubMed] [Google Scholar]
- 30.Arnold CN, McElhanon J, Lee A, Leonhart R, Siegele DA. Global analysis of Escherichia coli gene expression during the acetate-induced acid tolerance response. J Bacteriol. 2001;183:2178–2186. doi: 10.1128/JB.183.7.2178-2186.2001. [DOI] [PMC free article] [PubMed] [Google Scholar]
- 31.Hommais F, Krin E, Laurent-Winter C, Soutourina O, Malpertuy A, Le Caer JP, Danchin A, Bertin P. Large-scale monitoring of pleiotropic regulation of gene expression by the prokaryotic nucleoid-associated protein, H-NS. Mol Microbiol. 2001;40:20–36. doi: 10.1046/j.1365-2958.2001.02358.x. [DOI] [PubMed] [Google Scholar]
- 32.Tramonti A, De Canio M, Delany I, Scarlato V, De Biase D. Mechanisms of transcription activation exerted by GadX and GadW at the gadA and gadBC gene promoters of the glutamate-based acid resistance system in Escherichia coli. J Bacteriol. 2006;188:8118–8127. doi: 10.1128/JB.01044-06. [DOI] [PMC free article] [PubMed] [Google Scholar]
- 33.Sayed AK, Odom C, Foster JW. The Escherichia coli AraC-family regulators GadX and GadW activate gadE, the central activator of glutamate-dependent acid resistance. Microbiology. 2007;153:2584–2592. doi: 10.1099/mic.0.2007/007005-0. [DOI] [PubMed] [Google Scholar]
- 34.Shin S, Castanie-Cornet MP, Foster JW, Crawford JA, Brinkley C, Kaper JB. An activator of glutamate decarboxylase genes regulates the expression of enteropathogenic Escherichia coli virulence genes through control of the plasmid-encoded regulator. Per Mol Microbiol. 2001;41:1133–1150. doi: 10.1046/j.1365-2958.2001.02570.x. [DOI] [PubMed] [Google Scholar]
- 35.Tramonti A, Visca P, De Canio M, Falconi M, De Biase D. Functional characterization and regulation of gadX, a gene encoding an AraC/XylS-like transcriptional activator of the Escherichia coli glutamic acid decarboxylase system. J Bacteriol. 2002;184:2603–2613. doi: 10.1128/JB.184.10.2603-2613.2002. [DOI] [PMC free article] [PubMed] [Google Scholar]
- 36.Battesti A, Majdalani N, Gottesman S. Stress sigma factor RpoS degradation and translation are sensitive to the state of central metabolism. Proc Natl Acad Sci USA. 2015;112:5159–5164. doi: 10.1073/pnas.1504639112. [DOI] [PMC free article] [PubMed] [Google Scholar]
- 37.Reitzer L. Nitrogen assimilation and global regulation in Escherichia coli. Annu Rev Microbiol. 2003;57:155–176. doi: 10.1146/annurev.micro.57.030502.090820. [DOI] [PubMed] [Google Scholar]


