Abstract
Oxidative-based diseases including diabetes, chronic renal failure, cardiovascular diseases and neurological disorders are accompanied by accumulation of advanced glycation endproducts (AGE). Therefore, AGE-associated changes in tissue optical properties could yield a viable pathological indicator for disease diagnostics and monitoring. We investigated whether skin glycation could be detected based on absorption changes associated with AGE accumulation using spectral optoacoustic measurements and interrogated the optimal spectral band for skin glycation determination. Glycated and non-glycated skin was optoacoustically measured at multiple wavelengths in the visible region. The detected signals were spectrally processed and compared to measurements of skin auto-fluorescence and to second harmonic generation multiphoton microscopy images. Optoacoustic measurements are shown to be capable of detecting skin glycolysis based on AGE detection. A linear dependence was observed between optoacoustic intensity and the progression of skin glycation. The findings where corroborated by autofluorescence observations. Detection sensitivity is enhanced by observing normalised tissue spectra. This result points to a ratiometric method for skin glycation detection, specifically at 540 nm and 620 nm. We demonstrate that optoacoustic spectroscopy could be employed to detect AGE accumulation, and possibly can be employed as a non-invasive quick method for monitoring tissue glycation.
OCIS codes: (110.5125) Photoacoustics; (170.5810) Scanning microscopy; (170.6510) Spectroscopy, tissue diagnostics; (180.4315) Nonlinear microscopy
1. Introduction
The accumulation of advanced glycation endproducts (AGE)s on tissue proteins has been a contributing factor in the development and progression of different oxidative-based diseases including diabetes, chronic renal failure, cardiovascular diseases and neurological disorders [1, 2] and can predict long-term complications [2–6]. The development of a quick, non-invasive and reliable method to detect and quantify AGEs, at an early stage, could improve the longitudinal study of their onset, accumulation, and therapeutic intervention. Additionally, accurate AGE determination could provide a sought-after tool, for diagnosis and for enhancing laboratory research.
Recently, it was shown that skin autofluorescence correlates with elevated levels of AGEs, such as pentosidine and carboxymethyllysine (CML), associated with long-term complications in diabetic and hemodialysis patients [7–9]. The established correlation was used to develop a noninvasive technique, the autofluorescence reader (AFR), which is clinically approved for cardio-vascular risk assessment [8, 10]. The AFR measurement is performed on the skin using broadband illumination in the 300-420 nm, and detection in 420-600 nm spectral bands. Skin AF is reported to be approximately 30% higher in patients with type 1 or type 2 diabetes mellitus compared to age-matched controls. However, AFR averages auto-fluorescence measurements from large volumes, and exhibits non-linear dependence on depth due to the nature of photon scattering in tissues. In addition, AFR has a considerable dependence on skin reflectance, which limits its reliable application to skins with reflectance values that are higher than 6% [11]. Therefore, the measurements lack tissue specificity and its sensitivity drops depending on age, skin pigmentation and skin reflectance [9]. And though methods exits that model the influence of absorbers and scatterers on auto-fluorescence measurements [12, 13], the overall accuracy of the method remains limited [11].
Multiphoton microscopy (MPM) has been investigated as an alternative to AFR [14, 15]. By offering virtual tissue sectioning characteristics MPM can improve upon the AFR dependence on skin reflectance and bulk (averaged) skin responses. In addition, recording of second harmonic generation (SHG) signals enables the selection of collagen rich regions of tissue. When excited with wavelengths above 500 nm, collagen typically offers lower autofluorescence (AF) compared to other components constituting the dermis layer such as elastin [16]. Therefore, presence of strong autofluorescence signals within the SHG mapped collagenous lattice can be attributed almost exclusively to the AGE agents. The selective assessment of collagen-rich regions, as achieved through the effective combination of AF and SHG, can be highly advantageous over AFR in terms of sensitivity and specificity, since minimum background noise interferes with the recorded autofluorescence signals. However, a major limitation of MPM remains the superficial penetration depth, typically reaching no deeper than 200-300 µm in skin in-vivo, which hinders the detection of changes in deeper skin layers. Conversely, accumulation of AGEs is shown to primarily take place in endothelial cells, smooth muscle cells, and in vasculature [17], i.e. at depths beyond a few hundred micrometers. An additional limitation of MPM is the high instrumentation cost and the size of the instrumentation utilized, which may limit highly-disseminated or portable use.
By being insensitive to tissue photon scattering, optoacoustics can resolve optical contrast without the limitations of conventional optical methods. In particular, optoacoustic tomography has been shown to offer high-resolution imaging much deeper than the one achieved by optical microscopy [18]. Multiple wavelength illumination further imparts spectroscopy features [19, 20], whereas recent developments using small-form factor and inexpensive light sources, for example in frequency domain implementations [21], point to a method with high dissemination potential.
Herein, we explored the basic feasibility to detect tissue glycation by optoacoustic AGE measurements and resolve AGE changes as a function of skin glycation. We hypothesized that spectral optoacoustic measurements can yield sufficient sensitivity in detecting AGEs generated in tissues based on detecting AGE spectra. Correspondingly we interrogated which spectral region is suited to offer optimal AGE detection sensitivity, i.e. the spectral band that maximizes glycation detection over non-glycated tissue.
2. Materials and methods
2.1 Skin specimen preparations
Porcine skin model was used in current study as being closest to human skin based on morphological and functional similarities [22]. Samples of freshly excised porcine skin were obtained from local butchery. All samples were cut into pieces of 10 × 15 mm2. Thickness of skin samples was 3.5 mm. Tissue glycation was induced by incubating the tissue in 0.165 M ribose solution to mimic physiological hyperglycemia [23, 24]. More specifically, two samples were incubated in two 10 ml containers containing glycation solution composed of 0.1 M PBS (Sigma-Aldrich, St. Louis, MO), 1% penicillin-streptomycin (Sigma, P0781-20ML) and 0.165 M ribose (Sigma, R9629-25G), while 2 more samples were placed in 10 ml control solution each. The solution used for the control group tissues had the same chemical composition as the glycation solution with ribose excluded. All tissues were incubated at 37°C for different periods of 1, 4, 11, and 17 days. At the end of the incubation period the samples were rinsed with PBS buffer and fixed on a special holder for optoacoustic measurements or placed in glass bottom petri dish for MPAF and SHG imaging respectively.
2.2 Optoacoustic measurements
Spectrally resolved optoacoustic responses of glycated and control samples were measured in the range of 420-980 nm. The excitation was provided by a tunable, nanosecond laser (model: SpitLight Single OPO, Innolas, Krailling, Germany). The tissue sample was fixed on the glass slide, and immersed in a bath containing PBS (Fig. 1). The laser output was focused to a 1 mm2 spot on the surface of the skin. 2 spots were measured from each of 2 samples per time-lapse point and all results averaged. Optoacoustic response was measured using a 15 MHz cylindrically focused ultrasound detector (V319, Olympus Panametrics-NDT, Tokyo, Japan). Signals were first amplified using a low noise amplifier (AU-1291, Miteq Inc., USA), then digitized using a fast data acquisition card, operating at 250 MS/s (EON-121-G20, Gage-applied, Lockport, IL). The acquisition and data processing was performed in MATLAB (Mathworks, Natick, MA). Overall 1000 measurements were averaged to improve , the signals were filtered using a 4th order exponential filter. Finally, to calculate the energy of the optoacoustic signals from the different depths (), the integral of the Hilbert transform was taken spanning the depth of 3 mm from the surface of sample. was normalized by the laser energy, and the attenuation of the beam in water bath and relevant optics.
Fig. 1.
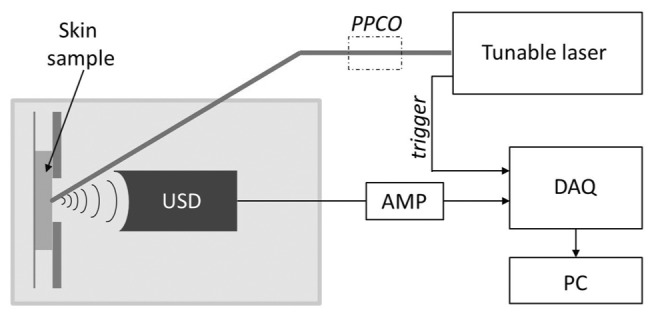
Scheme of optoacoustic acquisition. Here: PPCO – power and polarization controlling optics, USD – water immersed ultrasonic detector, AMP – amplifier, DAQ – data acquisition card.
2.3 Multi-photon microscopy
The MP microscope used in this study is similar to one previously described [25]. In brief, MPAF and SHG images were obtained using a properly modified inverted microscope (AxioObserver.D1, Zeiss, Jena, Germany) coupled to an Yb-based solid-state femtosecond laser oscillator, emitting near infrared pulsed light at a central wavelength of 1043 nm (YBIX, Time-Bandwidth, Zurich, Switzerland; pulse width: 170 fs, output average power: 2.8 W, repetition rate: 84.4 MHz). An air immersion objective (Plan Apochromat 20x/0.8, Zeiss, Jena, Germany) was used for focusing the laser source and the respective collection of the emission signal in the epi-illuminated geometry. The average power of the laser beam at the focal plane of the sample was estimated to be 65 mW. Collected MPAF/SHG signals were transmitted through a dichroic mirror (DMSP805R, Thorlabs, Newton, New Jersey, USA) and filtered by a long-pass filter (FGL550, Thorlabs) for the detection of broadband MPAF or an interference filter (FB520-10, Thorlabs) for the SHG signals respectively. A photomultiplier tube (H9305-03, Hamamatsu, Hamamatsu City, Japan) was used for the detection. The focal plane of each imaging session was selected via a high-resolution motorized piezoelectric z-stage (MZS500-E, Thorlabs), which was mounted together with a xy-stage (MLS203-2, Thorlabs) on top of the microscope. All acquired images were 600 × 600 pixels, corresponding to an area of 315 × 315 μm2 area. An-face stacks of 50 images 3 μm apart from each other were acquired for all samples.
3. Results
3.1 Optoacoustic spectroscopy
To register spectral characteristics of changes in optoacoustic response occurring upon glycation, of samples was measured for each time-point over the 420-980 nm range of excitation wavelengths with the step of 40 nm. Figure 2 shows a representative dependence of of skin samples incubated for 17 days in ribose (most glycated) and PBS (control) on the wavelength of excitation laser.
Fig. 2.
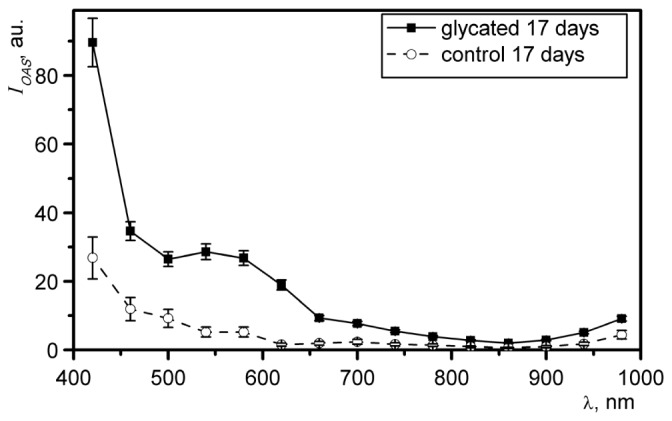
The spectra for samples of porcine skin incubated for 17 days in ribose solution (solid line) and PBS (dashed line).
To estimate the most responsive region of spectra the ratio of of glycated vs. control () was calculated for each time-point. Figure 3(a) shows over the range of 420-980. The most pronounced changes were recorded for 17 day of incubation (most glycated vs. control) and were estimated to be 5.5 ± 0.9 and 12.7 ± 2.9 for 540 nm and 620 nm respectively (shown with arrows). The peak at 620 nm was consistent for all time-points of incubation and is marked with a dashed line on Fig. 3(a). The inset (Fig. 3(b)) shows the dependance of at 620 nm on duration of incubation.
Fig. 3.
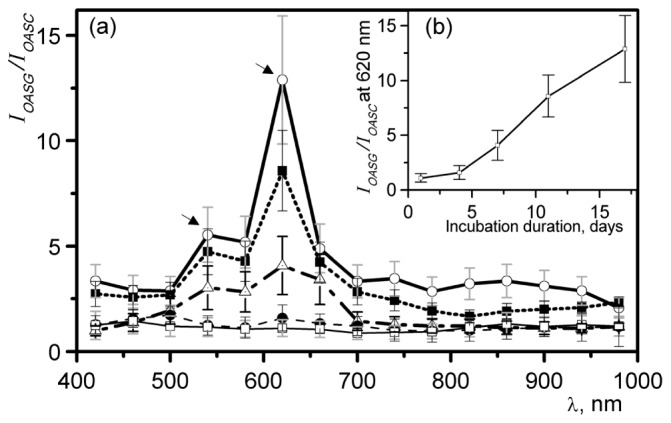
a) Ratio of optoacoustic signal intensity, obtained from glycated skin () to one obtained from control () after 1,4,7,11 and 17 days of incubation, respectively. b) Inset shows the dependence of at 620 nm on duration of incubation.
3.2 MPAF / SHG imaging
Figure 4 shows representative images of skin incubated for 17 days in 0.165 M ribose (glycated) and PBS (control) obtained at depth of 35 µm from surface. The 335 × 335 µm images were rendered by combining multiphoton autofluorescence (green) and second harmonic generation (red) channels. The depth is chosen to show both autofluorescence emitting superficial and elastin-rich layers as well as SHG emitting collagen-rich dermal layers. The apparent increase in MPAF signal of glycated specimen (Fig. 4(b)) over control (Fig. 4(b)) is characteristic of glycation-induced changes in skin and is proportional to extent of AGE accumulation [26, 27].
Fig. 4.
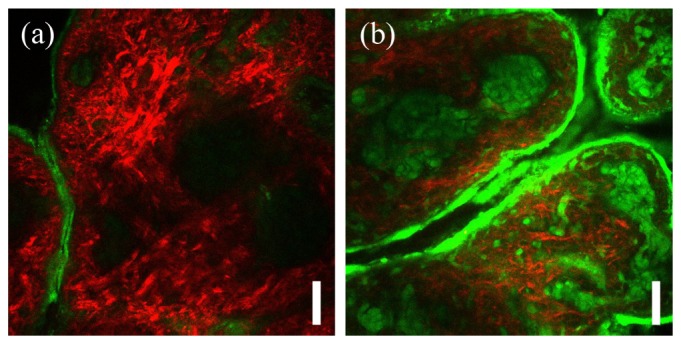
Representative microscopy images of porcine skin incubated for 17 days in a) PBS control solution and b) 0.165 M ribose solution. Shown are composite images of multiphoton autofluorescence (green) and second harmonic generation (red) channels. Images were acquired at the depth of 35 µm. Scale bar is 50 µm.
To quantify the extent of glycation-induced changes over accessible depth of MPM imaging a stack of 50 images 3 µm apart was acquired for both glycated and non-glycated skin samples - 4 specimens each. Consequently, overall intensity of MPAF and SHG channels was derived for each image and summed over all 50 images. The average over 4 samples was calculated for each incubation-time point.
Figure 5 shows the MPAF and SHG signal intensity as a function of the days of skin incubation. The intensities plotted are the average value obtained from the entire stack of images obtained from the glycated and control samples. The MPAF intensity from the glycated sample shows a 3-fold linear increase over the incubation period whereas no significant increase is recorded for the control sample. Likewise, the SHG signal does not demonstrate a dependence on the days of incubation.
Fig. 5.
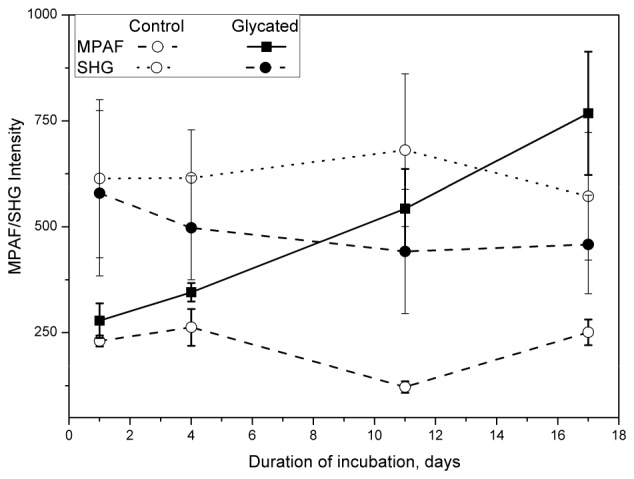
MPAF (solid lines) and SHG (dashed lines) signal intensity obtained from porcine skin as a function of days of skin incubation in 0.165 M ribose (glycated) or PBS (control). Each data point represents the average intensity recorded from 4 multiphoton microscopy images obtained over 150 µm of skin depth.
4. Discussion
In this work we examined the possibility of using optoacoustic spectroscopy to determine AGE accumulation in tissues based on their absorption spectrum IOAS. Since optoacoustic measurements are insensitive to photon scattering in tissues, measurements based on optoacoustic technology could yield an approach that improves upon limitations of purely-optical methods. To determine the feasibility of optoacoustic spectroscopy to sense glycation- induced changes we studied hyperglycated porcine skin samples and control samples. Porcine skin was chosen as the most suitable model for human skin [22, 28]. Studies examining thickness of various skin layers have shown the stratum corneum thickness in pigs is 21–26 µm while the dermal-epidermal ratio of porcine skin varies from 10:1 to 13:1, both characteristics being comparable to human skin. Note that was obtained cumulatively from 3,5 mm of skin specimens with the main contribution from dermal and subcutaneous layers 200-2000 µm (data not shown).
The glycated samples demonstrated an absorption spectrum peak () in the region 540-620 nm (see Fig. 2). This spectral feature is better visualized when normalized by control spectra, i.e. when it is presented as a ratio between of glycated and non-glycated samples. As shown on Fig. 3(a), the relative optoacoustic intensity spectrum () of 17 day glycated skin has two maxima at 540 nm and 620 nm. The peak at 620 nm exhibited a ~12.7-fold increase during the course of the 17 days of glycation in 0.165 M ribose, indicating a wavelength that may offer maximum sensitivity in detecting AGE accumulation.
Overall, at 640 nm, obtained from glycated skin samples increased virtually linearly over the incubation period of 17 days, as shown on Fig. 3(b). Corresponding multi-photon auto-fluorescence (MPAF) measurements were obtained from the same skin samples to independently evaluate glycation effects. MPAF confirmed the increasing skin glycation over the skin incubation period and demonstrated a ~3-fold increase. Nevertheless, the quantitative comparison of OAS and MPAF measurements is not warranted in this study due to the different signal processing methods and volumes sampled between multi-photon and optoacoustic spectroscopy measurements. Observation of MPAF signal increase as a function of skin glycation has also been reported for bovine and human skin samples in similar experiments [24, 29]. We further observed a slight decrease in SHG intensity, consistent with previous observations [24]. However, the SHG signal is majorly due to collagen and typically exhibits fluctuations attributed to the distribution inhomogeneity of collagen.
Optoacoustic spectroscopy may nevertheless suffer from the same limitations seen in bulk auto-fluorescence measurements, i.e. that independent changes of the optical properties of skin may affect the AGE determination. For example skin pigmentation or changes in tissue oxygenation will affect the measurements. For this reason, the application of the method of spectral imaging may be preferred to differentiate contributions from different tissue / skin compartments and reveal a more accurate picture of AGE accumulation. High-resolution optoacoustic images of the skin have for example been recently shown possible using Multispectral Optoacoustic Tomography (MSOT) [30] and Raster Scan Optoacoustic Mesoscopy (RSOM) [31]. Therefore spectral imaging could include in the future the unmixing of AGE-related spectra and minimize the sensitivity of skin pigmentation and oxy- and deoxy-hemoglobin contributions in the recorded spectra.
Overall, the reported work offers a promising method of detection and qualification of AGE accumulation that in principle can facilitate the research and treatment of age related diseases such as diabetes, renal failure and cardio-vascular disease.
Acknowledgments
This work was supported by EU grant FP7-PEOPLE-2013-IAPP number 612360, by ERC grant number 233161, by DFG grant number NT 3/9-1 and by SFB 1123 (DFG, project Z1).
References and links
- 1.Baynes J. W., “Chemical modification of proteins by lipids in diabetes,” Clin. Chem. Lab. Med. 41(9), 1159–1165 (2003). 10.1515/CCLM.2003.179 [DOI] [PubMed] [Google Scholar]
- 2.Yap F. Y. T., Kantharidis P., Coughlan M. T., Slattery R., Forbes J. M., “Advanced glycation end products as environmental risk factors for the development of type 1 diabetes,” Curr. Drug Targets 13(4), 526–540 (2012). 10.2174/138945012799499758 [DOI] [PubMed] [Google Scholar]
- 3.Li J., Liu D., Sun L., Lu Y., Zhang Z., “Advanced glycation end products and neurodegenerative diseases: Mechanisms and perspective,” J. Neurol. Sci. 317(1-2), 1–5 (2012). 10.1016/j.jns.2012.02.018 [DOI] [PubMed] [Google Scholar]
- 4.Prasad A., Bekker P., Tsimikas S., “Advanced glycation end products and diabetic cardiovascular disease,” Cardiology (in review). [DOI] [PubMed]
- 5.Yamagishi S., Maeda S., Matsui T., Ueda S., Fukami K., Okuda S., “Role of advanced glycation end products (AGEs) and oxidative stress in vascular complications in diabetes,” Biochim. Biophys. Acta 1820(5), 663–671 (2012). 10.1016/j.bbagen.2011.03.014 [DOI] [PubMed] [Google Scholar]
- 6.Del Turco S., Basta G., “An update on advanced glycation endproducts and atherosclerosis,” Biofactors 38(4), 266–274 (2012). 10.1002/biof.1018 [DOI] [PubMed] [Google Scholar]
- 7.Meerwaldt R., Graaff R., Oomen P. H. N., Links T. P., Jager J. J., Alderson N. L., Thorpe S. R., Baynes J. W., Gans R. O. B., Smit A. J., “Simple non-invasive assessment of advanced glycation endproduct accumulation,” Diabetologia 47(7), 1324–1330 (2004). 10.1007/s00125-004-1451-2 [DOI] [PubMed] [Google Scholar]
- 8.Meerwaldt R., Links T. P., Graaff R., Hoogenberg K., Lefrandt J. D., Baynes J. W., Gans R. O. B., Smit A. J., “Increased accumulation of skin advanced glycation end-products precedes and correlates with clinical manifestation of diabetic neuropathy,” Diabetologia 48(8), 1637–1644 (2005). 10.1007/s00125-005-1828-x [DOI] [PubMed] [Google Scholar]
- 9.Mulder D. J., Water T. V., Lutgers H. L., Graaff R., Gans R. O., Zijlstra F., Smit A. J., “Skin autofluorescence, a novel marker for glycemic and oxidative stress-derived advanced glycation endproducts: an overview of current clinical studies, evidence, and limitations,” Diabetes Technol. Ther. 8(5), 523–535 (2006). 10.1089/dia.2006.8.523 [DOI] [PubMed] [Google Scholar]
- 10.Lutgers H. L., Graaff R., Links T. P., Ubink-Veltmaat L. J., Bilo H. J., Gans R. O., Smit A. J., “Skin autofluorescence as a noninvasive marker of vascular damage in patients with type 2 diabetes,” Diabetes Care 29(12), 2654–2659 (2006). 10.2337/dc05-2173 [DOI] [PubMed] [Google Scholar]
- 11.Smit A. J., Smit J. M., Botterblom G. J., Mulder D. J., “Skin autofluorescence based decision tree in detection of impaired glucose tolerance and diabetes,” PLoS ONE 8(6), e65592 (2013). 10.1371/journal.pone.0065592 [DOI] [PMC free article] [PubMed] [Google Scholar]
- 12.Koetsier M., Nur E., Chunmao H., Lutgers H. L., Links T. P., Smit A. J., Rakhorst G., Graaff R., “Skin color independent assessment of aging using skin autofluorescence,” Opt. Express 18(14), 14416–14429 (2010). 10.1364/OE.18.014416 [DOI] [PubMed] [Google Scholar]
- 13.Sandby-Møller J., Poulsen T., Wulf H. C., “Influence of epidermal thickness, pigmentation and redness on skin autofluorescence,” Photochem. Photobiol. 77(6), 616–620 (2003). [DOI] [PubMed] [Google Scholar]
- 14.Ghazaryan A. A., Hu P. S., Chen S. J., Tan H. Y., Dong C. Y., “Spatial and temporal analysis of skin glycation by the use of multiphoton microscopy and spectroscopy,” J. Dermatol. Sci. 65(3), 189–195 (2012). 10.1016/j.jdermsci.2011.12.012 [DOI] [PubMed] [Google Scholar]
- 15.Tseng J. Y., Ghazaryan A. A., Lo W., Chen Y. F., Hovhannisyan V., Chen S. J., Tan H. Y., Dong C. Y., “Multiphoton spectral microscopy for imaging and quantification of tissue glycation,” Biomed. Opt. Express 2(2), 218–230 (2011). 10.1364/BOE.2.000218 [DOI] [PMC free article] [PubMed] [Google Scholar]
- 16.Puschmann S., Rahn C. D., Wenck H., Gallinat S., Fischer F., “Approach to quantify human dermal skin aging using multiphoton laser scanning microscopy,” J. Biomed. Opt. 17(3), 036005 (2012). 10.1117/1.JBO.17.3.036005 [DOI] [PubMed] [Google Scholar]
- 17.Schmidt A. M., Yan S. D., Yan S. F., Stern D. M., “The multiligand receptor RAGE as a progression factor amplifying immune and inflammatory responses,” J. Clin. Invest. 108(7), 949–955 (2001). 10.1172/JCI200114002 [DOI] [PMC free article] [PubMed] [Google Scholar]
- 18.Ntziachristos V., “Going deeper than microscopy: the optical imaging frontier in biology,” Nat. Methods 7(8), 603–614 (2010). 10.1038/nmeth.1483 [DOI] [PubMed] [Google Scholar]
- 19.Razansky D., Distel M., Vinegoni C., Ma R., Perrimon N., Koster R. W., Ntziachristos V., “Multispectral opto-acoustic tomography of deep-seated fluorescent proteins in vivo,” Nat. Photonics 3(7), 412–417 (2009). 10.1038/nphoton.2009.98 [DOI] [Google Scholar]
- 20.S. Tzoumas, A. Nunes, N. C. Deliolanis, and V. Ntziachristos, “Effects of multispectral excitation on the sensitivity of molecular optoacoustic imaging,” J. Biophotonics posted early online (2014). [DOI] [PubMed]
- 21.Mohajerani P., Kellnberger S., Ntziachristos V., “Frequency domain optoacoustic tomography using amplitude and phase,” Photoacoustics 2(3), 111–118 (2014). 10.1016/j.pacs.2014.06.002 [DOI] [PMC free article] [PubMed] [Google Scholar]
- 22.Jacobi U., Kaiser M., Toll R., Mangelsdorf S., Audring H., Otberg N., Sterry W., Lademann J., “Porcine ear skin: an in vitro model for human skin,” Skin Res. Technol. 13(1), 19–24 (2007). 10.1111/j.1600-0846.2006.00179.x [DOI] [PubMed] [Google Scholar]
- 23.Hadley J., Malik N., Meek K., “Collagen as a model system to investigate the use of aspirin as an inhibitor of protein glycation and crosslinking,” Micron 32(3), 307–315 (2001). 10.1016/S0968-4328(00)00032-9 [DOI] [PubMed] [Google Scholar]
- 24.Tseng J. Y., Ghazaryan A. A., Lo W., Chen Y. F., Hovhannisyan V., Chen S. J., Tan H. Y., Dong C. Y., “Multiphoton spectral microscopy for imaging and quantification of tissue glycation,” Biomed. Opt. Express 2(2), 218–230 (2011). 10.1364/BOE.2.000218 [DOI] [PMC free article] [PubMed] [Google Scholar]
- 25.Tserevelakis G. J., Soliman D., Omar M., Ntziachristos V., “Hybrid multiphoton and optoacoustic microscope,” Opt. Lett. 39(7), 1819–1822 (2014). 10.1364/OL.39.001819 [DOI] [PubMed] [Google Scholar]
- 26.Koetsier M., Lutgers H. L., de Jonge C., Links T. P., Smit A. J., Graaff R., “Reference values of skin autofluorescence,” Diabetes Technol. Ther. 12(5), 399–403 (2010). 10.1089/dia.2009.0113 [DOI] [PubMed] [Google Scholar]
- 27.Hull E., Ediger M., Unione A., Deemer E., Stroman M., Baynes J., “Noninvasive, optical detection of diabetes: model studies with porcine skin,” Opt. Express 12(19), 4496–4510 (2004). 10.1364/OPEX.12.004496 [DOI] [PubMed] [Google Scholar]
- 28.Schmook F. P., Meingassner J. G., Billich A., “Comparison of human skin or epidermis models with human and animal skin in in-vitro percutaneous absorption,” Int. J. Pharm. 215(1-2), 51–56 (2001). 10.1016/S0378-5173(00)00665-7 [DOI] [PubMed] [Google Scholar]
- 29.Ara J.-Y. T., Ghazaryan A., Loa W., Chen Y.-F., Hovhanissyan V., Chen H.-Y. T. S.-J., Dong C.-Y., “Multiphoton imaging and quantification of tissue glycation,” Proc. SPIE 7895, 5 (2011). [Google Scholar]
- 30.Vionnet L., Gateau J., Schwarz M., Buehler A., Ermolayev V., Ntziachristos V., “24-MHz Scanner for Optoacoustic Imaging of Skin and Burn,” IEEE Trans. Med. Imaging 33(2), 535–545 (2014). 10.1109/TMI.2013.2289930 [DOI] [PubMed] [Google Scholar]
- 31.Aguirre J., Schwarz M., Soliman D., Buehler A., Omar M., Ntziachristos V., “Broadband mesoscopic optoacoustic tomography reveals skin layers,” Opt. Lett. 39(21), 6297–6300 (2014). 10.1364/OL.39.006297 [DOI] [PubMed] [Google Scholar]


