Abstract
Using acupuncture to treat cerebral hypoperfusion is a hot topic. However, there is a lack of effective tools to clarify the therapeutic effect of acupuncture on cerebral hypoperfusion. Here, we show in a mouse model of cerebral hypoperfusion that photoacoustic tomography (PAT) can noninvasively image cerebral vasculature and track total hemoglobin (HbT) concentration changes in cerebral hypoperfusion with acupuncture stimulation on the YangLingQuan (GB34) point. We measured the changes of HbT concentration and found that the HbT concentration in hypoperfusion regions was clearly lower than that in the control regions when the acupuncture was absent; however, it was significantly increased when the acupuncture was implemented on the GB34 point. We also observed the increase of vessel size and the generation of new vessels in cerebral hypoperfusion during acupuncture. Laser speckle imaging (LSI) was employed to validate some of the PAT findings.
OCIS codes: (170.5120) Photoacoustic imaging, (170.2655) Functional monitoring and imaging
1. Introduction
Cerebral hypoperfusion is one of the leading causes of neurological disorders and contributes to cognitive decline [1]. Acupuncture, as the essence of Chinese traditional medicine, has been used in the treatment of hypoperfusion and ischemia for many years [2–6]. A basic understanding is that when acupuncture is performed, it will modulate the nervous system [7]. Thus far several acupoints related to the blood perfusion have been identified [8,9]. Among these acupoints, Yanglinquan (GB34), combined points of Foot Gallbladder, is an important point in the treatment of cerebral hypoperfusion [10]. Upon acupuncture at GB34, the areas excited include bilateral frontal lobes, parietal lobes, occipital lobes, temporal lobes, hippocampus, parahippocampal gyrus, cingulated brain, cerebellum, basal ganglia, bridge and other brain regions. It has been demonstrated that acupuncture of GB34 point can reduce the degeneration of neurons in brain and improve the content of several kinds of enzyme in brain [11]. However, there is a lack of effective tool for noninvasively in vivo monitoring the brain activity during acupuncture. The traditional imaging techniques, such as positron emission tomography (PET) and functional magnetic resonance imaging (fMRI) have been used to noninvasively evaluate the acupuncture effect on brain [12–17], but both have significant limitations. Although PET records glucose metabolism and blood flow, it has low spatial and temporal resolution and patients need to be injected with tracer isotopes. fMRI can image hemodynamics without the use of contrast agents, but it also has low temporal resolution.
Here we present for the first time photoacoustic tomography (PAT), a label-free high spatial and temporal resolution functional modality, to study the effect of acupuncture at GB34 points on cerebral hypoperfusion. PAT combines high ultrasonic resolution and strong optical contrast in a single modality, capable of providing both structural and functional images [18,19]. PAT has been used to in vivo image cerebral hemodynamics in small animals [20–25]. In this study, PAT is used to in vivo image neurovasculature and hemodynamics of cerebral hypoperfusion during acupuncture. We observed significant increase of hemoglobin and blood vessel size in the hypoperfusion regions upon acupuncture at GB34. We also present statistical analysis of the PAT findings.
2. Methods
All experimental procedures were approved by IACUC committee at the University of Electronic Science and Technology of China. And the experiments were carried out in accordance with the approved guidelines.
2.1 Experimental setup
The experimental setup is schematically presented in Fig. 1. A Q-switched Nd: YAG laser light was used at a wavelength of 532 nm with duration of 6.5 ns, and the time interval of two pulses was set to be 0.7 seconds. A mirror was used to change the light path by 90 degrees. The laser beam was expanded by a concave lens. To obtain a uniform laser beam, ground glass was used. A polytetrafluoroethylene film, transparent to light and ultrasound, was employed as a separation layer between coupling agent and mouse brain tissue. During the experiments, the homogeneous beam illuminated the mouse head. The energy density on the brain surface was below 15mJ/cm2. An ultrasonic transducer with a central frequency of 5MHz and a diameter of 0.8mm was motor driven. During the experiments, the transducer rotated around the mouse brain 360 degrees with a step size of 2 degrees at the scanning position. The detector received the photoacoustic signal generated by the brain tissue at each step. The signal was then sent to an amplifier and digitized by a data acquisition board. A delay and sum algorithm was adopted for reconstructing the distribution of the optical absorption within the tissue. Because the HbT in tissue has a very high light absorption coefficient at 532nm compared with other absorbers, we assumed that the distribution of the RLA represents the distribution of HbT concentration. However, we have demonstrated that this experimental setup can be better applied to acupuncture study in our previous work [26].
Fig. 1.
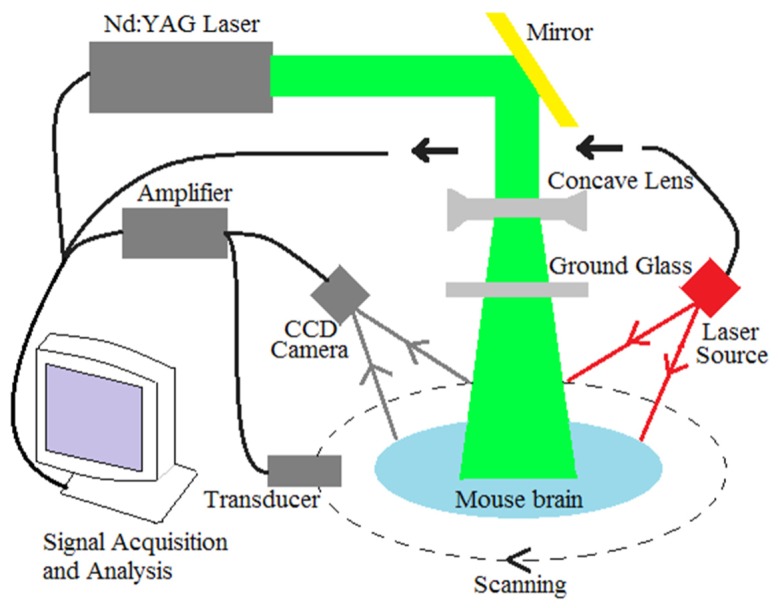
The schematic of imaging system.
A laser speckle imaging system (moorFLPI, Moor Instruments, Inc.) was integrated with the PAT system in the experiments to provide the changes of blood flow, as shown in Fig. 1. This Laser speckle system offers video frame rate blood flow images (25 frames per second) at 785nm with 576 × 768 pixel resolution. In the experiments, the mouse was positioned below the probe of laser speckle and ensured that the head could not move freely. The working distance between scan head and mouse head was about 20-30cm. The image acquisition rate was set to be one image per second. The CBF at each time point was calculated by averaging the 250 data points in the ROIs.
2.2 Animal model of cerebral hypoperfusion
Ten mice were used for the in vivo experiments involving cerebral hypoperfusion. Mice were anesthetized with intraperitoneal injection of solution containing ketamine 7.5mg/ml and diazepam 0.15mg/ml by 0.2ml/10g body weight. After being anesthetized, mice were supinely fixed on the mounting plate and limbs fixed with adhesive tape. Push clipper was used to shave the hair around surgical site, followed with povidone-iodine disinfection for this region. Surgical scissors was used to cut the skin of the neck along with the mid-line position, followed with blunt dissection of the left side of the neck muscles. Upon the identification of the left common carotid artery, the vagus nerve was separated, and surgical threads were then used to ligate the left common carotid artery. Finally, the skin was sutured with povidone-iodine disinfection for surgical site. The animals were placed in an incubator and would wake up naturally.
Before imaging, the hair on the mouse head was removed using depilatory paste. And the scalp was cut off along the edge of image area to avoid the disturbance to the LSI imaging. After that, the mouse head was coated with a layer of ultrasound coupling agent and fixed on a homemade mounting holder.
2.3 Acupuncture at GB34 points
The diameter of acupuncture stainless steel needle was 0.2mm. The GB34 point is located outside of each leg, in the depression before the fibular head [27]. Meridian theory is that the GB34 points, one of the eight acupoints, are the combined points of foot gallbladder. When the acupuncture is implemented at GB34 points, it can cause activation of CBF and HbT in different brain regions. In our experiments, the needle was disinfected by alcohol, and then was pierced into the GB34 point horizontally for about 5mm deep and rotated back and forth for 4 times per second. Two and half minutes after the acupuncture, the needle was retained in the point for more than 25 minutes. The LSI was used to measure the CBF of ROIs over the entire acupuncture operation. Several hours later, the same acupuncture procedure was implemented and PAT was used to image the HbT concentration in the same ROIs.
3. Results and discussion
3.1 Acupuncture experiments on normal mice
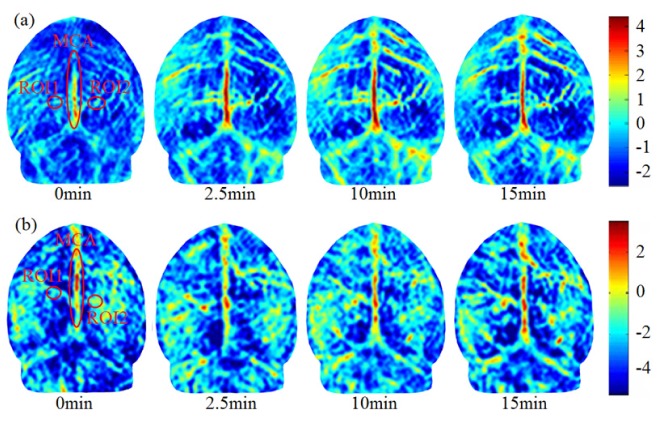
Experimental results show that there is no significant difference in HbT in the two hemispheres of brain when the GB34 is stimulated with acupuncture. Six normal mice, weighted 25 ± 5g, were used in these experiments. Acupuncture stimulation was performed on the left point for three of the mice and on the right point for the other three. HbT in the whole brain was mapped by PAT at different time points. HbT in the region of interest (ROI) was measured, and we found that the acupuncture, either on the right or left points, would approximately enhance the HbT in the two hemispheres. Figure 2(a) shows the images of HbT over time during acupuncture stimulation on left GB34. Before acupuncture, we can see the vascular structure in the two brain hemispheres, and tiny blood vessels are blurry indicating lower HbT. After 2.5 minutes of acupuncture, an obvious increase in HbT in the middle cerebral artery (MCA) can be seen in Fig. 2(a). After 10 min and 15 min, the HbT in the MCA and branch vessels is further increased, and the brain and cerebellum can be distinguished from each other. The same experiments were performed with acupuncture on right GB34, and similar variation in HbT can be seen in Fig. 2(b).
Fig. 2.
PAT images of brain under acupuncture on the left (a) or right (b) GB34 point for a representative normal mouse. The images are given at different time points (0min-right before the start of acupuncture, and 2.5-15min after the start of acupuncture). The color scale indicates the relative strength of photoacoustic signal.
To better understand the results, the quantitative relative light absorption (RLA) variation was computed in an ROI in right or left hemisphere. As seen in Fig. 2(a), ROI1 and ROI2 are indicated symmetrically by 6 × 6 pixel in the center of ovals. The average of the two ROIs was used to quantitatively assess the increase of HbT. Before acupuncture, the RLAs of two ROIs were measured to be 0.17 and 0.23, respectively. After acupuncture was implemented on left GB34 point, the HbT concentration increased gradually, and the RLA reached 1.06 and 1.63 after 15 minutes in the respective ROI. The computed increase of RLA (i.e., 0.89 and1.40) indicates that acupuncture on left GB34 point produced a similar effect on HbT in both hemispheres. The same method was used in the analysis of acupuncture effect on the right GB34 point. As seen in Fig. 2(b), one of the increases of RLA at ROI1 and ROI2 were measured to be (1.23, 1.25). Table 1 gives the values of RLA before and after acupuncture for all the six mice as measured by PAT. The percentages of relative difference between left and right ROIs were calculated. The six sets of data demonstrated again that the acupuncture of GB34, either left or right, generally have the approximate contribution roles in increasing the HbT concentration at symmetrical positions in two hemispheres.
Table 1. Calculations of relative light absorption(RLA) in ROI1 and ROI2, and percentage and absolute differences in RLA between ROI1 and ROI2 upon acupuncture at left or right GB34.
| Case # | Before acupuncture | After acupuncture | Percentage(%) | Increase | |||||
|---|---|---|---|---|---|---|---|---|---|
| ROI1 | ROI2 | ROI1’ | ROI2’ | |ROI2-ROI1| /ROI2 |
|ROI2’-ROI1’| /ROI2’ |
ROI1’ -ROI1 |
ROI2’ -ROI2 |
||
| I | Left point | 0.17 | 0.23 | 1.06 | 1.63 | 26.09 | 34.97 | 0.89 | 1.40 |
| II | 0.22 | 0.19 | 1.93 | 1.77 | 15.79 | 9.04 | 1.71 | 1.58 | |
| III | 0.16 | 0.21 | 1.42 | 1.72 | 23.81 | 17.44 | 1.26 | 1.51 | |
| IV | Right point | 0.33 | 0.42 | 1.56 | 1.67 | 21.43 | 6.59 | 1.23 | 1.25 |
| V | 0.28 | 0.24 | 1.72 | 1.14 | 16.67 | 50.88 | 1.44 | 0.90 | |
| VI | 0.12 | 0.11 | 1.10 | 1.44 | 9.09 | 23.61 | 0.98 | 1.33 | |
The six control experiments were carried out and statistically compared with the GB34 point experimental data. The sham points were chosen and stimulated with the same acupuncture procedure to GB34 in the experiments [28]. From Fig. 3(a), we can see that the relative increase of HbT during acupuncture stimulation on left GB34 point is significantly higher than that with stimulation on sham points. Figure 3(b) shows a similar difference for the right GB34 and sham points. These statistical results suggest that although the stimulation on sham points can also increase the HbT concentration in brain, such increase is significantly smaller than that on GB34 points via the meridian system.
Fig. 3.
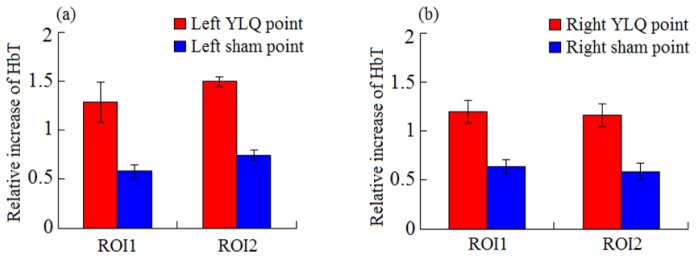
Comparison in relative increase of HbT for acupuncture on left GB34 and sham points (a) and on right GB34 and sham points (b). Two pairs of boxes in (a) and (b) represent the statistical average with standard deviation in ROI1 or ROI2.
3.2 Acupuncture experiments on cerebral hypoperfusion mice
Generally, acupuncture stimulation is used in cases of cerebral hypoperfusion for the recovery of blood flow. Since HbT is an important brain function parameter, the effect of acupuncture on HbT in the region of cerebral hypoperfusion should be studied. Ten mice, weighted 47 ± 5g, were made to be left cerebral hypoperfusion by carotid artery ligation and then stimulated with acupuncture on the GB34 points. In experiments, the mice were first imaged by PAT to image HbT changes, and then LSI was used to measure the CBF for validation.
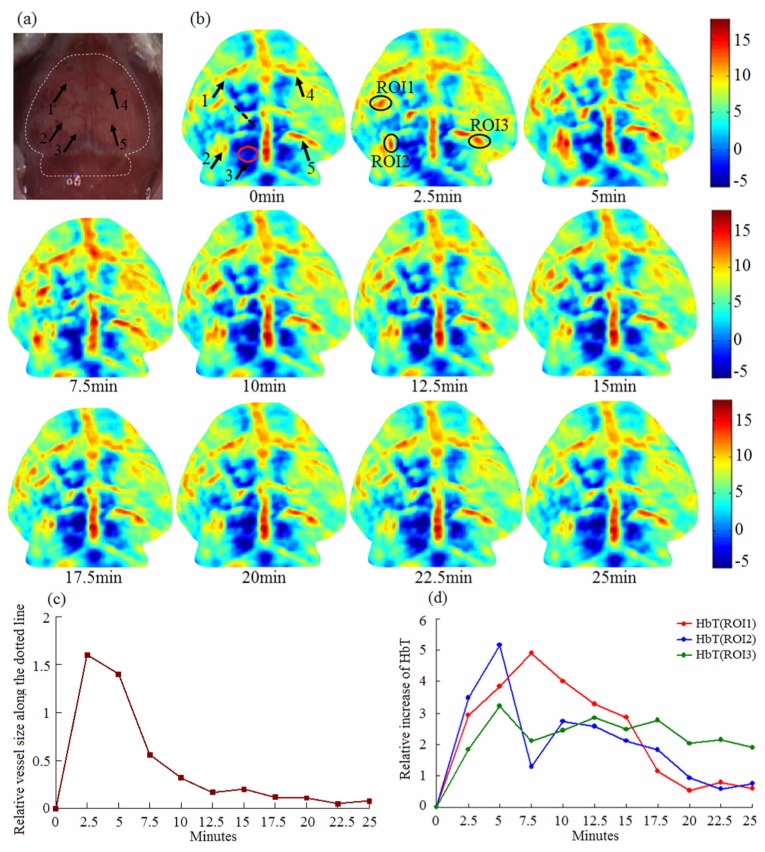
Figure 4 demonstrates experimental results for one mouse under acupuncture on the GB34 point by PAT. Figure 4(a) shows the photograph of the mouse head with scalp stripped, and the imaging border is indicated with a white dotted line. The five arrows indicate vessels at different positions. All the vessels were imaged by PAT, as shown in the first image in Fig. 4(b). This demonstrates that vascular structure can be reconstructed using PAT. From the image at 0 min in Fig. 4(b), we can see that the HbT in the left hemisphere is lower than in the opposite. This phenomenon indicates how hypoperfusion can induce the decrease of HbT concentration. However, it was increased and maintained for more than 25min when acupuncture on the GB34 point was used. In the experiments, we observed new vessels in this ischemic zone the acupuncture stimulation. As seen in the position of arrow 3 in Fig. 4(b), there is no observable vessel in the red oval area at 0 min, but the vessel can be seen after 2.5min and the absorption reached a maximum at 5min. This shows how acupuncture can activate the HbT instillation in the deep vein and microvasculature. In addition, the vessel sizes at the positions of five arrows were also increased especially in the ischemic zone during acupuncture. Figure 4(c) shows the variation of vessel size along the black dotted line which represents the position and direction of the vessel size. The fluctuations in the process of variation indicate that the blood flow changes in response to acupuncture are dynamic. Ten minutes after acupuncture, the vessel size, however, was restored to its state before acupuncture.
Fig. 4.
PAT imaging of cerebral hypoperfusion during acupuncture.; (a) Photograph of mouse brain with scalp stripped; five blood vessels are indicated by arrows . (b) PAT images at different time points (0-25 min after acupuncture). Five arrows in the first image are corresponding to that in the photograph. Three ROIs are marked in the second PAT image for the calculation of HbT concentration; (c) The relative variation of vessel size along the black dotted line in the first image in (b) ;(d) Quantitative plots of HbT concentration over time in three ROIs.
Figure 4(d) gives the quantitative increase of HbT in the three ROIs during acupuncture. The HbT value given here is a relative one, i.e., the HbT at 0 min was set to zero and subtracted from HbT at other time points to facilitate observation of the dynamics. The data shows the same trend and approximate average values of all time points for the three ROIs.
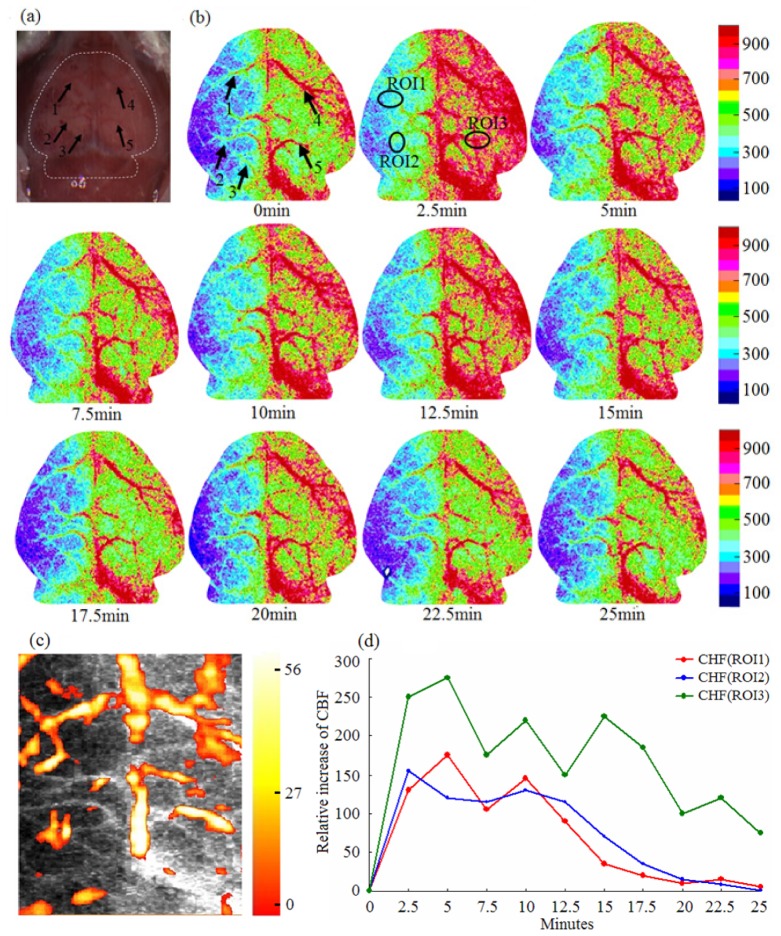
To compare and validate the experimental results from PAT, LSI was employed to image CBF in the mice during the same procedure. Figure 5(a) is the photograph of the mouse head with scalp stripped. Figure 5(b) gives the LSI imaging results at the same time points and shows obvious hypoperfusion at the left hemisphere. For comparison, the arrows and ROIs at the same positions were marked in the CBF images. From Fig. 5(b), an obvious improvement of CBF is seen in the ischemic and control zones during acupuncture, and the vascular sizes at arrows also increased. These results are consistent with the above observations from PAT. We can also see that HbT and CBF are both increased firstly and then declined with time (see Fig. 4(d) and Fig. 5(d)). However, they have different fluctuations and declined amplitudes.
Fig. 5.
LSI of cerebral hypoperfusion during acupuncture. (a) Photograph of mouse brain with scalp stripped; (b) LSI images at different time points (0-25 min after acupuncture). Five arrows in the first image indicate the same blood vessels as that in Fig. 4, and the same three ROIs were assigned for the calculation of CBF; (c) Fused image of PAT and LSI; (d) CBF over time in the three ROIs.
Figure 5(c) gives the fused image of LSI and PAT where the gray background is the LSI image and the overlaid color is the PAT image. Here we see clear similarity in vascular distribution from the HbT and the CBF images. Figure 5(d) gives the measured change in CBF in the three ROIs over time, and the CBF value at the 0 min was also set to zero and subtracted from CBF at other time points. From Fig. 5(d), we observed a similar trend in CBF over the three ROIs, but ROI1 and ROI2 showed clearly smaller average CBF value than ROI3, suggesting that the CBF in ischemic area has a smaller response to acupuncture than in non-ischemic area.
Statistical analysis of the ischemic mouse experiments is presented in Fig. 6. The statistical results in Fig. 6(a) show that the average relative increases of HbT in the three ROIs change slowly with time. Figure 6(b) gives us a statistical conclusion that the CBF in ischemic zone has a smaller response to acupuncture compared to non-ischemic zone, and its duration is no more than 15 minutes. At the time 15 minutes after acupuncture, we can see the standard deviation becomes smaller which means that the CBF in hypoperfusion zone was restored to a stable state. However, the transient blood flow enhancement in ischemic zone lends to the increase of HbT which induced the generation of new vessels and increase of vascular sizes in images. This experiment demonstrates the mitigation effect and treatment of the acupuncture on ischemic injury.
Fig. 6.
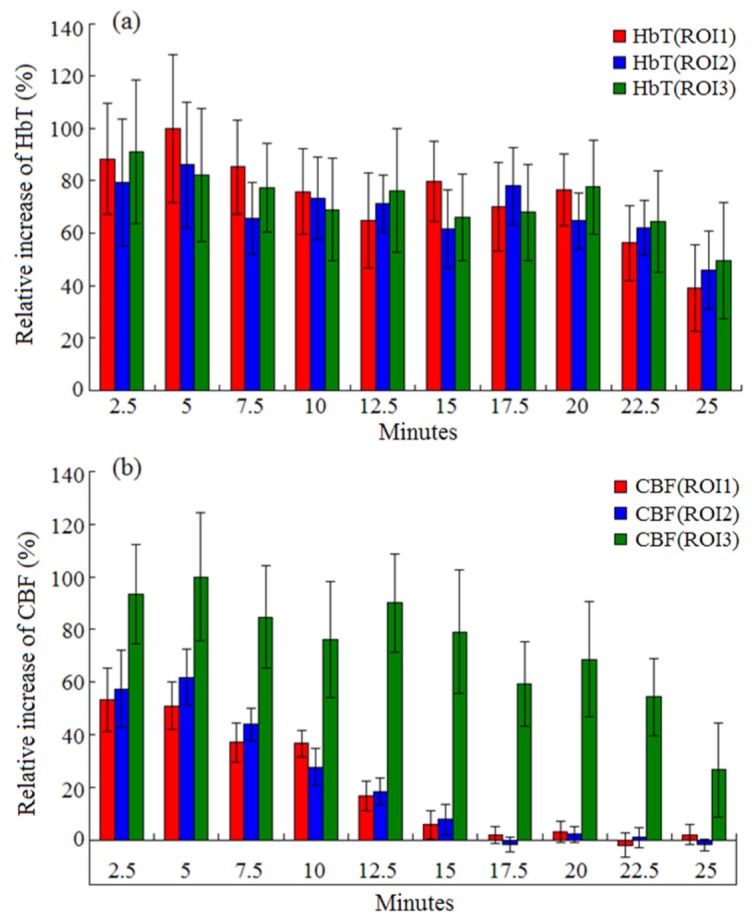
Averaged HbT (a) and CBF (b) with standard deviations over time during acupuncture for the three ROIs.
4. Conclusions
We can conclude from the experiments that acupuncture on GB34 points increases HbT in the two hemispheres. The acupuncture regulates the percent of relative difference between two ROIs in brain, and it appears that the different regions in brain have a different response to the stimulation. The acupuncture, either implemented on left or right point, can simultaneously increase the HbT concentration in two hemispheres.
To study the acupuncture effect on cerebral hypoperfusion, ten mice were made to be left cerebral hypoperfusion by carotid artery ligation as the experimental subjects. We demonstrated that PAT is capable of in vivo imaging HbT distribution and distinguishing the ischemic region from non-ischemic region. When the acupuncture was used on GB34 points, the HbT concentration in ischemic zones would increase significantly. This provides for us a new perspective to study the cerebral hypoperfusion disease. The PAT imaging results were validated and compared with an LSI technique. The comparison showed that the HbT concentration and CBF in hypoperfusion zone are both smaller than in the non- hypoperfusion zone. With the acupuncture stimulation, the increase in HbT showed a longer response than the increase in CBF, which was maintained for about 15min. These phenomena may be a result of the vascular occlusion and microcirculation disturbance in the ischemic region. However, the acupuncture could cause the generation of new blood vessels and increase the vascular sizes. This could contribute to the relief of vascular occlusion and improve the blood supply to cerebral hypoperfusion.
In this study, 2.5 minutes were needed to complete data acquisition for one set of image due to the use of single transducer-scanning PAT system. We plan to develop a real-time PAT system by using a large array of ultrasound sensors and associated multi-channel data acquisition system. In addition, multi-wavelength of laser light will be used to realize truly functional PAT imaging. While the GB34 were the only stimulated points in this study, other acupoints, such as BaiHui, RenZhong, and QuChi are also associated with the brain according to the theory of traditional Chinese medicine. We will conduct a comparative PAT/LSI study where all these brain-associated acupoints will be stimulated.
Author contributions
B.C. developed the imaging system, designed and performed experiments, analyzed data and wrote the paper; J.Y. analyzed data; D.W. performed experiments; D.Z. guided the data analysis; Y.Y. prepared the hypoperfusion model and wrote the paper; N.Y. helped experimental operation; H.J. directed the study and wrote the paper.
Competing financial interests: The authors declare no competing financial interests.
Acknowledgments
This research was supported in part by the “One Hundred Talented People” program of Sichuan Province and by the “Experimental animal organ transplant operation platform construction” program of Science and Technology Department of Sichuan Province.
References and links
- 1.He X. L., Wang Y. H., Bi M. G., Du G. H., “Chrysin improves cognitive deficits and brain damage induced by chronic cerebral hypoperfusion in rats,” Eur. J. Pharmacol. 680(1-3), 41–48 (2012). 10.1016/j.ejphar.2012.01.025 [DOI] [PubMed] [Google Scholar]
- 2.Liu B., Meng Q. F., Yie Y. S., Zhou D. J., Dong S. G., Liu X., Sang C. X., “CT perfusion imaging and pathology in experimental cerebral hypoperfusion model treated by electroacupuncture,” J. Practical Radiol. 23, 963–965 (2007). [Google Scholar]
- 3.Chuang C. M., Hsieh C. L., Li T. C., Lin J. G., “Acupuncture stimulation at Baihui acupoint reduced cerebral infarct and increased dopamine levels in chronic cerebral hypoperfusion and ischemia-reperfusion injured Sprague-Dawley rats,” Am. J. Chin. Med. 35(5), 779–791 (2007). 10.1142/S0192415X07005260 [DOI] [PubMed] [Google Scholar]
- 4.Qian Y. F., Fan X. N., Li Y. J., Zhang Y. N., Wei Y. Y., Zhang X., Wu H. Q., Wang S., Shi X. M., “Effects of acupuncture at different acupoints on cerebral blood flow in cerebral ischemia model rats,” Zhongguo Zhenjiu 29(3), 213–216 (2009). [PubMed] [Google Scholar]
- 5.Xu H., Sun H., Chen S. H., Zhang Y. M., Piao Y. L., Gao Y., “Effects of acupuncture at Baihui (DU20) and Zusanli (ST36) on the expression of heat shock protein 70 and tumor necrosis factor α in the peripheral serum of cerebral ischemia-reperfusion-injured rats,” Chin. J. Integr. Med. 20(5), 369–374 (2014). 10.1007/s11655-014-1800-z [DOI] [PubMed] [Google Scholar]
- 6.Liu C. Z., Li Z. G., Wang D. J., Shi G. X., Liu L. Y., Li Q. Q., Li C., “Effect of acupuncture on hippocampal Ref-1 expression in cerebral multi-infarction rats,” Neurol. Sci. 34(3), 305–312 (2013). 10.1007/s10072-012-0994-0 [DOI] [PubMed] [Google Scholar]
- 7.Han J. S., Terenius L., “Neurochemical basis of acupuncture analgesia,” Annu. Rev. Pharmacol. Toxicol. 22(1), 193–220 (1982). 10.1146/annurev.pa.22.040182.001205 [DOI] [PubMed] [Google Scholar]
- 8.Zhang X., Wu B., Nie K., Jia Y., Yu J., “Effects of acupuncture on declined cerebral blood flow, impaired mitochondrial respiratory function and oxidative stress in multi-infarct dementia rats,” Neurochem. Int. 65, 23–29 (2014). 10.1016/j.neuint.2013.12.004 [DOI] [PubMed] [Google Scholar]
- 9.Jang M. H., Shin M. C., Lee T. H., Lim B. V., Shin M. S., Min B. I., Kim H., Cho S., Kim E. H., Kim C. J., “Acupuncture suppresses ischemia-induced increase in c-Fos expression and apoptosis in the hippocampal CA1 region in gerbils,” Neurosci. Lett. 347(1), 5–8 (2003). 10.1016/S0304-3940(03)00512-3 [DOI] [PubMed] [Google Scholar]
- 10.Lü J., “The clinical application of yanglingquan (GB 34) point,” J. Tradit. Chin. Med. 13(3), 179–181 (1993). [PubMed] [Google Scholar]
- 11.Park H. J., Lim S., Joo W. S., Yin C. S., Lee H. S., Lee H. J., Seo J. C., Leem K., Son Y. S., Kim Y. J., Kim C. J., Kim Y. S., Chung J. H., “Acupuncture prevents 6-hydroxydopamine-induced neuronal death in the nigrostriatal dopaminergic system in the rat Parkinson’s disease model,” Exp. Neurol. 180(1), 93–98 (2003). 10.1016/S0014-4886(02)00031-6 [DOI] [PubMed] [Google Scholar]
- 12.Hsieh J. C., Tu C. H., Chen F. P., Chen M. C., Yeh T. C., Cheng H. C., Wu Y. T., Liu R. S., Ho L. T., “Activation of the hypothalamus characterises the acupuncture stimulation at the analgesic point in the human: a PET Study,” Neurosci. Lett. 307(2), 105–108 (2001). 10.1016/S0304-3940(01)01952-8 [DOI] [PubMed] [Google Scholar]
- 13.Lai X., Zhang G., Huang Y., Tang C., Yang J., Wang S., Zhou S. F., “A cerebral functional imaging study by positron emission tomography in healthy volunteers receiving true or sham acupuncture needling,” Neurosci. Lett. 452(2), 194–199 (2009). 10.1016/j.neulet.2009.01.052 [DOI] [PubMed] [Google Scholar]
- 14.Liu M. L., Lan L., Zeng F., Li X. Z., Liu X. G., Liang F. R., “Quality control of the research on mechanisms of acupuncture therapy by using PET-CT imaging techniques,” Zhen Ci Yan Jiu 35(1), 67–70 (2010). [PubMed] [Google Scholar]
- 15.Zhang W. T., Jin Z., Cui G. H., Zhang K. L., Zhang L., Zeng Y. W., Luo F., Chen A. C. N., Han J. S., “Relations between brain network activation and analgesic effect induced by low vs. high frequency electrical acupoint stimulation in different subjects: a functional magnetic resonance imaging study,” Brain Res. 982(2), 168–178 (2003). 10.1016/S0006-8993(03)02983-4 [DOI] [PubMed] [Google Scholar]
- 16.Qin W., Tian J., Bai L., Pan X., Yang L., Chen P., Dai J., Ai L., Zhao B., Gong Q., Wang W., von Deneen K. M., Liu Y., “FMRI connectivity analysis of acupuncture effects on an amygdala-associated brain network,” Mol. Pain 4(1), 55 (2008). 10.1186/1744-8069-4-55 [DOI] [PMC free article] [PubMed] [Google Scholar]
- 17.Quah-Smith I., Sachdev P. S., Wen W., Chen X., Williams M. A., “The brain effects of laser acupuncture in healthy individuals: An FMRI investigation,” PLoS One 5(9), e12619 (2010). 10.1371/journal.pone.0012619 [DOI] [PMC free article] [PubMed] [Google Scholar]
- 18.Jiang H. B., Photoacoustic Tomography, (CRC Press, 2014). [Google Scholar]
- 19.Yao J., Xia J., Maslov K. I., Nasiriavanaki M., Tsytsarev V., Demchenko A. V., Wang L. V., “Noninvasive photoacoustic computed tomography of mouse brain metabolism in vivo,” Neuroimage 64, 257–266 (2013). 10.1016/j.neuroimage.2012.08.054 [DOI] [PMC free article] [PubMed] [Google Scholar]
- 20.Yao L., Xi L., Jiang H., “Photoacoustic computed microscopy,” Sci. Rep. 4, 4960 (2014). 10.1038/srep04960 [DOI] [PMC free article] [PubMed] [Google Scholar]
- 21.Xiang L., Ji L., Zhang T., Wang B., Yang J., Zhang Q., Jiang M. S., Zhou J., Carney P. R., Jiang H., “Noninvasive real time tomographic imaging of epileptic foci and networks,” Neuroimage 66, 240–248 (2013). 10.1016/j.neuroimage.2012.10.077 [DOI] [PubMed] [Google Scholar]
- 22.Zhang Q., Liu Z., Carney P. R., Yuan Z., Chen H., Roper S. N., Jiang H., “Non-invasive imaging of epileptic seizures in vivo using photoacoustic tomography,” Phys. Med. Biol. 53(7), 1921–1931 (2008). 10.1088/0031-9155/53/7/008 [DOI] [PubMed] [Google Scholar]
- 23.Yao J., Wang L., Yang J. M., Maslov K. I., Wong T. T. W., Li L., Huang C. H., Zou J., Wang L. V., “High-speed label-free functional photoacoustic microscopy of mouse brain in action,” Nat. Methods 12(5), 407–410 (2015). 10.1038/nmeth.3336 [DOI] [PMC free article] [PubMed] [Google Scholar]
- 24.Guevara E., Berti R., Londono I., Xie N., Bellec P., Lesage F., Lodygensky G. A., “Imaging of an inflammatory injury in the newborn rat brain with photoacoustic tomography,” PLoS One 8(12), e83045 (2013). 10.1371/journal.pone.0083045 [DOI] [PMC free article] [PubMed] [Google Scholar]
- 25.Wang B., Xiang L., Jiang M. S., Yang J., Zhang Q., Carney P. R., Jiang H., “Photoacoustic tomography system for noninvasive real-time three-dimensional imaging of epilepsy,” Biomed. Opt. Express 3(6), 1427–1432 (2012). 10.1364/BOE.3.001427 [DOI] [PMC free article] [PubMed] [Google Scholar]
- 26.Li T., Xu X., Chen B., Rong J., Jiang H., “Photoacoustic imaging of acupuncture effect in small animals,” Biomed. Opt. Express 6(2), 433–442 (2015). 10.1364/BOE.6.000433 [DOI] [PMC free article] [PubMed] [Google Scholar]
- 27.Fujii Y., “Clinical Management of Postoperative Vomiting After Strabismus Surgery in Children,” Curr. Drug Saf. 5(2), 132–148 (2010). 10.2174/157488610790936204 [DOI] [PubMed] [Google Scholar]
- 28.Tanahashi N., Shikami J., Yoneda M., Ishida T., “Effects of Manual Acupuncture at GB34 on Carbon tetrachloride-induced Acute Liver Injury in Rats,” J. Acupunct. Meridian Stud. 4(4), 214–219 (2011). 10.1016/j.jams.2011.09.012 [DOI] [PubMed] [Google Scholar]


