Abstract
The lipid content in plaques is an important marker for identifying atherosclerotic lesions and disease states. Intravascular photoacoustic (IVPA) imaging can be used to visualize lipids in the artery. In this study, we further investigated lipid detection in the 1.7-µm spectral range. By exploiting the relative difference between the IVPA signal strengths at 1718 and 1734 nm, we could successfully detect and differentiate between the plaque lipids and peri-adventitial fat in human coronary arteries ex vivo. Our study demonstrates that IVPA imaging can positively identify atherosclerotic plaques using only two wavelengths, which could enable rapid data acquisition in vivo.
OCIS codes: (110.0110) Imaging systems, (110.5120) Photoacoustic imaging, (110.5125) Photoacoustics
1. Introduction
The rupture of vulnerable atherosclerotic plaques is a major cause of acute cardiovascular events and sudden cardiac death [1]. One of the most common types of vulnerable atherosclerotic plaques is the thin-cap fibroatheroma (TCFA). It is characterized by the thin fibrous cap with macrophage infiltration, covering a lipid rich necrotic core [2, 3]. Lipid in particular is a crucial component and is used as a biomarker for detecting atherosclerotic plaques [4–7]. A technology that directly, specifically and reliably images plaque lipid content can be used for guiding diagnosis and interventions without observer-dependent and time-consuming interpretation. Such a technology is presently not available for use in patients.
Intravascular photoacoustic (IVPA) imaging is a new catheter-based hybrid optical-acoustic modality for imaging atherosclerotic plaques which could meet that clinical need [8–10]. It can detect lipids on the basis of optical absorption contrast. However, choosing the wavelengths most suitable for lipid detection by IVPA imaging is critical. We know that lipids are highly effective absorbers at wavelengths near 1.7 µm and 1.2 µm due to the first and second overtone of the vibration of C-H bonds within lipid molecules [4, 11, 12]. The capability of IVPA imaging to detect lipids at both spectral ranges in the coronary arteries has been demonstrated ex vivo [13, 14] and in vivo [15]. In a typical atherosclerotic artery, lipids can be found in the plaque inside the artery wall, while peri-adventitial fat is present around the artery wall also in normal coronary arteries in the aging heart. While lipids in the plaque mainly consist of cholesterol and certain cholesteryl esters [16, 17], the lipids in the peri-adventitial fat are stored as a mixture of fatty acids [18, 19]. This difference makes it possible to differentiate between these two lipids. Peri-adventitial fat is distributed around arteries throughout the body [20]. A modality that visualizes only lipids in plaques, excluding peri-adventitial fat, can highlight the presence and location of lipid-rich plaques (LRP) in vessel cross-sections and longitudinal sections through a pullback data set, without having to rely on IVUS image analysis. Unique LRP detection can be a valuable tool for guidance of percutaneous coronary interventions (PCI).
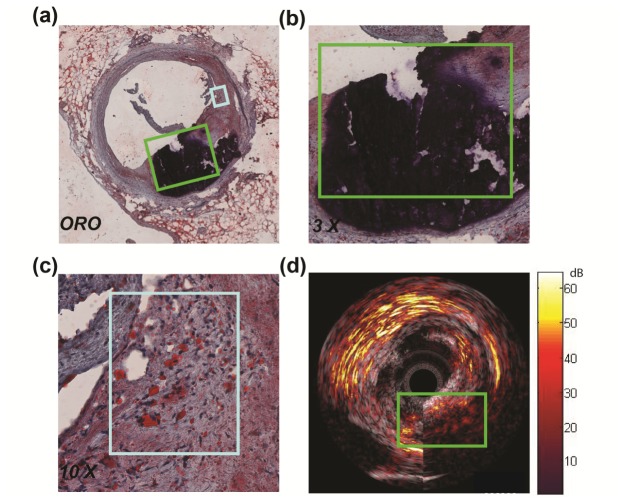
A number of recent studies advocated the use of a single wavelength for lipid imaging [11, 15].We observed that other plaque components may also generate a signal at that chosen wavelength, as is illustrated in Fig. 1. In the figure, only the PA signal from 1 o’clock to 3 o’clock (in the light blue box) was generated from plaque lipids. The signals from 3 o’clock to 7 o’clock inside the vessel (in the green box) were generated from calcium (black in the ORO stained section), while the strong signal surrounding the vessel from 9 o’clock to 3 o’clock was generated from the peri-adventitial adipose tissue. The observation shows that reliable lipid detection requires multiple wavelengths. We have previously investigated the possibility of specific plaque lipid imaging using IVPA [13, 21], and demonstrated that lipids in plaques can be differentiated from those in peri-adventitial fat using the correlation between the observed PA spectra data and the reference PA spectra data. This analysis requires at least 3 wavelengths in the 1.2 µm range. However, using multiple wavelengths impacts the complexity, cost, and speed of the imaging system, and hence the viability of IVPA as a clinical imaging technique.
Fig. 1.
Ex vivo IVPA/IVUS image of a human coronary artery. (a) Histology: Oil Red O staining of the imaging cross session.(b) 3 x magnification of a part of vessel wall (area outlined in green in (a)). (c) 10 x magnification of a part of vessel wall (area outlined in light blue in (a)). (d) 1710 nm combined IVPA/IVUS images of the same cross session shown in (a). The image also shows a strong signal from the adipose tissue surrounding the vessel from 9 o’clock to 3 o’clock. The dynamic range is 55 dB in the US image and 22 dB in the PA image.
The larger absorption coefficient of lipids in the 1.7 µm wavelength band allows us to work at lower laser pulse energies (compared to 1.2 µm) to achieve a reliable PA signal, which is attractive for safety, cost and usability of the technology in a real-world clinical setting.
In this work, based on the statistical analysis of the spectra of different lipid samples, we present a method to automatically detect and differentiate plaque lipids using only two wavelengths in the 1.7 µm range, enabling a fast image acquisition for in vivo application. The performance of this presented method was tested on a vessel phantom and on ex vivo human coronary arteries.
2. Method and material
2.1 Imaging system
We used a combined IVPA/IVUS imaging system to obtain co-registered IVPA/IVUS images as described before [13, 22]. Briefly, the laser pulses for IVPA imaging were provided by a tuneable laser (Vibrant B/355-II, OPOTEK, Santa Clara, CA, USA; Pulse energy 650 µJ/pulse at 1700 nm, pulse duration 5 ns, repetition rate 10 Hz). The laser light was coupled into the custom built catheter by a tapered multimode optical fiber (Oxford Electronics, Four Marks, UK; input diameter 1 mm; output diameter 360 µm). Our catheter mainly comprised a 400 µm diameter core optical fiber with an angle-polished tip (Pioneer Optics, Hartford, Connecticut; tip angle = 34°, NA = 0.22) and a 0.4 x 0.4 mm lead magnesium niobate-lead titanate (PMN-PT) ultrasound transducer (Dept. of Biomedical Engineering, University of Southern California; 45 MHz central frequency, 45% relative bandwidth) [22, 23]. The catheter was positioned by a motorized stage (MP 63-25-DC and DT 105, Steinmeyer GmbH & Co. KG, Albstadt, Germany). A pulse/delay generator (BNC model 575, Berkeley
Nucleonics Corporation, San Rafael, CA, USA), triggered by the Q-switch of the laser, provided synchronisation signals to the data acquisition card and arbitrary waveform generator (WW2571A, Tabor Electronics, Tel Hanan, Israel) for pulse echo imaging.
2.2 Lipid spectroscopy
To investigate the possibility of lipid detection and differentiation in the 1.7 µm range, the spectra of the lipids in plaque and peri-adventitial fat were measured. The spectra of lipids in plaques were measured with pure cholesterol, cholesterol oleate and cholesterol linoleate samples (Sigma Aldrich Co., C8667, C9253 and C0289, respectively), which are dominant lipids in human atherosclerotic plaques [16, 24]. The spectra of the lipids in peri-adventitial fat were measured directly using the human peri-vascular adipose tissue. We filled one lipid sample at a time in a custom-built TPX holder (TPX® Polymethylpentene) and positioned the holder in front of the ultrasound transducer to optimize the signal-to-noise ratio (SNR) of the PA signal.
Spectroscopic photoacoustic imaging (sPA) was performed in the spectral range from 1620 to 1780 nm with a step of 2 nm in clear water at room temperature. The laser energy for sPA imaging was about 0.35 mJ/pulse at the catheter tip. To improve the PA SNR, 32 A-lines were averaged at every wavelength. We acquired at least 500 PA spectral data sets per lipid sample. These spectra were used as a reference. We performed statistical analysis to investigate the spectral contrast between different lipid samples. Since the sPA data were acquired within a narrow spectral range (1620 to 1780 nm), the variations of the average laser pulse energy and the tissue scattering properties were negligible. Any differences in the PA signal were assumed to only arise due to the optical absorption contrast in this spectral range. All the lipid spectra were filtered using a Savitzky-Golay FIR smoothing filter and normalized to their respective maxima for display.
Typical spectra of the different lipid samples are shown in Fig. 2(a). In the figure, the spectra of different lipid samples are relatively similar. The dominant differences of the spectra between lipids in plaque and in peri-adventitial tissue are shifts in the locations of the peaks, and these differences make it possible to differentiate between the lipids in plaques and in peri-adventitial tissue.
Fig. 2.
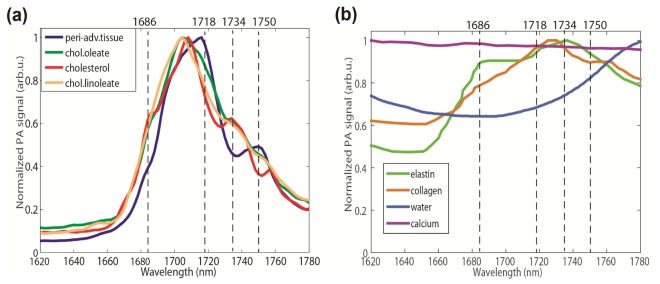
The spectra of different tissue types in 1.7µm spectral range. (a) The normalized PA spectra of different lipid samples. (b) The spectra of elastin, collagen water, and calcium obtained from refs [25–27, 29]. All spectra are normalized to their respective maxima.
2.3 Criteria for lipid detection and differentiation
Choosing optimal PA excitation wavelengths for specific plaque lipid detection is critical. In order to minimize time and power overhead, we aim to select two wavelengths only. The ideal pair of wavelengths is closely spaced (to avoid any fluence changes due to water absorption or tissue optics) and provides sufficient PA contrast for lipid detection and differentiation. In the 1.7 µm spectral range, lipids produce a usable PA signal between 1680 and 1750 nm, where lipid absorption exceeds that of water [25, 26].
To differentiate the plaque lipids and peri-adventitial fat, we plotted the difference between the cholesterol (representative of plaque lipid) and peri-adventitial fat normalized spectra in Fig. 3. The figure shows that there are four wavelengths exhibiting a large contrast, which are marked with red dots. Plaque lipid has a larger PA signal at 1686 nm and 1734 nm, while the peri-adventitial fat response dominates at 1718 nm and 1750 nm. A pair of wavelengths is selected based on the contrast of the two-wavelength relative difference in PA signal of the tissue types that may be expected to occur in the coronary artery wall: lipids, water, calcium and the connective tissues (elastin and collagen). Normalized PA spectra for these non-lipid tissues are shown in Fig. 2(b) [26–29]. The relative PA difference is defined as follows:
where and are the PA amplitudes at the two wavelengths. Note that for noise immunity, lipids should generate PA signals with good SNR at the selected wavelengths. Of these four wavelengths, 1718 nm is close to the peak response of all lipids, and hence always generates a strong signal. We choose this wavelength as λ1 to avoid the denominator in becoming small and to decrease the sensitivity to noise. Adequate contrast and acceptable noise sensitivity can be achieved with λ1 = 1718 nm and λ2 = 1734 nm, which is the nearest usable wavelength.
Fig. 3.
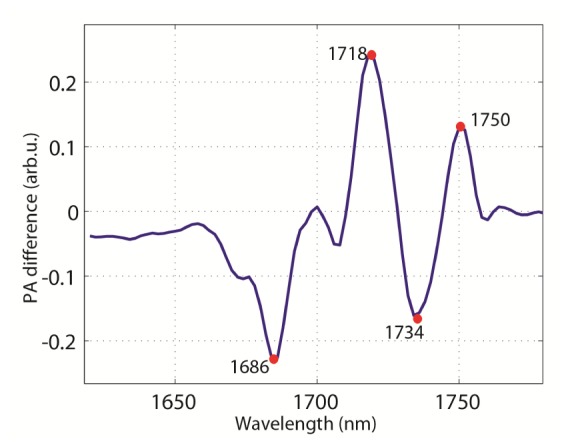
Difference in PA normalized spectra between cholesterol and peri-adventitial fat. Four wavelengths produce a large enough difference to be useful for distinguishing the two.
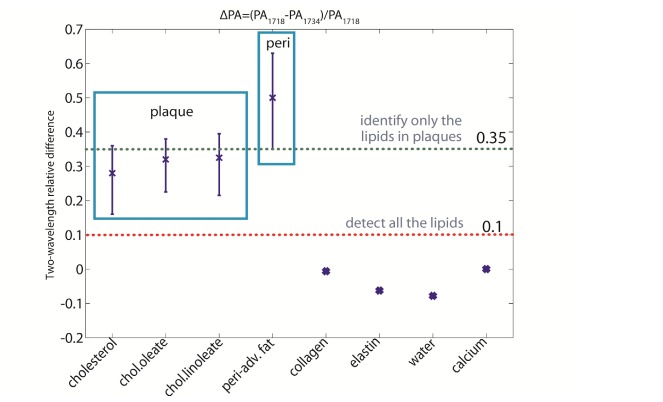
We computed at 1718 and 1734 nm, for all spectra acquired on the different lipid samples and performed statistical analysis on the results, shown in Fig. 4. This representation shows how can be used for tissue characterization. Water, calcium and connective tissues have, while for lipids this quantity is always positive. Fatty acids have a larger relative difference than plaque lipids. We can discriminate between plaque lipids, peri-adventitial fat, and other tissue components by setting two thresholds: > 0.1 for all lipids (red dashed line in Fig. 4) and for plaque lipids. The former threshold accounts for an unknown experimental variability in the PA spectra of collagen, elastin, and calcium, which were based on literature data, as well as a potential underestimation of the variance in the of plaque lipid related to composition differences. There is a small overlap of the relative differences between the plaque lipids and peri-adventitial fat. The upper threshold was defined as the minimum of the measured relative differences of peri-adventitial fat in our data set. In this way, most of the atherosclerotic plaques are detected while the other normal components of the artery wall (such as peri-adventitial fat) are excluded, minimizing the false-positive rate.
Fig. 4.
The relative difference between different tissue types at the wavelength of 1718 and 1734 nm plotted as average
2.4 Ex vivo experiments
2.4.1 Vessel mimicking phantom experiment
To test the presented method, we performed IVPA/IVUS imaging on a poly-vinyl-alcohol (PVA) vessel mimicking phantom (10% wt. PVA crystals in demineralized water, 3 freeze/thaw cycles of at least 2h). The phantom has a 3 mm diameter lumen with four cylindrical cavities 0.5 mm apart from the lumen. All the cylindrical cavities are 1.5 mm round by 5 mm deep. One cavity was filled with human peri-adventitial fat from a coronary artery specimen. The other three cavities were filled with pure cholesterol, cholesterol oleate and cholesterol linoleate samples (Sigma Aldrich Co., C8667, C9253 and C0289), respectively. A photo of the filled PVA vessel phantom is shown in Fig. 5(a).
Fig. 5.
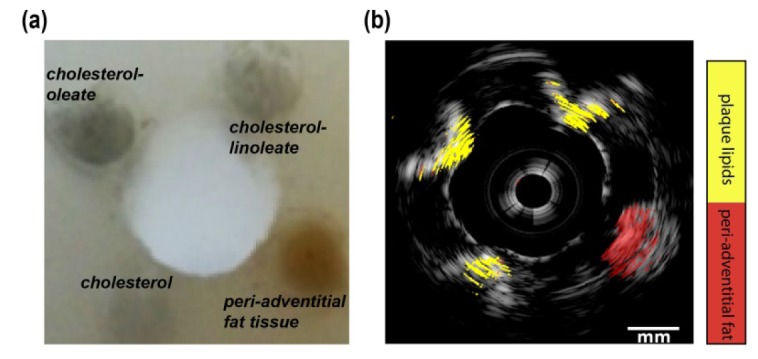
Lipid detection and differentiation result of the PVA vessel mimicking phantom. (a) The photo of the PVA vessel phantom with filled different lipid samples. (b) Lipid differentiation map fused with US image of the PVA vessel phantom. The lipids in plaques are in yellow and lipids in peri-adventitial tissue are in red. The dynamic range of the US image is 40 dB.
The phantom was placed in clear water at room temperature. The catheter was positioned inside the lumen of the phantom to image all the lipids filled in the cavities. By rotating the catheter 360° in 1° steps, the full cross-sectional IVPA/US images of the phantom were acquired. At every rotation angle, the laser was tuned between 1718 and 1734 nm to ensure the co-registration of the IVPA data at both wavelengths. US images were 8 times averaged; no averaging was applied for PA images.
2.4.2 Human coronary artery measurement
We collected human coronary arteries at autopsy from the Department of Pathology of Erasmus Medical Center (MC), after obtaining consent from the relatives. The research protocol was sanctioned by the Medical Ethics Committee of Erasmus MC (MEC-2007-081). The coronary arteries were frozen within 2h at −80°, then thawed and measured within 2 months. In the measurement, we fixed the artery on top of a custom built TPX tissue holder with an array of 200 µm thick metal wires glued every 1.5 mm at the bottom. The metal wires were clearly visible in the IVPA/IVUS images and used as the marker to register the imaging position. The tissue holder was placed inside a water tank filled with saline solution at room temperature. Spatially co-registered two-wavelength (1718 and 1734 nm) IVPA and IVUS images were obtained by rotating the catheter inside the lumen of the artery in 1° steps and repeating PA and US acquisitions at every step. IVUS images were 10 times averaged; no averaging was applied for PA images.
After the IVPA/IVUS imaging, we cut the artery at the two wires adjacent to the imaging plane, embedded in optimal cutting temperature (OCT) compound (Tissue-Tek®, Sakura Finetek Europe B.V.), and then were frozen on dry ice, and stored at −80°C until further processing. For histopathology, we cut into the tissue block until the imaged location was reached. A series of 10 µm thick sections were thaw mounted on slides and stained with Oil Red O (ORO) to identify lipids in the artery (lipids are stained red in ORO staining).
2.4.3 Data processing
All the stored US and PA data were digitally band pass filtered (10 to 70 MHz, 100th order zero-phase forward and reverse finite impulse response (FIR) filter), Tukey windowed, envelope filtered, artefacts removed and converted for display as discussed in our previous work [13]. Specifically, absorption of laser pulses in the catheter tip generates an artefact in the PA data that is proportional to the laser pulse energy. We used the magnitude of this signal to correct for variations in the laser energy between individual pulses and between the different wavelengths. The artefact was removed from the data by an adaptive filter that detects and suppresses highly correlated features across A-lines, spanning angles of more than 20 degrees. A binary denoising mask was defined to include all pixels where PA amplitude at 1718 nm is higher than the background noise threshold, and reject data elsewhere. The background noise threshold is calculated as the maximum envelope signal in a region of the image beyond the imaged object. This denoising mask was then applied to the pixel-to-pixel calculated relative difference between the PA signals at 1718 and 1734 nm as described in section 2.2. Subsequently, we obtained the lipid differentiation map by implementing the first cutoff threshold of 0.1 to detect all the lipids and the second cutoff threshold of 0.35 to identify only the lipid in plaques. The lipid differentiation map was then scan-converted to Cartesian coordinates, color coded (red for lipids in peri-adventitial tissue and yellow for lipids in plaques) and overlaid on the co-registered US images for display.
To evaluate the presented method, we calculated the classification accuracy for plaque lipid detection. True positives are plaque lipid pixels inside the external elastic lamina (EEL), which separates the media and adventitia layer of the artery wall; true negatives are adipose-type lipids pixels outside the EEL. Plaque lipid pixels outside the EEL are classified as false positives; as explained above, minimization of the number of false positives is important for clinical application. False negatives are not detected, as plaques often comprise a fraction of non-cholesterol lipids. We report performance as the number of plaque lipids inside and outside the EEL. The former is expected to be greater than zero but less than 100% because of the presence of fatty-acid-like lipid species; the latter should be as small as possible as no cholesterol-like molecules occur in adipose lipids.
3. Results
3.1 Lipid imaging in a vessel mimicking phantom
Figure 5(b) shows the lipid detection and differentiation results of the PVA vessel mimicking phantom. In the figure, all lipid samples inside the four holes were clearly visible and the lipid differentiation results agreed with the phantom arrangement very well. The attenuation by the lipid samples (and water, to a degree) in the 1.7 µm spectral range limits the PA imaging depth to about 2.5 mm. We calculated the differentiation results and got 97.3% true positive and no false positive lipid differentiation in the PVA phantom.
3.2 Lipid imaging in a human coronary artery specimen
Lipid content of a human atherosclerotic plaque was evaluated by IVPA in a left anterior descending artery (male donor, 80 years old). Histology shows the presence of a large eccentric plaque with abundant lipids both superficially and deeply located in the plaque (Fig. 6(a)). In Fig. 6(b), the EEL of the artery, separating the media and adventitia, is clearly visible in the IVUS image, and we marked the EEL by a light blue contour. The IVPA data confirm the lipid deposition that was identified in the histology, located from 12 o’clock to 9 o’clock inside the artery wall containing lots of extracellular lipid droplets. However, the lipids located from 9 o’clock to 12 o’clock inside the artery wall remain undetected. These are mostly intracellular lipids, to which IVPA appears to be less sensitive [13]. The IVPA signal strength also varies the distance from the catheter depending on the probe geometry [22]. Inside this lipid-rich plaque, 76% of the lipids are identified as cholesterol-derived plaque lipids (in yellow). The lipid signal observed from 7 o’clock to 12 o’clock outside the artery wall comes from adipose tissue, and 84% of this is indeed identified as peri-adventitial adipose tissue (in red).
Fig. 6.
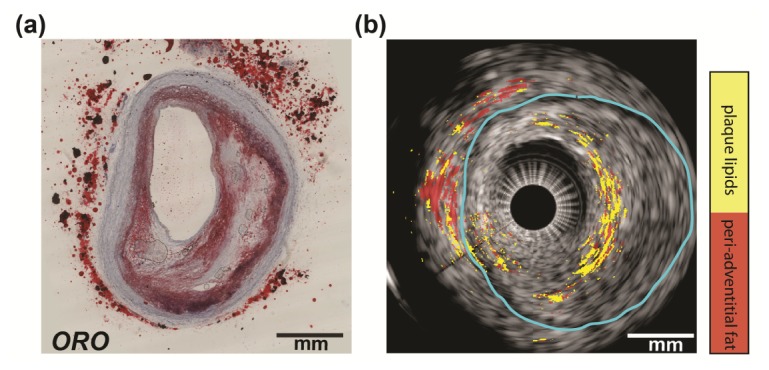
Ex vivo lipid differentiation result of an atherosclerotic human coronary artery (LAD, male, 80 years old). (a) Histology: Oil Red O staining of the IVPA/IVUS imaging cross section (lipids are in red). (b) Lipid differentiation map overlaid on the co-registered US image of the coronary artery. The lipids in plaques are in light blue and lipids in peri-adventitial tissue are in red. The dynamic range of the US image is 45 dB.
Ex vivo lipid differentiation in another human coronary artery is shown in Fig. 7. The histology of the artery (Fig. 7(a)) reveals absence of atherosclerosis in this cross section. All lipids in the ORO stain are located outside the artery wall. In the lipid differentiation map, all the detected lipids are shown outside the EEL (indicated by the light blue contour). We calculated that 95.5% of the detected lipids are identified as peri-adventitial adipose tissue.
Fig. 7.
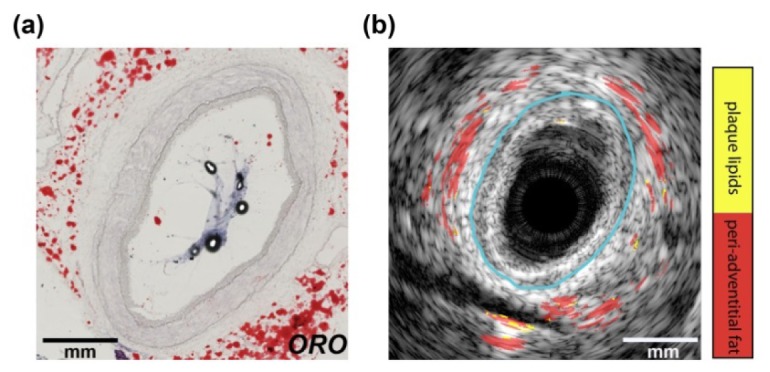
Ex vivo lipid identification result of a human coronary artery (LAD, male, 54 years old). (a) Histology: Oil Red O staining of the IVPA/IVUS imaging cross section (lipids are in red). (b) Lipid differentiation map overlaid on the co-registered US image of the coronary artery. The lipids in plaques are in light blue and lipids in peri-adventitial tissue are in red. The dynamic range of the US image is 45 dB.
All ex-vivo lipid identification results are presented in Table 1. The table lists the true (plaque lipids detected inside the artery wall) and false (plaque lipids detected outside the artery wall) plaque lipids detection results. Phantom case in shown in Fig. 5 and human artery case 1 and 2 are described above in Fig. 6 and Fig. 7. In artery case 3, we achieved 68% true positive and 18% false positive plaque lipid detection. In artery case 4, a large LRP was detected, and no peri-adventitial adipose tissue was visible due to insufficient laser light penetrating at its depth. In this case, we attained 67% true positive plaque lipid detection. Artery case 5 presents another clean artery and we achieved 14% false positive plaque lipid detection.
Table 1. Ex-vivo plaque lipid detection results (Phantom case in Fig. 5; artery case 1 in Fig. 6; artery case 2 in Fig. 7).
| Plaque lipids inside EEL (%) | Plaque lipids outside EEL (%) | |
|---|---|---|
| Phantom | 97.3 | 0 |
| Artery case 1 | 76 | 16 |
| Artery case 2 | – | 4.5 |
| Artery case 3 | 68 | 18 |
| Artery case 4 | 67 | – |
| Artery case 5 | – | 14 |
4. Discussion and conclusion
Our results have demonstrated that it is possible to detect and differentiate between the lipid in plaques and in peri-adventitial adipose tissue using relative difference of the PA signal at only two wavelengths, namely 1718 and 1734 nm. Small differences in the absorption spectrum of the different lipids in and around the artery make it possible to specifically identify plaque lipids by IVPA. To the best of our knowledge, the method presented here uses the lowest number of wavelengths for detecting and differentiating between lipids in plaques and in peri-adventitial adipose tissue.
In a series of human coronary arteries ex vivo, we identify about 70% of lipids in plaques, and 15% in the peri-adventitia tissue as cholesterol-like lipids. The latter number represents actual false positives. The former score may be affected by the variability of plaque lipid composition: Plaques also contain non-sterol lipids (e.g. triglycerides and phosphatidylcholines). These molecules do not contain a multiply connected carbon backbone, but rather consist of largely saturated hydrocarbon chains, which are likely to have a fatty-acid-like absorption spectrum. In a clinical application targeting coronary artery disease, specificity is preferable over sensitivity: it is more important to be sure that a detected LRP is actually a significant plaque, than to detect every small lipid deposit which is likely clinically irrelevant. We chose the upper threshold, separating plaque lipids from fatty acid, to prevent false positives as much as possible.
The optimal wavelength selection needs to be confirmed by a more extensive ex vivo spectroscopy study, deriving more robust cut-offs from the spectral data of human coronary artery plaques instead of pure lipid samples. Such a study requires spectroscopic IVPA imaging of full cross-sections, and at present our laser system is too slow to allow us to perform this measurement; faster IVPA systems are on the horizon [30–32]. For technical reasons, the OPO system we used in this study has a tuning accuracy in this wavelength range of a few nm, which means that the reported wavelengths are indeterminate within that band. The general principle of the method reported here remains valid, but the wavelength calibration is somewhat laser-dependent.
One limitation of our method is that the identification results are sensitive to noise, as it relies on the precise determination of the ratio between two relatively weak signals. At 1734 nm, lipids generated just moderate PA signals, making PA images at this wavelength vulnerable to noise. Further noise reduction and increased transducer sensitivity will improve the accuracy and reliability of the lipid identification. Another limitation is that the PA imaging depth at 1.7 µm is lower than that at 1.2 µm [21]. Nevertheless, the imaging depth we achieved in our ex vivo measurements of human coronary arteries at 1.7 µm was about 3 mm, which is sufficient to image human coronary arteries [21, 32]. The large absorption coefficient of superficial lipid did suppress the contrast of the deeper layer in the plaque shown in Fig. 6. As mentioned before, better detection sensitivity may help, although the strong superficial absorption at 1718 nm may actually “color” the light, causing a violation of the assumption that light at both wavelengths is equally attenuated, reducing to below the threshold set for lipids, leading to underestimation of the plaque volume. This is a fundamental limitation in PA imaging that also affects oxygen saturation measurements in other applications [33, 34]. Deriving a fluence correction and smoothing the lipid differentiation map may help to mediate this light coloring effect.
Our method will enable a rapid data acquisition, which is essential for clinical application of IVPA. In current clinical practice, LRP may be detected with high specificity by near-infrared reflection spectroscopy (NIRS) [6, 7, 35, 36]. A limitation of that technology in its commercial form is its inability to determine the depth of lipid deposits in the vessel wall. IVPA amends that shortcoming by not just detecting, but imaging lipids. NIRS has positively demonstrated the clinical value of an overall assessment of the presence of LRP in the whole artery, which is done in a display that summarizes the entire pullback, obviating the necessity to inspect the data set frame by frame. Earlier implementations of lipid detection by IVPA [5, 11, 15, 37] were unable to discriminate between plaque and adipose tissue. Peri-adventitial fat is detected in almost all IVPA images, and specific plaque lipid imaging is needed to present a clinician with a rapid assessment of the presence of LRP and the cap thickness overlaying the lipid core, without tedious examination of every individual cross sectional image in the pullback or error-prone automated IVUS image processing.
In conclusion, we have presented here a technique to specifically image lipids in atherosclerotic plaques. It relies on subtle spectroscopic contrast between different lipid types in and around the artery, which we probe by two-wavelength IVPA. Two thresholds applied to this differential measurement make it possible to detect all lipid and separate plaque-specific lipids from the more common fatty-acid-like lipids. This technique enables rapid identification of thin-cap lipid-rich atherosclerotic plaque in coronary arteries. Its speed and moderate pulse energy open up an avenue of translating IVPA imaging to clinical application.
References and links
- 1.Falk E., Shah P. K., Fuster V., “Coronary Plaque Disruption,” Circulation 92(3), 657–671 (1995). 10.1161/01.CIR.92.3.657 [DOI] [PubMed] [Google Scholar]
- 2.Virmani R., Burke A. P., Farb A., Kolodgie F. D., “Pathology of the vulnerable plaque,” J. Am. Coll. Cardiol. 47(8 Suppl), C13–C18 (2006). 10.1016/j.jacc.2005.10.065 [DOI] [PubMed] [Google Scholar]
- 3.Schaar J. A., Muller J. E., Falk E., Virmani R., Fuster V., Serruys P. W., Colombo A., Stefanadis C., Ward Casscells S., Moreno P. R., Maseri A., van der Steen A. F. W., “Terminology for high-risk and vulnerable coronary artery plaques. Report of a meeting on the vulnerable plaque,” Eur. Heart J. 25(12), 1077–1082 (2004). 10.1016/j.ehj.2004.01.002 [DOI] [PubMed] [Google Scholar]
- 4.Allen T. J., Hall A., Dhillon A., Owen J. S., Beard P. C., “Photoacoustic imaging of lipid rich plaques in human aorta,” in Photons Plus Ultrasound: Imaging and Sensing 2010, (SPIE, 2010), 75640C–75648. [Google Scholar]
- 5.Wang B., Su J. L., Amirian J., Litovsky S. H., Smalling R., Emelianov S., “Detection of lipid in atherosclerotic vessels using ultrasound-guided spectroscopic intravascular photoacoustic imaging,” Opt. Express 18(5), 4889–4897 (2010). 10.1364/OE.18.004889 [DOI] [PMC free article] [PubMed] [Google Scholar]
- 6.Waxman S., Dixon S. R., L’Allier P., Moses J. W., Petersen J. L., Cutlip D., Tardif J.-C., Nesto R. W., Muller J. E., Hendricks M. J., Sum S. T., Gardner C. M., Goldstein J. A., Stone G. W., Krucoff M. W., “In vivo validation of a catheter-based near-infrared spectroscopy system for detection of lipid core coronary plaques: initial results of the SPECTACL study,” JACC Cardiovasc. Imaging 2(7), 858–868 (2009). 10.1016/j.jcmg.2009.05.001 [DOI] [PubMed] [Google Scholar]
- 7.Gardner C. M., Tan H., Hull E. L., Lisauskas J. B., Sum S. T., Meese T. M., Jiang C., Madden S. P., Caplan J. D., Burke A. P., Virmani R., Goldstein J., Muller J. E., “Detection of lipid core coronary plaques in autopsy specimens with a novel catheter-based near-infrared spectroscopy system,” JACC Cardiovasc. Imaging 1(5), 638–648 (2008). 10.1016/j.jcmg.2008.06.001 [DOI] [PubMed] [Google Scholar]
- 8.Sethuraman S., Aglyamov S. R., Amirian J. H., Smalling R. W., Emelianov S. Y., “Intravascular photoacoustic imaging using an IVUS imaging catheter,” IEEE Trans. Ultrason. Ferroelectr. Freq. Control 54(5), 978–986 (2007). 10.1109/TUFFC.2007.343 [DOI] [PubMed] [Google Scholar]
- 9.Sethuraman S., Amirian J. H., Litovsky S. H., Smalling R. W., Emelianov S. Y., “Ex vivo Characterization of Atherosclerosis using Intravascular Photoacoustic Imaging,” Opt. Express 15(25), 16657–16666 (2007). 10.1364/OE.15.016657 [DOI] [PubMed] [Google Scholar]
- 10.Jansen K., van der Steen A. F. W., van Beusekom H. M. M., Oosterhuis J. W., van Soest G., “Intravascular photoacoustic imaging of human coronary atherosclerosis,” Opt. Lett. 36(5), 597–599 (2011). 10.1364/OL.36.000597 [DOI] [PubMed] [Google Scholar]
- 11.Wang P., Wang H. W., Sturek M., Cheng J. X., “Bond-selective imaging of deep tissue through the optical window between 1600 and 1850 nm,” J. Biophotonics 5(1), 25–32 (2012). 10.1002/jbio.201100102 [DOI] [PMC free article] [PubMed] [Google Scholar]
- 12.Wang B., Karpiouk A., Yeager D., Amirian J., Litovsky S., Smalling R., Emelianov S., “Intravascular photoacoustic imaging of lipid in atherosclerotic plaques in the presence of luminal blood,” Opt. Lett. 37(7), 1244–1246 (2012). 10.1364/OL.37.001244 [DOI] [PubMed] [Google Scholar]
- 13.Jansen K., Wu M., van der Steen A. F., van Soest G., “Lipid detection in atherosclerotic human coronaries by spectroscopic intravascular photoacoustic imaging,” Opt. Express 21(18), 21472–21484 (2013). 10.1364/OE.21.021472 [DOI] [PubMed] [Google Scholar]
- 14.Allen T. J., Hall A., Dhillon A. P., Owen J. S., Beard P. C., “Spectroscopic photoacoustic imaging of lipid-rich plaques in the human aorta in the 740 to 1400 nm wavelength range,” J. Biomed. Opt. 17(6), 061209 (2012). 10.1117/1.JBO.17.6.061209 [DOI] [PubMed] [Google Scholar]
- 15.Wang B., Karpiouk A., Yeager D., Amirian J., Litovsky S., Smalling R., Emelianov S., “In vivo intravascular ultrasound-guided photoacoustic imaging of lipid in plaques using an animal model of atherosclerosis,” Ultrasound Med. Biol. 38(12), 2098–2103 (2012). 10.1016/j.ultrasmedbio.2012.08.006 [DOI] [PMC free article] [PubMed] [Google Scholar]
- 16.Lundberg B., “Chemical Composition and Physical State of Lipid Deposits in Atherosclerosis,” Atherosclerosis 56(1), 93–110 (1985). 10.1016/0021-9150(85)90087-5 [DOI] [PubMed] [Google Scholar]
- 17.Stegemann C., Drozdov I., Shalhoub J., Humphries J., Ladroue C., Didangelos A., Baumert M., Allen M., Davies A. H., Monaco C., Smith A., Xu Q., Mayr M., “Comparative lipidomics profiling of human atherosclerotic plaques,” Circ. Cardiovasc. Genet. 4(3), 232–242 (2011). 10.1161/CIRCGENETICS.110.959098 [DOI] [PubMed] [Google Scholar]
- 18.Tsai C. L., Chen J. C., Wang W. J., “Near-infrared absorption property of biological soft tissue constituents,” J. Med. Biol. Eng. 21, 7–14 (2001). [Google Scholar]
- 19.Spector W. S., Handbook of Biological Data (W.B. Saunders and Company, 1956). [Google Scholar]
- 20.Takaoka M., Nagata D., Kihara S., Shimomura I., Kimura Y., Tabata Y., Saito Y., Nagai R., Sata M., “Periadventitial adipose tissue plays a critical role in vascular remodeling,” Circ. Res. 105(9), 906–911 (2009). 10.1161/CIRCRESAHA.109.199653 [DOI] [PubMed] [Google Scholar]
- 21.Jansen K., Wu M., van der Steen A. F., van Soest G., “Photoacoustic imaging of human coronary atherosclerosis in two spectral bands,” Photoacoustics 2(1), 12–20 (2014). 10.1016/j.pacs.2013.11.003 [DOI] [PMC free article] [PubMed] [Google Scholar]
- 22.Wu M., Jansen K., Springeling G., van der Steen A. F., van Soest G., “Impact of device geometry on the imaging characteristics of an intravascular photoacoustic catheter,” Appl. Opt. 53(34), 8131–8139 (2014). 10.1364/AO.53.008131 [DOI] [PubMed] [Google Scholar]
- 23.Zhou Q., Xu X., Gottlieb E. J., Sun L., Cannata J. M., Ameri H., Humayun M. S., Han P., Shung K. K., “PMN-PT single crystal, high-frequency ultrasonic needle transducers for pulsed-wave Doppler application,” IEEE Trans. Ultrason. Ferroelectr. Freq. Control 54(3), 668–675 (2007). 10.1109/TUFFC.2007.290 [DOI] [PubMed] [Google Scholar]
- 24.Stegemann C., Drozdov I., Shalhoub J., Humphries J., Ladroue C., Didangelos A., Baumert M., Allen M., Davies A. H., Monaco C., Smith A., Xu Q., Mayr M., “Comparative lipidomics profiling of human atherosclerotic plaques,” Circ Cardiovasc Genet 4(3), 232–242 (2011). 10.1161/CIRCGENETICS.110.959098 [DOI] [PubMed] [Google Scholar]
- 25.Anderson R. R., Farinelli W., Laubach H., Manstein D., Yaroslavsky A. N., Gubeli J., 3rd, Jordan K., Neil G. R., Shinn M., Chandler W., Williams G. P., Benson S. V., Douglas D. R., Dylla H. F., “Selective photothermolysis of lipid-rich tissues: A free electron laser study,” Lasers Surg. Med. 38(10), 913–919 (2006). 10.1002/lsm.20393 [DOI] [PubMed] [Google Scholar]
- 26.Caplan J. D., Waxman S., Nesto R. W., Muller J. E., “Near-infrared spectroscopy for the detection of vulnerable coronary artery plaques,” J. Am. Coll. Cardiol. 47(8 Suppl), C92–C96 (2006). 10.1016/j.jacc.2005.12.045 [DOI] [PubMed] [Google Scholar]
- 27.Nilsson A. M. K., Heinrich D., Olajos J., Andersson-Engels S., “Near infrared diffuse reflection and laser-induced fluorescence spectroscopy for myocardial tissue characterisation,” Spectrochim. Acta A Mol. Biomol. Spectrosc. 53(11), 1901–1912 (1997). 10.1016/S1386-1425(97)00106-6 [DOI] [PubMed] [Google Scholar]
- 28.Wieliczka D. M., Weng S., Querry M. R., “Wedge shaped cell for highly absorbent liquids: infrared optical constants of water,” Appl. Opt. 28(9), 1714–1719 (1989). 10.1364/AO.28.001714 [DOI] [PubMed] [Google Scholar]
- 29.Fleming C. P., Eckert J., Halpern E. F., Gardecki J. A., Tearney G. J., “Depth resolved detection of lipid using spectroscopic optical coherence tomography,” Biomed. Opt. Express 4(8), 1269–1284 (2013). 10.1364/BOE.4.001269 [DOI] [PMC free article] [PubMed] [Google Scholar]
- 30.D. VanderLaan, A. Karpiouk, D. Yeager, and S. Emelianov, “System and integrated catheter for real-time intravascular ultrasound and photoacoustic imaging,” in Ultrasonics Symposium (IUS), 2014 IEEE International, 2014), 1591–1594. 10.1109/ULTSYM.2014.0394 [DOI] [PMC free article] [PubMed] [Google Scholar]
- 31.Li Y., Gong X., Liu C., Lin R., Hau W., Bai X., Song L., “High-speed intravascular spectroscopic photoacoustic imaging at 1000 A-lines per second with a 0.9-mm diameter catheter,” J. Biomed. Opt. 20(6), 065006 (2015). 10.1117/1.JBO.20.6.065006 [DOI] [PubMed] [Google Scholar]
- 32.Wang P., Ma T., Slipchenko M. N., Liang S., Hui J., Shung K. K., Roy S., Sturek M., Zhou Q., Chen Z., Cheng J.-X., “High-speed intravascular photoacoustic imaging of lipid-laden atherosclerotic plaque enabled by a 2-kHz Barium Nitrite Raman Laser,” Sci. Rep. 4, 6889 (2014). 10.1038/srep06889 [DOI] [PMC free article] [PubMed] [Google Scholar]
- 33.Laufer J., Elwell C., Delpy D., Beard P., “In vitro measurements of absolute blood oxygen saturation using pulsed near-infrared photoacoustic spectroscopy: accuracy and resolution,” Phys. Med. Biol. 50(18), 4409–4428 (2005). 10.1088/0031-9155/50/18/011 [DOI] [PubMed] [Google Scholar]
- 34.Sivaramakrishnan M., Maslov K., Zhang H. F., Stoica G., Wang L. V., “Limitations of quantitative photoacoustic measurements of blood oxygenation in small vessels,” Phys. Med. Biol. 52(5), 1349–1361 (2007). 10.1088/0031-9155/52/5/010 [DOI] [PubMed] [Google Scholar]
- 35.Madder R. D., Goldstein J. A., Madden S. P., Puri R., Wolski K., Hendricks M., Sum S. T., Kini A., Sharma S., Rizik D., Brilakis E. S., Shunk K. A., Petersen J., Weisz G., Virmani R., Nicholls S. J., Maehara A., Mintz G. S., Stone G. W., Muller J. E., “Detection by Near-Infrared Spectroscopy of Large Lipid Core Plaques at Culprit Sites in Patients With Acute ST-Segment Elevation Myocardial Infarction,” JACC Cardiovasc. Interv. 6(8), 838–846 (2013). 10.1016/j.jcin.2013.04.012 [DOI] [PubMed] [Google Scholar]
- 36.Madder R. D., Smith J. L., Dixon S. R., Goldstein J. A., “Composition of Target Lesions by Near-Infrared Spectroscopy in Patients With Acute Coronary Syndrome Versus Stable Angina,” Circ. Cardiovasc. Interv. 5(1), 55–61 (2012). 10.1161/CIRCINTERVENTIONS.111.963934 [DOI] [PubMed] [Google Scholar]
- 37.Wang H. W., Chai N., Wang P., Hu S., Dou W., Umulis D., Wang L. V., Sturek M., Lucht R., Cheng J. X., “Label-free bond-selective imaging by listening to vibrationally excited molecules,” Phys. Rev. Lett. 106(23), 238106 (2011). 10.1103/PhysRevLett.106.238106 [DOI] [PMC free article] [PubMed] [Google Scholar]


