Abstract
To maximize the collection efficiency of back-scattered light, and to minimize aberrations and vignetting, the lateral position of the scan pivot of an optical coherence tomography (OCT) retinal scanner should be imaged to the center of the ocular pupil. Additionally, several retinal structures including Henle’s Fiber Layer (HFL) exhibit reflectivities that depend on illumination angle, which can be controlled by varying the pupil entry position of the OCT beam. In this work, we describe an automated method for controlling the lateral pupil entry position in retinal OCT by utilizing pupil tracking in conjunction with a 2D fast steering mirror placed conjugate to the retinal plane. We demonstrate that pupil tracking prevents lateral motion artifacts from impeding desired pupil entry locations, and enables precise pupil entry positioning and therefore control of the illumination angle of incidence at the retinal plane. We use our prototype pupil tracking OCT system to directly visualize the obliquely oriented HFL.
OCIS codes: (110.4500) Optical coherence tomography, (170.4460) Ophthalmic optics and devices
1. Introduction
Optical coherence tomography (OCT) has become the standard of care for many pathological ophthalmic conditions [1,2]. Conventional OCT retinal systems employ a telescope to image the beam scanning pivot to the pupil plane of the patient and the OCT beam is focused on the retinal surface by the patient’s optics. To maximize the collection efficiency of back-scattered light and to minimize aberrations and vignetting, the lateral position of the scan pivot is typically imaged to the center of the ocular pupil [1]. Some commercial OCT systems employ IR pupil cameras to allow alignment of the OCT beam with the patient’s eye. However, such systems are still vulnerable to lateral patient motion and depend upon active involvement of the photographer to maintain alignment. Pupil entry position may also play a critical yet underappreciated role in the geometrical accuracy of OCT retinal images [3–5]. In particular, lateral displacement of the beam in the pupil is responsible for the often observed “tilt” of OCT retinal B-scans.
In retinal imaging systems, the illumination angle is in part determined by the pupil entry position. Because the reflectivity of many retinal structures depend on illumination angle, the visibility of these structures can vary as a function of entry pupil position. For example, poor off-axis retinal reflectivity of the photoreceptor layers can be attributed to the optical Stiles-Crawford effect (OSCE), the waveguiding effect of cone photoreceptors, and can result in poor imaging performance when pupil position is not well controlled [6–8]. The OSCE was investigated with OCT by measuring the dependence of back-scattered intensity from the inner/outer photoreceptor segment (IS/OS), the photoreceptor outer segment (PTOS), and retinal pigment epithelium (RPE) on pupil entry position [9]. However, subject motion artifacts hindered the reproducibility of pupil entry position and illumination angles. Similarly, the directional sensitivity of back-scattered intensity from the retinal nerve fiber layer (RNFL) has also been characterized in vitro by manually varying the illumination incidence angle [10,11].
Henle’s Fiber Layer (HFL) is an additional retinal structure that exhibits reflectivity dependence on pupil entry position [12–14]. Lujan et al. showed that the oblique orientation of HFL around the foveal pit resulted in diminished OCT visualization if the beam scanning pivot was centered on the ocular pupil. By displacing the OCT beam laterally, the collected back-scattered intensity of HFL increased on the opposite side of the foveal pit from the pupil entry offset, resulting in enhanced OCT visibility due to nearly normal illumination relative to HFL fibers in that region. Using eccentric pupil entry positions in a technique called Directional OCT, visualization of HFL enabled anatomically correct ONL thickness measurements [15,16]. However, similar to previous studies, the pupil entry position manual displacement was subject to patient motion and operator misalignment. In addition, the lack of visual references on the pupil also restricted acquisition of multiple scans through the same entry location. Other groups have focused on exploiting HFL birefringence [14] to infer its location and correlate polarization sensitive measurements with several diseases, including age-related macular degeneration [17–19]. However, polarization sensitive measurements are not as standardized and clinically accepted for disease correlation as thickness maps produced from intensity-based OCT volumes. As an alternative, we propose pupil tracking as an attractive option for controlling pupil entry position to optimize signal from the retinal interface of interest to the medical practitioner.
Pupil tracking is a low-cost video-oculography technique for monitoring subject eye motion [20,21]. When coupled to a retinal imaging system [22], pupil tracking offers direct visualization of the subject’s pupil plane. Precise knowledge of the beam entry position at the pupil plane and beam location at the retinal plane can elucidate the beam trajectory through the subject's eye and retinal angle of illumination. As quantitative metrics involving distances, areas and volumes derived from OCT images become more prevalent, awareness of the geometrical accuracy of OCT images and careful control of the beam trajectory through the pupil may become increasingly important [3–5].
In this work, we describe an automated method for controlling the lateral pupil entry position in retinal OCT by utilizing pupil tracking in conjunction with a 2D fast steering mirror placed conjugate to the retinal plane. We show that pupil tracking prevents lateral motion artifacts and vignetting from obscuring the desired pupil entry location and enables precise pupil entry positioning and therefore control of the illumination angle of incidence on the retinal plane. Moreover, we demonstrate the clinical utility of pupil tracking OCT by illuminating HFL through controlled and repeatable pupil positions for enhanced visualization and thickness measurements.
2. Pupil tracking OCT
2.1 Design considerations
A conventional retinal OCT scanner [1], shown in Fig. 1(A), uses a 4f configuration to image the scan pivot to the subject's pupil plane. Imaging scanning mirrors angularly scan the beam at a pupil conjugate plane, resulting in lateral scanning at the retina. Similarly, a second scanner set, termed tracking scanner, can be placed at the retinal conjugate plane to achieve lateral translation of the scan pivot at the subject’s pupil plane (Fig. 1(B)-1(C)). If the tracking scanner is placed at the Fourier plane of the 4f telescope, the amount of scan pivot lateral translation is governed by the angular range of the tracking scanner and the focal length of the second element of the 4f telescope, as described by the following equation using the small angle approximation:
| (1) |
where ΘTS is the angular range, f2 is the focal length of the second element of the telescope, and FOVTS is the lateral scanning range of the tracking scanner at the pupil plane. Moreover, placing the imaging and tracking scanners in orthogonal planes eliminates cross-talk, ensuring that the OCT scan location (on the retina) is unaltered during tracking. By automatically controlling the tracking scanner, lateral patient motion monitored by pupil tracking can be compensated for to keep the scan pivot centered on the ocular pupil and to minimize vignetting and aberrations (Fig. 1(B)). Furthermore, the scan pivot can be translated across the pupil plane to image retinal structures of interest at different angles of incidence (Fig. 1(C)).
Fig. 1.
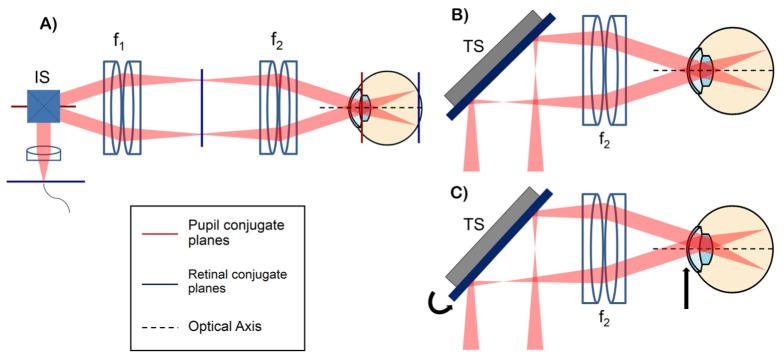
(A) conventional retinal OCT scanner with pupil (red) and retinal (blue) conjugate planes highlighted. IS: imaging scanners placed at a pupil conjugate plane, f: lenses. (B-C) configurations showing the scanning pivot imaged onto the center of the ocular pupil (B) and the scanning pivot offset from the center of the ocular pupil using the tracking scanner (TS) (C). The tracking scanner placed at a retinal conjugate plane allows automatic lateral translation of the scan pivot at the subject's pupil plane.
It is important to note that under the configuration described above, the clear aperture of the tracking scanner, instead of the angular range of the imaging scanners, may limit the OCT field of view (FOV). Under this assumption, the OCT imaging FOV can be described as:
| (2) |
where ΘOCT is the angular OCT FOV, DTS is the clear aperture of the tracking scanner, f1 is the focal length of the first element of the telescope, and Mang is the angular magnification of the telescope, where Mang = f1/f2. Multiplying the tracking and OCT FOVs yields a result that is independent of the focal lengths of the lenses in the telescope and proportional to the tracking scanner scan-angle mirror-size product:
| (3) |
Therefore, to maximize the OCT and tracking scanner FOVs when the clear aperture of the tracking scanner is limiting, the optimal tracking scanner exhibits the largest scan-angle mirror-size product. Typically, scanning mirrors have an inherent tradeoff between angular range and aperture size. Equations (1) and (2) show that the OCT and tracking scanner FOVs can be optimized by choosing the appropriate tracking scanner aperture size and angular range, respectively. In the case where DTS is sufficiently large such that the lens apertures are limiting, ΘTS and f2 should be chosen carefully to limit the amount of vignetting while achieving sufficient FOVTS. In this work, we determined that a ± 3.5 mm FOVTS was sufficient to compensate for lateral eye motion of a fixating subject.
2.2 OCT system design
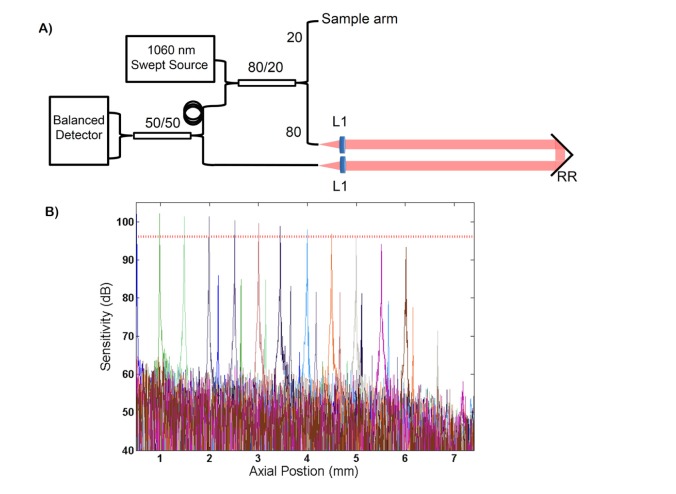
The custom swept-source OCT (SSOCT) system, depicted in Fig. 2(A), employed a swept-frequency laser (Axsun Technologies; Billerca, MA) centered at 1060 nm with a sweep rate of 100 kHz and bandwidth of 100 nm. The source illuminated a transmissive reference arm interferometer and the interferometric signal was detected with a balanced photoreceiver (Thorlabs, Inc.; Newton, NJ) and digitized (AlazarTech Inc.; Pointe-Claire, QC, Canada) at 800 MS/s. The measured peak sensitivity of the system was 102.8 dB. The measured −6 dB sensitivity fall off and axial resolution were 4.6 mm (Fig. 2(B)) and 7.9 μm, respectively. GPU-assisted custom software enabled real-time acquisition, processing, and display of volumetric data sets acquired at an A-line rate of 100 kHz.
Fig. 2.
(A) schematic of the interferometer topology of the swept-source OCT engine. L: lenses, RR: retroreflector. (B) fall off sensitivity performance of the system. Sensitivity is plotted in dB. The measured −6 dB sensitivity fall off (denoted by the horizontal dashed red line) was 4.6 mm.
The sample arm (Fig. 3(A)) consisted of a telescope, with each element composed of two 150 mm effective focal length (EFL) achromatic doublet lenses (yielding a composite EFL of 68 mm), to image the scanning pivot onto the ocular pupil. A dichroic mirror was used to couple a pupil camera onto the OCT optical axis (described in detail below). The tracking scanner was a 2D fast steering mirror with a bandwidth of 560 Hz (Optics in Motion LLC; Long Beach, CA) placed in the Fourier plane of the telescope and thus conjugate to the subject’s retinal plane. The tracking mirror had a clear aperture of 1.8 x 2.7 inches and a total optical angular range of ± 3°. The theoretical tracking FOV was ± 3.56 mm, limited by the lens apertures and dichroic mirror. The OCT FOV was limited to ± 5° to reduce aberration propagation through the system and to minimize vignetting at the lens apertures during tracking. The beam size at the cornea was 2.3 mm. Using the schematic eye developed by Goncharov and Dainty [23], the simulated theoretical spot size at the retina varied between 25.3 and 26.6 μm (Fig. 3(B)) using optical ray tracing software (Zemax, LLC; Redmond, WA). The theoretical resolution varied between 25.2 and 27.5 μm after a + 3.5 mm (Fig. 3(C)) lateral displacement of the scan pivot to simulate the optical performance during tracking.
Fig. 3.
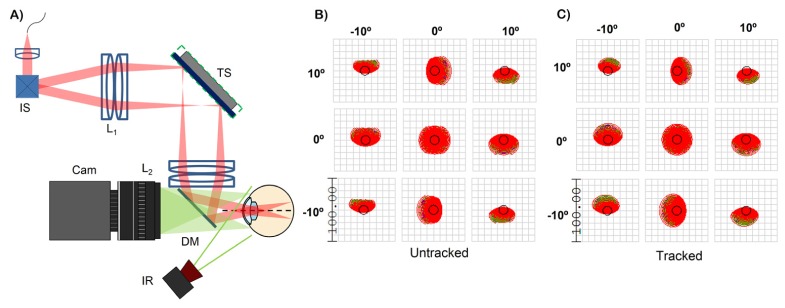
(A) sample arm configuration of the pupil tracking OCT system. IS: imaging scanners, TS: tracking scanner, L: lenses, DM: dichroic mirror, IR: infrared illumination, Cam: pupil tracking camera. The shortpass dichroic mirror with a cut off at 960 nm coupled the pupil camera and the OCT optical axis. (B) and (C) are optical spot diagrams for the untracked and tracked configurations. Scale bar is in microns. The black circle is the Airy disk.
In the presence of refractive error, the imaging plane needs to be axially translated to focus the OCT beam on retina. However, if the physical locations the imaging scanners, tracking scanners, and/or lenses of the telescope are changed, orthogonality between the imaging and tracking scanners may be compromised. Additionally, if refractive error correction is performed by axially displacing the last lens of the telescope, the lateral tracking range of the mirror will also vary. To avoid any loss of orthogonality or variation in lateral tracking range, refractive error correction was performed by axially translating the first lens of the system (collimator).
2.2 Pupil tracking
Video of the ocular pupil was acquired with a 150 frame-per-second monochromatic camera (Point Grey Research Inc.; Richmond, BC, Canada) with a resolution of 1280 x 1024 and a pixel pitch of 4.8 μm. The imaging plane of the camera was parfocal with the OCT scanning pivot image plane and the subject's pupil plane. The ocular pupil was illuminated with an infrared (IR) light emitting diode (LED) (Thorlabs, Inc.; Billerca, MA) at 850 nm relayed via a 50 mm focal length lens to decrease illumination divergence before the eye. The IR illumination system was placed 19 cm away from the subject’s pupil and enhanced contrast between the pupil and iris/sclera. A shortpass dichroic mirror with a reflectivity cutoff at 960 nm was used to couple the IR illumination and pupil camera with the OCT optical axis. Pupil camera videos were acquired at a downsampled resolution of 320 x 256 pixels to increase the frame rate to 500 Hz (limited by camera control software). The camera pixel size was 45 μm after magnification with a 16 mm focal length imaging lens (Edmund Optics Inc.; Barrington, NJ), yielding a camera FOV of 1.44 x 1.15 cm. A bandpass camera filter centered at 850 nm (Thorlabs, Inc.; Billerca) prevented extraneous ambient and OCT light from altering the histogram distribution of the acquired frames.
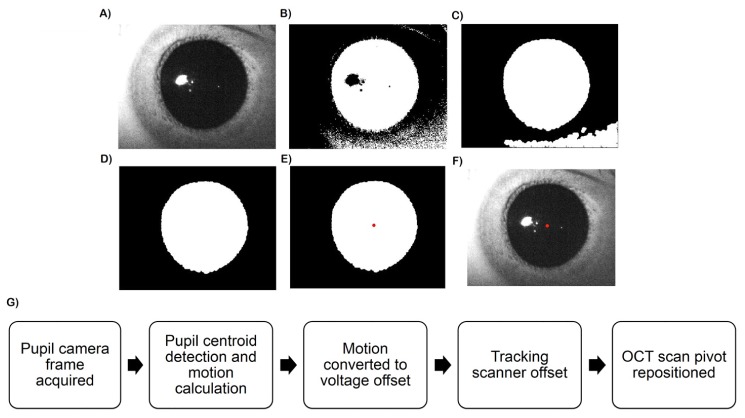
The 850 nm IR illumination was transmitted by the ocular pupil but was reflected by the iris, sclera, and surrounding skin to yield bimodal histograms that allowed simple and fast segmentation (Fig. 4(A)). In C++ , the images were thresholded to produce a binary image for initial pupil tracing (Fig. 4(B)). Because of the stability of the IR illumination and rejection of extraneous light by IR camera bandpass filter, the histogram of the image intensity distribution did not vary within an imaging session and the threshold value was determined only once at the start of each session. After thresholding, morphological closing removed extraneous dark regions (e.g. shadows, eyelashes) that may distort the pupil boundary [20] (Fig. 4(C)). Connected component analysis, a common application of graph theory for labeling in binary images, was then used to identify the largest binary blob as the segmented pupil (Fig. 4(D)). Lastly, the pupil centroid was determined by calculating its center of mass (Fig. 4(E)). In real-time operation, the algorithm indicated the location of the detected pupil center on the displayed video frames (Fig. 4(F)). This segmentation approach was fast and performed well with the bimodal images produced by controlled IR illumination [20, 21]. After calculation of the pupil location, the software output yielded motion of the pupil centroid relative to the previous frame in pixels (Fig. 4(G)). The estimated motion was then converted to voltages used to drive the tracking scanner and realign the OCT scan after each processed camera frame.
Fig. 4.
(A-F) image processing for pupil tracking. The original images (A) were thresholded (B) after which morphological operators removed extraneous dark regions (C). Connected component analysis was performed to identify the pupil (D) and the centroid was calculated (E). The detected pupil centroid was denoted with a red dot on the displayed frame (F) in real time. (G) Pupil tracking flow chart. The tracking scanner was repositioned after every processed camera frame according to the lateral subject motion detected by the pupil tracker.
2.3 Tracking characterization
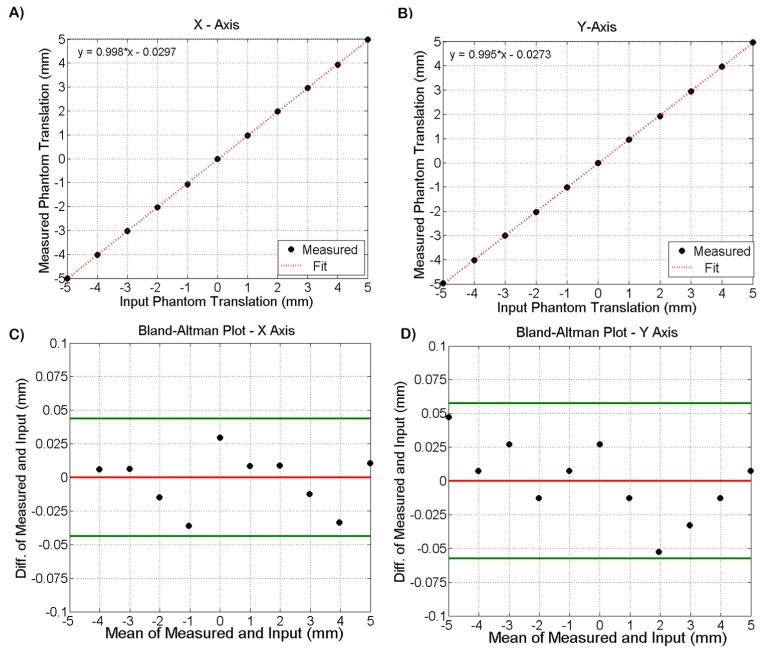
To characterize the tracking accuracy of the pupil tracking algorithm, a pupil phantom was placed on a translation stage at the pupil camera’s focal plane and was displaced −5 to 5 mm in the horizontal and vertical directions in 1 mm increments. The pupil phantom consisted of a photograph of an ocular pupil laser jet printed at 600 DPI on white paper and illuminated with IR light to simulate the pupil/iris contrast expected during in vivo imaging. The tracking algorithm detected the pupil centroid and calculated its motion relative to the previous camera frame. The actual translation of the pupil phantom was plotted against the motion detected by the tracking algorithm and fit to a line. Figure 5(A)-5(B) shows the plots for both the horizontal and vertical axes. The slopes of the fits were 0.998 and 0.995 for X and Y, respectively. A systematic mean error of −29 μm and −27 μm in the X and Y dimensions was measured. The difference and mean of the measured and input displacements were calculated and plotted in Bland-Altman plots shown in Fig. 5(C)-5(D) after correction of the systematic bias. The 95% confidence interval, denoted by the green lines, for tracking accuracy was approximately ± 50 μm in both dimensions. Next, the pupil phantom was translated by + 5 and −5 mm in both the horizontal and vertical directions. The tracking accuracy was measured a total of 5 times at each of the 4 locations, resulting in 20 accuracy measurements. The standard deviation was calculated and tracking repeatability was 35 μm.
Fig. 5.
(A-B) plots of input phantom displacement versus measured phantom translation via pupil tracking in both the horizontal (A) and vertical (B) axes. The slopes of the fits for the X and Y directions were 0.998 and 0.995 respectively. (C-D) Bland-Altman plots for the measured and input data. The red horizontal line denotes the mean and the horizontal green lines denote the 95% confidence interval bounds. The tracking accuracy 95% confidence interval was ~ ± 50 μm in both X and Y.
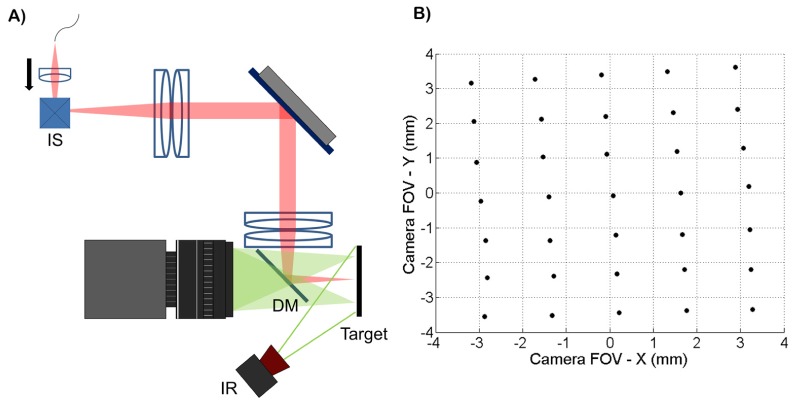
To calibrate the tracking scanner, the collimator was displaced axially to focus the OCT beam at the pupil plane without changing the image location of the scan pivot (Fig. 6(A)). After placing a target at the pupil plane, the scan pivot position was determined by imaging the back-scattered OCT light using the pupil camera and calculating the centroid location of the beam. The imaging scanners were restricted to their central position during this experiment. A grid of 35 points covering the entire lateral tracking FOV was obtained (Fig. 6(B)) using a DC variable voltage power supply to control the tracking scanner. Cross-talk between the two input channels of the tracking scanner was observed. To compensate for this, two functions, X(Vx, Vy) and Y(Vx, Vy), were fit with planes, where Vx and Vy were the tracking scanner input voltages and X and Y were the measured lateral displacements shown in Fig. 6(B). The system of equations was then solved for Vx and Vy to obtain calibration functions that compensated for the cross-talk. The planar fits (Fig. 7(A)-7(B)) were restricted to ± 3.5 mm in both the horizontal and vertical dimensions. These fits were used to calibrate the tracking scanner and the fit residuals are shown in Fig. 7(C)-7(D). The R2 values were 0.9997 for both X(Vx, Vy) and Y(Vx, Vy). The root mean squared errors (RMSE) for the X and Y fits were 42 μm and 43 μm, respectively. After calibration, repeatability of the tracking scanner was measured by offsetting the scan pivot position to + 3.5 mm and - 3.5 mm in both the X and Y dimensions and the scan pivot position was measured by calculating the beam centroid at each of the 4 positions. This procedure was repeated 5 times, resulting in 20 measurements and the standard deviation of the measured scan pivot positions was calculated. The repeatability was measured at 14 μm.
Fig. 6.
(A) experimental setup to quantify tracking scanner accuracy and repeatability. OCT light was focused on a target placed at the pupil plane without changing the location of the scan pivot by axially displacing the collimator. (B) grid of 35 points covering the lateral displacement of the scan pivot achievable with the tracking scanner. The scan pivot location was determined by offsetting the tracking scanners and imaging the backscattered OCT light from the target with the pupil camera. These points were used to calibrate the tracking scanner to compensate for cross-talk between the X and Y channels.
Fig. 7.
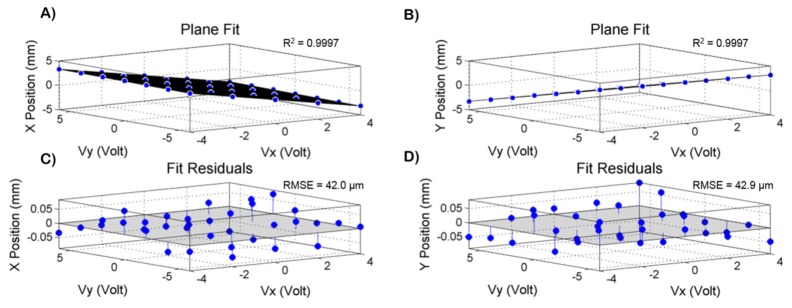
(A-B) X(Vx,Vy) and Y(Vx,Vy) planar fits used to calibrate the tracking scanner, where Vx and Vy are the tracking scanner input voltages and X and Y are the measured lateral displacements of the laser spot on the target. The R2 values were 0.9997 for both X and Y fits. (C-D) plot of fit residuals for X and Y. The RMSE values were 42.0 μm and 42.9 μm for X and Y, respectively.
The pupil tracking system total accuracy and repeatability was calculated as the root of the sum of the squares (assuming normal distributions) of the measured sub-system (tracking algorithm and tracking mirror) accuracies and repeatability. The tracking accuracies were 25 μm and 42 μm for the tracking algorithm and the tracking mirror after calibration, respectively. The total tracking system accuracy was then estimated to be μm. Similarly, the total tracking repeatability was μm. The estimated accuracies and repeatability are summarized in Table 1.
Table 1. Accuracy and Repeatability of Pupil Tracking System.
| Accuracy (μm) | Repeatability (μm) | |
|---|---|---|
| Tracking Algorithm | 25 | 35 |
| Tracking Scanner | 42 | 14 |
| Total System | 49 | 38 |
The temporal characteristics of the tracking system were measured using a second fast steering test mirror (Optics in Motion, LLC; Long Beach, CA) placed between the dichroic mirror and a pupil phantom (phantom is described in detail above). Pupil phantom motion was simulated using a function generator to drive the test fast steering mirror. First, the tracking bandwidth was determined by analyzing the step response of the system. A step function input to the step steering mirror was designed to simulate a lateral step motion of 1mm of the pupil phantom. The driving step voltage waveform provided to the test steering mirror as well as the tracking mirror voltage waveform generated by the tracking algorithm were recorded using a digital oscilloscope (Teledyne LeCroy; Chestnut Ridge, NY). The derivative of the rising edge of the measured step response was interpreted as the tracking system impulse response, and the magnitude of the Fourier transform of the impulse response yielded the tracking system transfer function power spectrum. Using this test process, the −3 dB bandwidth of the tracking system was measured as 58 Hz, and since the bandwidth of the tracking mirror was 560 Hz (as provided by the manufacturer), 58 Hz was taken as the tracking system limiting bandwidth. Moreover, the latency of the tracking system was measured by simulating 1 Hz sinusoidal pupil phantom motion using the test fast steering mirror, and recording the corresponding sinusoidal tracking output. Cross-correlation of these two waveforms yielded a measured latency of the tracking system of 4 ms.
3. In vivo pupil tracking OCT imaging
3.1 Ethical considerations
All human subject imaging was approved by the Duke Medical Center Institutional Review Board. Prior to imaging, informed consent was obtained from each subject after clear explanation of study risks. Power from the OCT system was 1.84 mW before the cornea, which was below the ANSI maximum permissible exposure (MPE) at 1060 nm. The additional IR LED illumination power on the cornea was 0.53 mW, at 850 nm, thus the fractional contribution from both light sources at their respective wavelengths was less than 100% of the MPE.
3.2 Pupil tracking OCT imaging of healthy subjects
Using pupil tracking OCT, B-scans of an undilated healthy subject were acquired at 5 different pupil entry positions from −2 to 2 mm in 1 mm increments, as shown in Fig. 8. The pupil entry offsets were referenced to the pupil centroid location detected in real time. The B-scans consisted of 1000 A-lines/B-scan and were averaged 10x. A fixation target ensured that the fovea was centered on the OCT 10° FOV. The corresponding pupil camera frames are shown above the B-scans. The lateral position of the pupil entry location is denoted by the red dot on the camera frames. Note that the apparent B-scan tilt is not anatomically correct but instead is a result of varying optical path length along the B-scan axis caused by retinal illumination at different angles of incidence. As expected, the translation of the scan pivot in the pupil plane did not significantly alter the OCT scan location since the imaging and tracking scanners were placed in anti-conjugate planes to minimize cross-talk.
Fig. 8.
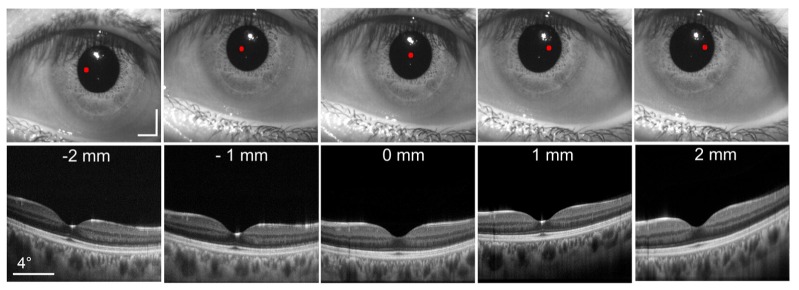
B-scans acquired at 5 different pupil entry positions. Each B-scan was comprised of 1000 A-lines and averaged 10x. The corresponding pupil camera frames are shown above each B-scan. The red dot denotes the location of the OCT scan pivot. Scale bars on pupil camera frames are 2 mm. A fixation target was used to keep the fovea centered on the OCT FOV. The white reflex present in the camera images is caused by the IR illumination LED.
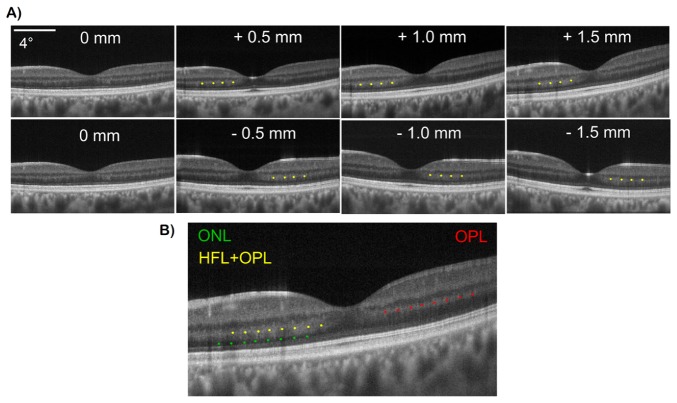
To demonstrate detection of angle-dependent backscattering retinal layers, pupil tracking OCT was used to image Henle’s Fiber Layer (HFL). A series of B-scans were acquired from a healthy subject at pupil offsets from −1.5 to 1.5 mm in 0.5 mm increments. As the scan pivot was varied eccentrically, HFL back-coupling increased on the contralateral side to the foveal pit due to oblique illumination there (resulting in illumination at close to normal incidence relative to HFL fiber bundles), as shown in Fig. 9(A). Yellow dots label the HFL + OPL complex on the OCT B-scans. Continuous intensity at the HFL + OPL interface makes it impossible to differentiate the two layers when HFL is visible. However, because OPL reflectivity is less variant with changing pupil entry positions, OPL (denoted by the red dots in Fig. 9(B)) can be better visualized in OCT B-scans in regions where HFL visibility is minimal due to eccentric pupil entry positions. Additionally, true ONL (denoted by the green dots) can be better visualized in regions where the HFL + OPL complex is fully visible.
Fig. 9.
(A) direct visualization of HFL in representative OCT B-scans acquired at different pupil entry positions varying from −1.5 to 1.5 mm. HFL + OPL complex is denoted by the yellow dots. As evident, HFL visualization is dependent on pupil entry position and angle of incidence of retinal illumination. (b) B-scan with HFL + OPL (yellow dots), ONL (green dots) and OPL (red dots) labeled. Direct visualization of HFL with pupil tracking OCT enables accurate visualization of ONL and OPL.
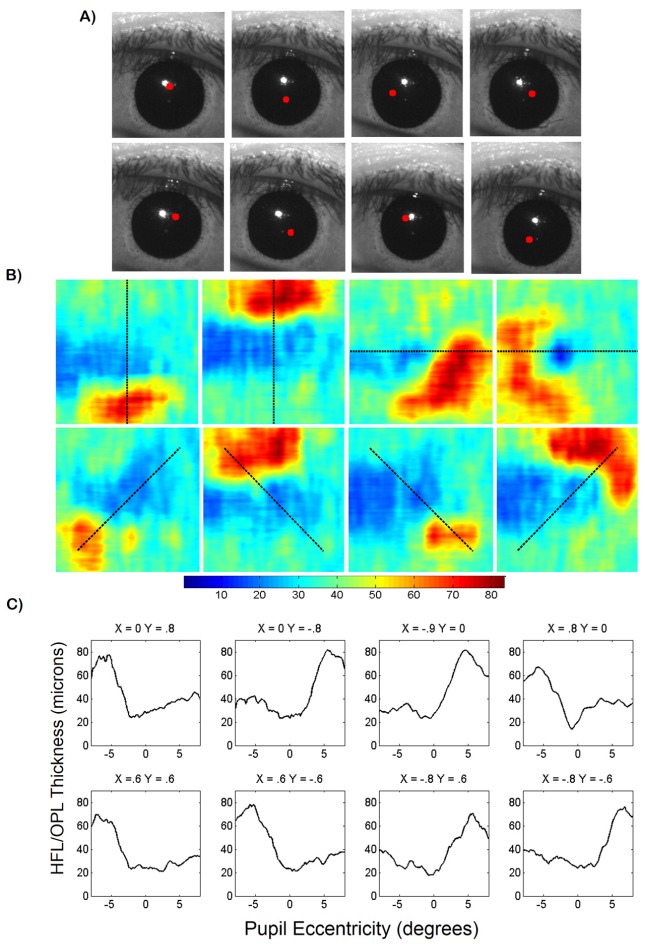
To generate HFL + OPL thickness maps and acquire anatomically correct 2D retinal layer thickness measurements, OCT volumes centered on the fovea were obtained at 8 different pupil entry offsets in an undilated subject. The volumes were composed of 800 A-lines/B-scan and 400 B-scans. The pupil entry offsets were chosen to optimize HFL visibility while minimizing vignetting at the ocular pupil. To quantify variation of visibility of the HFL + OPL complex due to pupil entry offset, our previously published retinal layer segmentation algorithm [24] was implemented to produce thickness measurements. Manual correction of the automatically segmented images was required because the segmentation algorithm was not optimized for variable HFL visibility in B-scans acquired at different pupil entry positions. After segmentation, the HFL + OPL complex thickness was calculated to produce 8 thickness maps at different pupil entry position (Fig. 10). The corresponding pupil camera frames with a red dot denoting the pupil entry location are shown in Fig. 10(A). The thickness maps show increased HFL + OPL thickness on the side of the fovea opposite the pupil entry position (Fig. 10(B)). Thickness maps as a function of retinal eccentricity calculated at different meridians (denoted by the dashed black line) were plotted in Fig. 10(C). HLF + OPL thickness was between 60 and 80 μm at the side of the foveal pit contralateral to the pupil entry position. Conversely, HFL + OPL thickness was between 20 and 40 μm on the opposite side of the foveal pit, indicating minimal HFL visibility in these regions.
Fig. 10.
(A) corresponding pupil camera frames with beam entry position denoted by red dot. (B) HFL + OPL complex thickness maps generated using semi-automatic segmentation of OCT volumes acquired at 8 pupil entry positions. Color bar is in microns. Dashed black lines denote thickness map profile shown below. (C) HFL + OPL thickness plots acquired from thickness maps in (B). Pupil entry positions above thickness plots are in millimeters and referenced to the pupil centroid calculated in real time.
To create an HFL + OPL composite thickness map, thickness maps acquired at different pupil entry positions (shown in Fig. 10) were registered based on the foveal position denoted during segmentation. The thickness values of the composite map were determined by comparing the registered individual thickness maps at each pixel and finding the maximum value. The resulting composite thickness map is shown in Fig. 11(A). To quantify HFL + OPL composite thickness, a series of 360 radially oriented profiles (in 1° increments) were acquired from the composite map and the standard deviation and mean were calculated. The circumferential thickness mean and standard deviation are plotted as a function of retinal eccentricity in Fig. 11(B). As evident, there was a sharp increase in measured thickness from about 28 to 68 μm between 1° and 4° of eccentricity with a plateau where the thickness stays relatively constant between 60 and 80 μm after 4° of eccentricity.
Fig. 11.
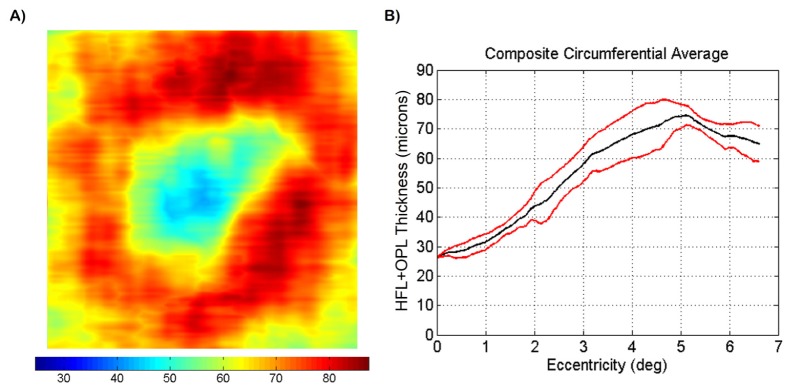
(A) HFL + OPL composite thickness map. The thickness maps shown in Fig. 10 were registered based on foveal position and the largest thickness values were extracted to generate the composite map. Color bar is in microns. (B) circumferential average HFL + OPL thickness as a function of retinal eccentricity. 360 radially oriented profiles, spaced 1° apart, were calculated. Mean (black) and standard deviation (red) were calculated and plotted.
4. Discussion
We have shown that our pupil tacking system allows precise positioning of the beam pupil entry position. In retinal imaging systems, knowledge of the pupil entry position and scan location at the retinal plane can result in enhanced knowledge of the beam trajectory through the subject's eye that can elucidate the illumination incidence angle at the retinal plane. As discussed above, there are a variety of retinal structures that exhibit illumination directionality dependence [6–16]. Previous studies exploring this dependence varied the pupil entry position manually and therefore were subject to motion artifacts that hindered repeatability. Our system may facilitate such studies by automating translation of the scan pivot and mitigating lateral motion artifacts. Moreover, our system may facilitate studies over long periods of time by enabling reproducibility of beam entry positions.
In addition, although not experimentally demonstrated herein, our system is capable of compensating for rotational eye movements. Eye rotation is accompanied by a translation of the pupil, so that accurate compensation of eye rotation requires changes in both the incidence angle before cornea and entry pupil position. To achieve this, we propose the combination of retinal [25] and pupil tracking where the imaging scanners are used to control the angle of incidence before cornea (and therefore OCT scan location at the retinal plane) and the tracking scanner is used to control entry pupil position. Zemax simulations indicate that our system is capable of tracking lateral eye movements of ± 3.5 mm or rotational eye movements of ± 1.2°. This could be extended to compensate for rotational eye movements of up to ± 3.6° if a larger (>71.8 mm diameter) tracking scanner is used.
The directionally sensitive HFL comprises a significant percentage of total retinal thickness but is difficult to visualize directly with OCT. As we and others have shown, HFL back-scattering depends on pupil entry position, resulting in varying ONL and OPL thicknesses as visualized with OCT. To generate more accurate ONL and OPL layer thickness measurements, identification of HFL is necessary and its thickness must be accounted for during segmentation. The present study did not seek to convey average and normal ONL, OPL, or HFL + OPL thickness measurements, which would require a large-scale subject study and careful control of parameters such as refractive error and axial eye length. Additionally, determination of the oblique angle of the HFL arrangement, non-directionality of OPL, and beam angle of incidence would also be required before anatomically accurate HFL + OPL measurements can be derived from OCT images. Instead, our goal was to describe a novel system that may increase efficiency and repeatability of such studies. The simplicity of pupil tracking and incorporation of a tracking scanner makes our approach readily compatible with conventional OCT retinal scanners.
To generate thickness maps, we employed our previously published segmentation algorithm that was designed to segment OPL without considering OCT signal contribution from HLF. When HFL is visible, continuous intensity between HFL and OPL makes individual segmentation of the layers impossible. Varying HFL intensity in the OCT B-scans sometimes necessitated manual correction of the segmentation. We chose to report HFL + OPL thickness because the entire complex was well visualized and segmented at specific pupil entry positions. Alternatively, ONL, and individual HFL and OPL thickness can be derived from our HFL + OPL complex thickness measurements.
Due to the physical separation between the orthogonal imaging scanning mirrors (IS in Fig. 3(A)) in conventional retinal point-imaging systems, the scan pivot is not exactly conjugate to the pupil plane, resulting in small lateral beam displacements at the pupil plane during scanning. These displacements, termed beam wandering, are primarily a concern in adaptive optics retinal imaging for which accurate wavefront measurements at the pupil plane are necessary for aberration compensation [26]. Beam wandering is also a common problem in OCT retinal commercial and research-grade scanners but is often overlooked as long as image quality is adequate. In our system, beam wandering may result in slight uncertainty of the pupil entry position only during volumetric image acquisition. We propose two alternatives to mitigate beam wandering. First, a second afocal telescope could be used to image the two scanning mirrors onto the same plane. Second, since beam wandering is repeatable for a given scan pattern, it could be corrected by using the tracking mirror to offset the beam back to the desired position.
Because the tracking mirror is conjugate to the retinal plane, any optical imperfections on the mirror surface may appear as artifacts in the OCT images. Although we did not observe such artifacts, these may potentially be subtracted from the acquired images since they are static in the OCT image plane.
5. Conclusion
We have presented an automated method for controlling the pupil entry position in retinal OCT by utilizing pupil tracking in conjunction with a 2D fast steering mirror placed conjugate to the retinal plane. Our pupil tracking OCT system prevented lateral motion artifacts and vignetting from obscuring the desired pupil entry location and enabled precise pupil entry positioning and therefore control of the illumination angle of incidence at the retinal plane. We were able to image HFL directly using controlled and repeatable pupil entry positions that allowed identification of HFL + OPL, and anatomically correct OPL and ONL. Lastly, we produced HFL + OPL thickness measurements generated from OCT volumes acquired at different pupil entry positions. Our system may facilitate studies concerning retinal structures that are sensitive to varying illumination angles.
Acknowledgments
The authors would like to thank Liangbo Shen and Ryan McNabb for contributions in initial design and testing. This work was supported by National Institutes of Health/National Eye Institute Biomedical Research Partnership grant #R01-EY023039, the Fitzpatrick Foundation Scholar awarded to DN, and a National Science Foundation Graduate Research Fellowship, Ford Foundation Predoctoral Fellowship and NIH T-32 Training Grant awarded to OC-Z.
References and links
- 1.Swanson E. A., Izatt J. A., Hee M. R., Huang D., Lin C. P., Schuman J. S., Puliafito C. A., Fujimoto J. G., “In vivo retinal imaging by optical coherence tomography,” Opt. Lett. 18(21), 1864–1866 (1993). 10.1364/OL.18.001864 [DOI] [PubMed] [Google Scholar]
- 2.Izatt J. A., Hee M. R., Swanson E. A., Lin C. P., Huang D., Schuman J. S., Puliafito C. A., Fujimoto J. G., “Micrometer-scale resolution imaging of the anterior eye in vivo with optical coherence tomography,” Arch. Ophthalmol. 112(12), 1584–1589 (1994). 10.1001/archopht.1994.01090240090031 [DOI] [PubMed] [Google Scholar]
- 3.Westphal V., Rollins A., Radhakrishnan S., Izatt J., “Correction of geometric and refractive image distortions in optical coherence tomography applying Fermat’s principle,” Opt. Express 10(9), 397–404 (2002). 10.1364/OE.10.000397 [DOI] [PubMed] [Google Scholar]
- 4.Podoleanu A., Charalambous I., Plesea L., Dogariu A., Rosen R., “Correction of distortions in optical coherence tomography imaging of the eye,” Phys. Med. Biol. 49(7), 1277–1294 (2004). 10.1088/0031-9155/49/7/015 [DOI] [PubMed] [Google Scholar]
- 5.Kuo A. N., McNabb R. P., Chiu S. J., El-Dairi M. A., Farsiu S., Toth C. A., Izatt J. A., “Correction of ocular shape in retinal optical coherence tomography and effect on current clinical measures,” Am. J. Ophthalmol. 156(2), 304–311 (2013). 10.1016/j.ajo.2013.03.012 [DOI] [PMC free article] [PubMed] [Google Scholar]
- 6.Stiles W. S., Crawford B. H., “The luminous effeciency of rays entering the eye pupil at different points,” Proc. R. Soc. Lond. 112(778), 428–450 (1933). 10.1098/rspb.1933.0020 [DOI] [Google Scholar]
- 7.Vohnsen B., “Directional sensitivity of the retina: A layered scattering model of outer-segment photoreceptor pigments,” Biomed. Opt. Express 5(5), 1569–1587 (2014). 10.1364/BOE.5.001569 [DOI] [PMC free article] [PubMed] [Google Scholar]
- 8.Gramatikov B. I., Zalloum O. H. Y., Wu Y. K., Hunter D. G., Guyton D. L., “Birefringence-based eye fixation monitor with no moving parts,” J. Biomed. Opt. 11(3), 034025 (2006). 10.1117/1.2209003 [DOI] [PubMed] [Google Scholar]
- 9.Gao W., Cense B., Zhang Y., Jonnal R. S., Miller D. T., “Measuring retinal contributions to the optical Stiles-Crawford effect with optical coherence tomography,” Opt. Express 16(9), 6486–6501 (2008). 10.1364/OE.16.006486 [DOI] [PMC free article] [PubMed] [Google Scholar]
- 10.Knighton R. W., Huang X. R., “Directional and spectral reflectance of the rat retinal nerve fiber layer,” Invest. Ophthalmol. Vis. Sci. 40(3), 639–647 (1999). [PubMed] [Google Scholar]
- 11.Knighton R. W., Baverez C., Bhattacharya A., “The directional reflectance of the retinal nerve fiber layer of the toad,” Invest. Ophthalmol. Vis. Sci. 33(9), 2603–2611 (1992). [PubMed] [Google Scholar]
- 12.Lujan B. J., Roorda A., Knighton R. W., Carroll J., “Revealing Henle’s fiber layer using spectral domain optical coherence tomography,” Invest. Ophthalmol. Vis. Sci. 52(3), 1486–1492 (2011). 10.1167/iovs.10-5946 [DOI] [PMC free article] [PubMed] [Google Scholar]
- 13.Otani T., Yamaguchi Y., Kishi S., “Improved visualization of Henle fiber layer by changing the measurement beam angle on optical coherence tomography,” Retina 31(3), 497–501 (2011). 10.1097/IAE.0b013e3181ed8dae [DOI] [PubMed] [Google Scholar]
- 14.Cense B., Wang Q., Lee S., Zhao L., Elsner A. E., Hitzenberger C. K., Miller D. T., “Henle fiber layer phase retardation measured with polarization-sensitive optical coherence tomography,” Biomed. Opt. Express 4(11), 2296–2306 (2013). 10.1364/BOE.4.002296 [DOI] [PMC free article] [PubMed] [Google Scholar]
- 15.Menghini M., Lujan B. J., Zayit-Soudry S., Syed R., Porco T. C., Bayabo K., Carroll J., Roorda A., Duncan J. L., “Correlation of outer nuclear layer thickness with cone density values in patients with retinitis pigmentosa and healthy subjects,” Invest. Ophthalmol. Vis. Sci. 56(1), 372–381 (2015). 10.1167/iovs.14-15521 [DOI] [PMC free article] [PubMed] [Google Scholar]
- 16.Lujan B. J., Roorda A., Croskrey J. A., Dubis A. M., Cooper R. F., Bayabo J. K., Duncan J. L., Antony B. J., Carroll J., “Directional Optical Coherence Tomography provides accurate outer nuclear layer and Henle fiber layer measurements,” Retina 35(8), 1511–1520 (2015). 10.1097/IAE.0000000000000527 [DOI] [PMC free article] [PubMed] [Google Scholar]
- 17.VanNasdale D. A., Elsner A. E., Peabody T. D., Kohne K. D., Malinovsky V. E., Haggerty B. P., Weber A., Clark C. A., Burns S. A., “Henle fiber layer phase retardation changes associated with age-related macular degeneration,” Invest. Ophthalmol. Vis. Sci. 56(1), 284–290 (2015). 10.1167/iovs.14-14459 [DOI] [PMC free article] [PubMed] [Google Scholar]
- 18.Elsner A. E., Cheney M. C., Vannasdale D. A., “Imaging polarimetry in patients with neovascular age-related macular degeneration,” Int. J. Light Electron Opt. 24, 1468–1480 (2007). [DOI] [PMC free article] [PubMed] [Google Scholar]
- 19.Miura M., Yamanari M., Iwasaki T., Elsner A. E., Makita S., Yatagai T., Yasuno Y., “Imaging polarimetry in age-related macular degeneration,” Invest. Ophthalmol. Vis. Sci. 49(6), 2661–2667 (2008). 10.1167/iovs.07-0501 [DOI] [PMC free article] [PubMed] [Google Scholar]
- 20.Roig A. B., Morales M., Espinosa J., Perez J., Mas D., Illueca C., “Pupil detection and tracking for analysis of fixational eye micromovements,” Int. J. Light Electron Opt. 123(1), 11–15 (2012). 10.1016/j.ijleo.2010.10.049 [DOI] [Google Scholar]
- 21.Barbosa M., James A. C., “Joint iris boundary detection and fit: a real-time method for accurate pupil tracking,” Biomed. Opt. Express 5(8), 2458–2470 (2014). 10.1364/BOE.5.002458 [DOI] [PMC free article] [PubMed] [Google Scholar]
- 22.Sahin B., Lamory B., Levecq X., Harms F., Dainty C., “Adaptive optics with pupil tracking for high resolution retinal imaging,” Biomed. Opt. Express 3(2), 225–239 (2012). 10.1364/BOE.3.000225 [DOI] [PMC free article] [PubMed] [Google Scholar]
- 23.Goncharov A. V., Dainty C., “Wide-field schematic eye models with gradient-index lens,” J. Opt. Soc. Am. A 24(8), 2157–2174 (2007). 10.1364/JOSAA.24.002157 [DOI] [PubMed] [Google Scholar]
- 24.Chiu S. J., Li X. T., Nicholas P., Toth C. A., Izatt J. A., Farsiu S., “Automatic segmentation of seven retinal layers in SDOCT images congruent with expert manual segmentation,” Opt. Express 18(18), 19413–19428 (2010). 10.1364/OE.18.019413 [DOI] [PMC free article] [PubMed] [Google Scholar]
- 25.Vienola K. V., Braaf B., Sheehy C. K., Yang Q., Tiruveedhula P., Arathorn D. W., de Boer J. F., Roorda A., “Real-time eye motion compensation for OCT imaging with tracking SLO,” Biomed. Opt. Express 3(11), 2950–2963 (2012). 10.1364/BOE.3.002950 [DOI] [PMC free article] [PubMed] [Google Scholar]
- 26.Dubra A., Sulai Y., “Reflective afocal broadband adaptive optics scanning ophthalmoscope,” Biomed. Opt. Express 2(6), 1757–1768 (2011). 10.1364/BOE.2.001757 [DOI] [PMC free article] [PubMed] [Google Scholar]


