

Abstract
Objective
HIV-associated neurocognitive disorders (HAND) remain a challenge despite combination antiretroviral therapy (cART). Immune cell activation has been implicated to play a major role in the development of HAND.
Methods
In this study, we used multicolor flow cytometry on peripheral blood (PB) and cerebrospinal fluid (CSF) samples to determine the expression of HLA-DR and programmed death-1 (PD-1) on CD4+ and CD8+ T cells in patients with chronic HIV infection. Expression levels were correlated with HI virus load in PB and CSF, classification of HAND and severity of magnetic resonance imaging (MRI) signal abnormalities.
Results
In a cohort of 86 HIV patients we found that the grade of neurocognitive impairment and the severity of MRI signal abnormalities correlated with decreasing CD4/CD8-ratios and increased frequencies of HLA-DR expressing CD4+ and CD8+ T cells reaching the highest values in the CSF samples. Importantly, HLA-DR upregulation was still detectable in virologically suppressed HIV patients. Further, T-cell subpopulation analysis of 40 HIV patients showed a significant shift from naïve to effector memory (EM) T cells that was negatively correlated with the grade of neurocognitive impairment in the PB samples. Moreover, PD-1 was significantly increased on CD4+ memory T cells with highest levels on EM T cells in HIV patients with mild or severe neurocognitive alterations.
Interpretation
The CD4/CD8 ratio, the proportion of EM to naïve T cells and the immune activation profile of CD4+ and CD8+ T cells in PB and CSF might be useful parameters to monitor the efficacy of cART and to identify HIV patients at risk of further neurocognitive deterioration.
Introduction
HIV-associated neurocognitive disorders (HAND) are still a major challenge in chronic HIV infection.1,2 The diagnosis of HAND is currently based on abnormal performance on neuropsychological testing and the presence or absence of functional limitations related to cognitive impairment. Three levels of HAND have been defined: asymptomatic neurocognitive impairment (ANI), mild neurocognitive disorder (MND), and HAD (HIV-associated dementia).3 HAND typically present as a subcortical dementia with cognitive, behavioral, and motor decline over weeks or months, which interferes with activities of daily living and cannot be explained by another preexisting neurological disease, severe substance abuse, or another cause of dementia.4,5 Standard magnetic resonance imaging (MRI) has been shown to be a sensitive diagnostic tool in the investigation and management of HIV-related central nervous system (CNS) disorders and we could recently show that typical white matter lesions correlate with neurocognitive deficits in HIV-infected patients.6 Volumetric MR techniques and diffusion tensor imaging measures could be used as additional tools to monitor disease progression of HIV patients.7
Although severe cognitive disorders rarely occur in patients effectively treated with combination antiretroviral therapy (cART, plasma HIV RNA <50 copies/mL), more subtle forms of cognitive impairment are present in about 50% of long-term survivors with treated HIV infection.8–10 A low CD4 nadir has been identified as an important predictor of neurocognitive impairment in HIV patients.11 However, in the cART era, HIV disease markers such as HIV load and CD4 cell counts are no longer closely associated with ongoing neurocognitive impairment in HIV patients on treatment.
There is growing evidence that multiple factors are involved in the development or persistence of neurocognitive dysfunctions in cART-suppressed patients that include the failure of cART to completely suppress HIV replication within the CNS, the occurrence of HIV variants with distinct resistance profiles and potential antiretroviral CNS toxicity.12,13 This probably leads to an ongoing, slowly progressing process of brain infection, inflammation and injury which is reflected by the persistence of intrathecal IgG-synthesis, elevated cerebrospinal fluid (CSF) neopterin levels, and increased immune activation markers such as interleukin 6, TNF-α, CCL2/MCP-1, sIL-2R, sCD14, or sCD163.14–20
Nonetheless, additional biomarkers are needed that could identify a population at risk of developing neurocognitive dysfunctions or that could monitor the efficacy of treatment to improve the outcome and optimize quality of life of HIV patients. In this study, we determined the frequency and immune activation status of CD4+ or CD8+ T-cell subpopulations in peripheral blood (PB) and CSF in correlation with HI virus load, the grade of neurocognitive dysfunction and the severity of MRI signal abnormalities in cART-treated HIV patients by multicolor flow cytometry.
Material and Methods
Standard protocol approvals, registrations and patient consents
Patients were recruited at the Department of Neurology at the University Hospital Muenster, Germany from 2012 until 2014. All experiments were carried out according to the Declaration of Helsinki and were approved by the ethical committee of the University of Münster Medical School (2010-262-f-S). All patients consented to the scientific use of their biosamples, which were all primarily obtained for routine diagnostic workup.
Clinical parameters
The clinical evaluation consisted of medical history, standardized neurologic examination and a neuropsychological assessment for the presence of HAND. All participants were tested with a standard neuropsychological test battery assessing six cognitive domains: speed of information processing, executive function, learning, memory, motor, and verbal function. Patients were classified according to the “Frascati” criteria.3 In brief, patients with HIV-associated ANI not interfering with everyday functioning were graded with 1, patients with HIV-associated MND with mild interference in daily functioning were graded with 2, and patients with HAD with marked interference with day-to-day functioning were graded with 3. HIV patients with a normal test performance were graded with 0.
CSF and blood samples
HIV patients underwent a lumbar puncture to obtain CSF and ethylenediaminetetraacetic acid (EDTA) blood was taken at the same time. As a control, blood and CSF was analyzed from patients with suspected presence of a neurologic disorder but who suffered from a somatization disorder in retrospective. Patients included in the control group also fulfilled the following laboratory criteria defining a noninflammatory CSF: <5 cells/mL, <500 mg protein/mL, <2 mmol/L lactate, no disruption of the blood–brain and/or -CSF barrier, no intrathecal immunoglobulin synthesis, no oligoclonal bands in the CSF. HIV ribonuclein acid levels (copies per microliter) were analyzed with a Cobas Amplicor HIV Monitor Test (Roche, Basel, Switzerland).
Multiparameter flow cytometry
CSF samples were collected in polypropylene tubes and were processed within 20 min. Cells were obtained from EDTA blood by erythrocyte lysis using VersaLyse buffer (Beckman Coulter, Krefeld, Germany) following the manufacturer's instructions. Cells were obtained from CSF by centrifugation (15 min, 290g, 4°C) and incubation in VersaLyse buffer. Cells were stained for 30 min at 4°C using the following fluorochrome-conjugated antibodies: CD14-FITC, CD138-PE, HLA-DR-ECD, CD3-PC5.5, CD56-PC7, CD4-APC, CD19-APCAlexafluor700, CD16-APCAlexafluor750, CD8-PacificBlue, and CD45-KromeOrange (all Beckman Coulter). T-cell subpopulations were further analyzed using the following fluorochrome-conjugated antibodies: CD45RA-FITC, CD27-PE, CD3-ECD, CCR7-PC5.5, CD25-PC7, CD56-APC, CD127-APCAlexafluor700, CD62L-APCAlexafluor750 or PD1-APCAlexafluor750, CD8-PacificBlue, and CD4-KromeOrange (obtained from Beckman Coulter or Ebioscience, Frankfurt, Germany). After washing, all samples were analyzed using the Navios™ flow cytometer (Beckman Coulter, Germany). The gating strategy to determine HLA-DR expression on CD4+ and CD8+ T cells and CD4+ and CD8+ T-cell subpopulations are described in Figures S1 and S2.
MRI procedure
All MRI examinations were performed with a 1.5-T clinical imaging system (Gyroscan Intera®; Philips Medical Systems, Best, the Netherlands) using a synergy head neck coil. Axial T1-weighted spin-echo (SE), T2-weighted fast SE (FSE), and fluid-attenuated inversion recovery FSE sequences were obtained. Cerebral signal abnormalities in MRI of HIV-infected patients were evaluated as described previously.21,22 In brief, the pattern of signal abnormalities was graded as none (score 0), multifocal (score 1) and diffuse (score 2) and the severity of signal abnormalities within the periventricular white matter and the basal ganglia was graded as none (score 0), mild (<25% involvement, score 1), moderate (25–75% involvement, score 2), and severe (>75% involvement, score 3). As a result, a maximum score of 5 could be obtained.
Statistics
The data were analyzed with the Kolmogorov–Smirnov procedure to test for normal distribution. Because not all patient groups showed a normal distribution, the following nonparametric tests were used: The two-tailed Mann–Whitney test was used to test for significant differences between two groups. The Kruskal–Wallis test with post hoc Dunn Multiple Comparison analysis was applied to test for significant differences between three and more groups. For correlation analysis, we used the Spearman rank test. Values of P < 0.05 were considered to be significant. GraphPad Prism 5.0 GraphPad Software, Inc.La Jolla, USA was used for statistical analyses.
Results
Patient characteristics
Between 2012 and 2014 we recruited 86 subjects (male = 71, female = 15) with a median age of 49 years (range 19–72 years). Subject demographic and treatment data are presented in Table1. The majority (89%) of subjects were on cART. The median time since diagnosis of HIV-infection was 13 years (1–27 years). Most subjects had suppressed HIV RNA (<37 copies/mL) in blood (69.8%) and CSF (75.6%). The median CD4+/CD8+ T-cell ratio was 0.6 (0.1–2.8) with 25.6% of the subjects achieving a CD4+/CD8+ T-cell ratio >1. CD4 T-cell counts were 552 (3–1327) cells/μL and CD8 T-cell counts were 898 (70–2431) cells/μL. The control group comprised 17 subjects with a median age of 45 years (range 23–59 years).
Table 1.
Demographic and HIV-related data of the study population
| Number of patients (n) | 86 |
| Gender (male:female) | 71:15 |
| Median age (years) | 49 (range 19–72) |
| Median duration of HIV-infection (years) | 13 (range 1–27) |
| cART (%) | 89 |
| Median CD4+ cell/μL | 552 (range 3–1327) |
| Median CD8+ cell/μL | 898 (range 70–2431) |
| Median T4/T8 ratio (PB) | 0.6 (range 0.1–2.8) |
| Patients with T4/T8 ratio >1 PB (%) | 25.6 |
| Median HIV RNA copies/mL (PB) | nnw (range 0–135.000) |
| Median HIV RNA copies/mL (L) | nnw (range 0–418.000) |
| Patients with HI VL <37 copies/mL PB (%) | 69.8 (26/86) |
| Patients with HI VL <37 copies/mL L (%) | 75.6 (21/86) |
| HAND classification | Number of patients (n) | Controlled VL PB (%) | Controlled VL CSF (%) |
|---|---|---|---|
| Grade 0 | 11 | 81.8 (09/11) | 90.9 (10/11) |
| Grade 1 | 25 | 76.0 (19/25) | 63.6 (07/11) |
| Grade 2 | 37 | 64.9 (24/37) | 64.9 (24/37) |
| Grade 3 | 13 | 61.5 (08/13) | 76.9 (10/13) |
PB, peripheral blood; VL, virus load; HAND, HIV-associated neurocognitive disorders; CSF, cerebrospinal fluid.
The grade of neurocognitive impairment of HIV patients was associated with decreasing CD4/CD8-ratios in PB and CSF
PB and CSF samples of control and HIV patients were examined with a panel of fluorochrome-conjugated antibodies as described previously23 and in Figure S1. Flow cytometric analyses showed that the frequency of CD45+ lymphocytes, CD3+56− T cells, CD3−CD56+ NK cells and CD3+CD56+ NKT cells was not different between control and HIV patients (Fig.1A). As expected, further T-cell analyses revealed a significant decrease in the frequency of CD4+ T cells and a significant increase in the frequency of CD8+ T cells both in PB and CSF samples of HIV patients resulting in a substantial decrease in the CD4/CD8 ratios. In addition, we correlated the CD4/CD8 ratio with the grade of neurocognitive impairment in HIV patients. HAND was classified according to the “Frascati” criteria and graded from 0 to 3 as mentioned in Material and Methods (2.2.). Subsequent analyses showed that the grade of neurocognitive impairment correlated with an increasing CD4/CD8 inversion both in PB and CSF, most prominently in HIV patients with severe neurocognitive alterations (grade 3) (Fig.1B).
Figure 1.
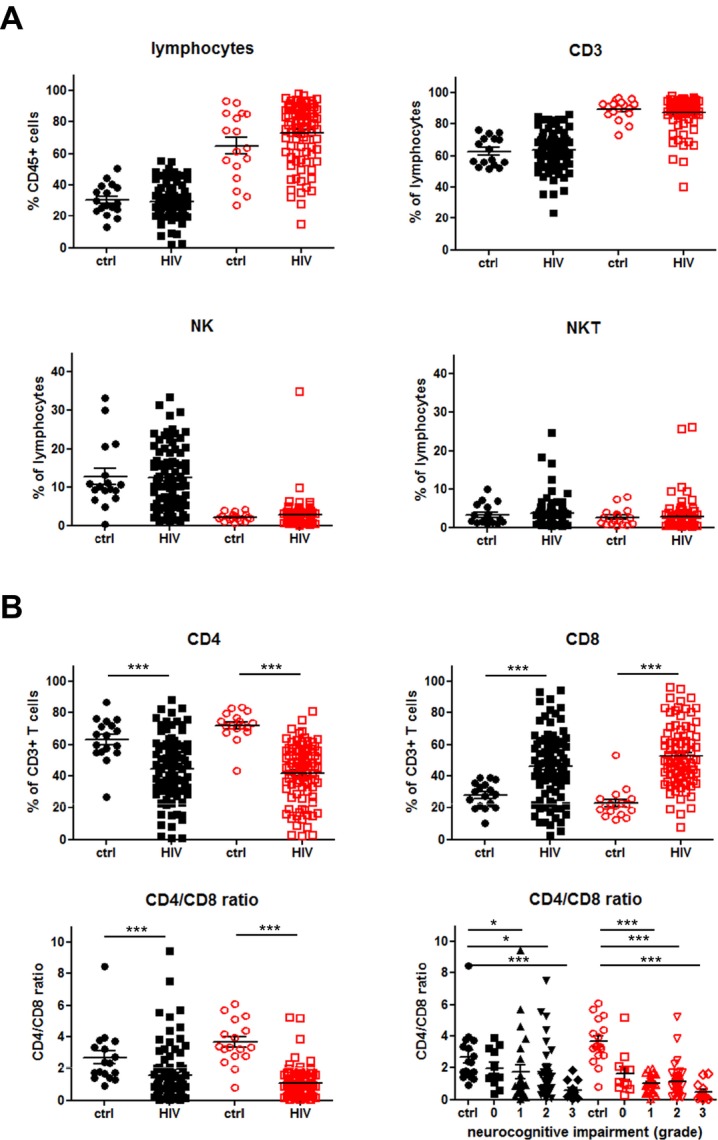
Immune profile of lymphocytes in the peripheral blood (PB) and cerebrospinal fluid (CSF). (A) Proportions of CD45+ lymphocytes, CD3+ T cells (CD3+CD56−), NK cells (CD3−CD56+) and NKT cells (CD3+CD56+) within PB (black symbols) and CSF (red symbols) of control (ctrl, n = 17; closed circles and squares) and HIV patients (HIV,n = 86; open circles and squares) were determined by multicolor flow cytometry as described in Figure S1. (B) Proportions of CD4+ T cells (CD3+CD56−CD4+) and CD8+ T cells (CD3+CD56−CD8+) as well as CD4/CD8 ratio within PB and CSF of control and HIV patients are shown. In addition, CD4/CD8 ratios within PB and CSF according to the grade of neurocognitive impairment are depicted (vertical scatter plot, mean with SEM). P values were calculated using Mann–Whitney test for comparison of two groups, and Kruskal–Wallis test with post hoc Dunn Multiple Comparison analysis for the comparison of three and more groups). Asterisks denote different P values: *P < 0.05; ***P < 0.0001. For detailed statistics see Table S1A and B.
The grade of neurocognitive impairment and MRI signal abnormalities were associated with an increased HLA-DR expression on CD4+ and CD8+ T cells in PB and CSF of HIV patients
Next, we investigated whether CD4+ and CD8+ T cells in PB and CSF samples of HIV patients expressed the immune activation marker HLA-DR. Figure2A shows that HLA-DR was significantly upregulated on CD4+ and CD8+ T cells not only in PB, but particularly in CSF of HIV patients when compared to the control group. Further analyses revealed that the frequency of HLA-DR-positive CD4+ and CD8+ T cells correlated with the virus load with the highest values in PB and CSF samples of HIV patients with a detectable HI virus load (>37 copies/mL). Interestingly, an upregulation of HLA-DR expression could also be detected on CD4+ and CD8+ T cells in PB and CSF samples of HIV patients with a suppressed HI virus load (<37 copies/mL) which made up about 70% of the study population (Fig.2B). We then assessed whether there was a correlation between HLA-DR expression on CD4+ and CD8+ T cells and the grade of neurocognitive impairment in virologically suppressed HIV patients. Figure2C shows that the percentages of HLA-DR expressing CD4+ and CD8+ T cells continuously increased with the grade of neurocognitive impairment reaching the highest values in PB and CSF samples of HIV patients with severe neurocognitive alterations. Moreover, HLA-DR expression levels on CD4+ and CD8+ T cells also differed significantly between HIV patients with normal cognitive function or asymptomatic neurocognitive deficits (grade 0 or 1) and HAD (grade 3) further demonstrating that persistent immune activation contributes to the neurocognitive impairment in HIV patients.
Figure 2.

HLA-DR expression on CD4+ and CD8+ T cells. (A) The expression of HLA-DR on CD4+ and CD8+ T cells within PB (black symbols) and CSF (red symbols) of control (ctrl, n = 17; closed circles and squares) and HIV-patients (HIV,n = 86; open circles and squares) were evaluated by flow cytometry. (B) Graphs showing the percentage of HLA-DR-positive CD4+ and CD8+ T cells within PB (closed black symbols) and CSF (open red symbols) of control and HIV-patients according to the virus load (none, <37 copies/mL, >37 copies/mL). P values were calculated using Mann–Whitney test. Asterisks denote different P values: *P < 0.05; **P < 0.01; ***P < 0.0001. (C) Graphs showing the percentage of HLA-DR-positive CD4+ and CD8+ T cells in PB (closed symbols) and CSF (open symbols) of control and virologically suppressed HIV-patients according to the grade of neurocognitive impairment (grade 0–3) and the severity of MRI signal abnormalities (score 0–5). P values were calculated using Mann–Whitney test for comparison of two groups, and Kruskal–Wallis test with post hoc Dunn Multiple Comparison analysis for the comparison of three and more groups. Asterisks denote different P values: *P < 0.05; **P < 0.01; ***P < 0.0001. For detailed statistics see Table S2A–C. PB, peripheral blood; CSF, cerebrospinal fluid; MRI, magnetic resonance imaging.
In addition, we asked the question whether HLA-DR expression on CD4+ and CD8+ T cells was associated with the severity of MRI signal abnormalities in HIV patients with undetectable virus in PB or CSF. MRI signal abnormalities were scored as mentioned in Material and Methods (2.5.). As depicted in Figure2C, the frequency of HLA-DR expressing CD4+ T cells was mainly increased in PB and CSF samples of HIV patients with MRI signal abnormalities scores of 2–3 and 4–5. A significant HLA-DR upregulation could also be detected on CD8+ T cells in PB samples of HIV patients with severe MRI signal abnormalities scores of 4–5, whereas the frequency of HLA-DR expressing CD8+ T cells was only slightly elevated in CSF samples of HIV patients when compared with the control group.
The proportion of EM to naïve CD4+ and CD8+ T cells negatively correlated with the grade of neurocognitive impairment in HIV patients
In 40 HIV patients, we could perform additional analyses for CD4+ and CD8+ T-cell subpopulations in blood and CSF samples as described in Figure S2: naive T cells (naive, CCR7+CD45RA+), central memory T cells (CM, CCR7+CD45RA−), effector memory T cells (EM, CCR7−CD45RA−), and terminal differentiated EM T cells (TEMRA, CCR7−CD45RA+). As shown in Figure3A, the proportion of naïve CD4+ and to a lesser extent of CD4+ TEMRA in PB was significantly reduced in HIV patients, whereas the proportion of EM and CM CD4+ T cells was significantly increased compared to the control group. In CSF samples, EM and CM T cells did not differ significantly between control and HIV patients, whereas the difference of naïve CD4+ T cells and CD4+ TEMRA reached statistical significance between both subjects. Similar to CD4+ T cells, the proportion of naïve CD8+ T cells in PB was significantly reduced in HIV patients, whereas the proportion of EM CD8+ T cells was significantly increased compared to the control group. However, the frequency of CM CD8+ T cells and CD8+ TEMRA did not differ significantly between controls and HIV patients. In CSF samples, we could also not detect any significant differences between the CD8+ T-cell subpopulations (Fig.3B).
Figure 3.

Distribution of CD4+ and CD8+ T-cell subpopulations within PB (black symbols) and CSF (red symbols) (n = 40; closed circles and squares) of control and HIV patients. The four defined subpopulations were identified by multicolor parametric flow cytometry as described in Figure S2: Naïve (CCR7+/CD45RA+), CM = central memory (CCR7+/CD45RA-), EM = effector memory (CCR7−/CD45RA−) and TEMRA = terminal differentiated effector memory (CCR7−/CD45RA+) T cells (AB) Proportions of each CD4+ (A) and CD8+ (B) T-cell subsets within PB (ctrl, n = 18; closed circles and squares) and CSF (HIV,n = 40; open circles and squares) are shown. P values were calculated using Mann–Whitney test for comparison of two groups, and Kruskal–Wallis test with post hoc Dunn Multiple Comparison analysis for the comparison of three and more groups. Asterisks denote different P values: *P < 0.05; **P < 0.01; ***P < 0.0001. For detailed statistics see Table S3A and B. PB, peripheral blood; CSF, cerebrospinal fluid.
On the basis of these results, we further analyzed the correlation between the proportion of naïve and EM T cells within the blood CD4+ and CD8+ T-cell compartment. As shown in Figure4A, the frequency of EM CD4+ and CD8+ T cells negatively correlated with the frequency of naïve CD4+ and CD8+ T cells in HIV patients in contrast to control patients. Moreover, we correlated the frequency of naïve and EM CD4+ and CD8+ T cells with the extent of neurocognitive dysfunctions in HIV patients. As depicted in Figure4B, a substantial negative correlation between the proportion of EM to naïve CD4+ and CD8+ T cells could be detected in symptomatic HIV patients with mild or severe neurocognitive impairment (grade 2–3) when compared to control or HIV patients with normal cognitive function or asymptomatic neurocognitive deficits (grade 0–1).
Figure 4.

(A) Correlations between the proportion of CD4+ and CD8+ TEM cells and naïve CD4+ and CD8+ T cells within PB of control and HIV patients. (B) Correlations between the proportion of CD4+ and CD8+ TEM cells and naïve CD4+ and CD8+ naïve T cells within peripheral blood of control and HIV patients according to the grade of neurocognitive impairment (grade 0–1 and grade 2–3). All r and P values correspond to Spearman's test.
PD-1 was significantly increased on CD4+ EM T cells in blood of HIV patients with neurocognitive dysfunctions
With the knowledge of an increased T-cell activation and a shift from naïve to EM CD4+ and CD8+ T cells in HIV patients, we next asked the question whether the inhibitory programmed death-1 receptor (PD-1) that has been associated with T-cell exhaustion in chronically virus-infected T cells was upregulated on different T-cell subpopulations in PB of HIV patients. Flow cytometric analysis revealed that PD-1 was significantly increased on CD4+, but not CD8+ T cells in PB of HIV patients when compared to the control group (Fig.5A). Further analyses showed that PD-1 expression was significantly increased on CD4+ memory cells with highest levels on CD4+ EM cells (Fig.5B). Regarding neurocognitive dysfunctions, subsequent analyses disclosed that the percentages of PD-1-expressing CD4+ memory T cells were increased in HIV patients with highest proportions of PD-1-expressing CD4+ EM T cells in PB of symptomatic HIV patients with mild or severe neurocognitive dysfunctions (grade 2–3) (Fig.5C).
Figure 5.
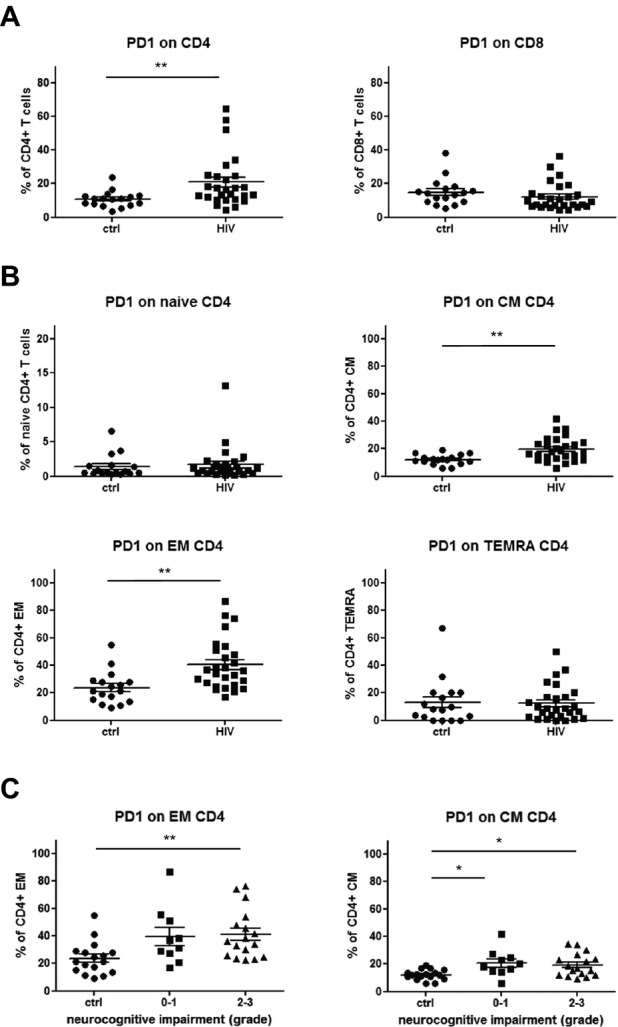
PD-1+ expression on CD4+ and CD8+ T-cell subsets. (A) PD-1 expression was determined in T cells from control (ctrl, n = 17; closed circles) and HIV patients (HIV,n = 27; closed squares) by flow cytometry. (A) Graphs comparing the percentage of PD1+ cells within CD4+ and CD8+ T cells in control and HIV-patients. (B) Graphs showing percentages of PD1+ cells on different CD4+ T-cell subsets from control and HIV patients, respectively. (C) Scatter plots illustrating the analysis of PD-1+ cells in relation to the grade of neurocognitive impairment in HIV patients (grade 0–1 and grade 2–3). P values were calculated using Mann–Whitney test for comparison of two groups, and Kruskal–Wallis test with post hoc Dunn Multiple Comparison analysis for the comparison of three and more groups. Asterisks denote different P values: *P < 0.05; **P < 0.01. For detailed statistics see Table S4A–C.
Discussion
HAND are still a serious complication of the central nervous system in HIV-infected patients. Although cART has a proven beneficial impact on the incidence and prevalence of severe forms of HAND, some patients with HIV continue to experience neurocognitive deterioration despite effective antiretroviral treatment.1,2 Therefore, useful biomarkers are needed that are helpful in identifying HIV patients at risk of further deterioration of neurocognitive dysfunctions in order to improve their outcome and optimize quality of life.24,25
There is growing evidence that a low CD4/CD8 ratio is associated with an increased risk of non-AIDS-related morbidity and mortality in virally suppressed HIV-infected patients.26,27 In accordance with these observations, we found that decreasing CD4/CD8-ratios both in PB and CSF strongly correlated with the grade of neurocognitive impairment in HIV patients on cART. These data suggest that HIV patients with a lower CD4/CD8 ratio have a higher likelihood to develop more severe neurocognitive dysfunctions than HIV patients with higher CD4/CD8 ratio despite cART. Moreover, this observation could be of practical relevance, because a normalization of the CD4/CD8 ratio usually does not occur and the CD4/CD8 ratio remains low in a substantial proportion of HIV patients with increased CD4+ T-cell counts under effective antiretroviral therapy.28,29
Additional analysis of T-cell subpopulations in our study revealed significant lower frequencies of naive CD4+ and CD8+ T cells and increased frequency of EM CD4+ and CD8+ T cells in PB of HIV patients when compared to control patients. These results are in line with previous investigations which showed a maturation arrest and accumulation of EM T cells in chronically HIV-infected patients.30,31 In addition, Tinago et al. recently demonstrated a positive correlation between a higher percentage of naıve T cells and a more normal immune phenotype as suggested by a higher CD4/CD8 ratio in a cohort of patients on effective cART.32 In contrast to PB, CSF samples were dominated by a high frequency of effector and memory T cells which did not significantly differ between control and HIV patients. This predominance of EM T cells within the CSF might be explained by an enhanced migratory capacity through the blood–brain barrier.33 More interestingly, our data indicate that a skewed T-cell phenotype from naive to EM T cells within PB is strongly associated with the extent of neurocognitive dysfunctions in HIV patients. This also points toward a major role of naïve T cells in controlling immune responses and the process of neurocognitive deterioration in HIV-infected patients. Numerous experimental studies have shown that immune responses to viral infections are better with an enhanced naïve T-cell pool filled with a greater repertoire of viral-specific epitopes when compared with the memory T-cell pool.34
Previously, it has been clearly demonstrated that the CD4/CD8 ratio is independently associated with the activation of CD4+ and CD8+ T cells despite long-term viral suppression.35,36 Consistent with these results, we also observed an increased frequency of activated HLA-DR-expressing CD4+ or CD8+ T cells in PB and CSF samples from HIV patients that strongly correlated with the extent of neurocognitive dysfunctions and the severity of MRI signal abnormalities in our study population. Importantly, HLA-DR upregulation could still be detected both in PB and CSF samples from virologically suppressed HIV patients. Moreover, comparing PB and CSF, higher values of HLA-DR expression were determined on CD4+ and CD8+ T cells in CSF samples from HIV patients. Although not directly shown, we assume that HLA-DR molecules are mainly upregulated on effector and CM CD4+ and CD8+ T cells, because these populations made up the majority of T cells obtained from CSF (see Tables S3A and B).
All together, these data confirm that persistent immune activation, particularly in the CNS compartment, is involved in the neuropsychological decline of HIV patients and the development of MRI signal abnormalities despite cART. These data also indicate that it is not sufficient to only suppress the virus load below the detection level, but also to inhibit virus replication which might prevent chronic immune cell activation. Strong evidence for that comes from a recent study showing that HLA-DR expression was not increased on CD4+ and CD8+ T cells in blood of HIV elite controllers, but not in cART-controlled HIV patients.37
Additionally, these data raise the important question about the mechanisms that are responsible for an ongoing immune activation in the CNS in the setting of long-term, systemically effective cART. There are strong indications that cART regimens are not able to completely stop HIV replication in the CNS, especially within long-lived cells such as tissue macrophages, microglia, and astrocytes due to reduced CNS penetration and drug exposure.2,38 This is supported by brain tissue analysis at post mortem with detection of HIV RNA or DNA in these cell types and abnormal levels of activation.13,39 Besides that, even when cART successfully suppressed CSF HIV RNA below detectable levels, viral escape in the CSF has been observed in up to 10% of HIV patients. Alternatively, low-level viremia of HIV variants with distinct resistance profiles might be present in the CNS during chronic infections that cannot be eliminated by current cART regimens supporting the concept of CNS compartmentalization of HIV species.40,41
Another important mechanism in viral escape includes the selective functional silencing or elimination of virus-specific T cells. It is well-known that chronic viral infections with continuous presentation of viral proteins to the immune system can lead to T-cell exhaustion.42 One of the key features of T-cell exhaustion with loss of proliferative capacity, INF-γ production and cytotoxic potential is a prolonged and/or high expression of inhibitory receptors such as PD-1.43,44 Moreover, there is growing evidence that PD-1 might play a role as a key regulator of memory cell differentiation and survival.45 In our study, we could show that CD4+, but not CD8+ T cells obtained from PB of HIV patients significantly upregulated PD-1. In addition, PD-1 expression was significantly increased on CD4+ memory cells with highest levels on CD4+ EM cells. The expression levels of PD-1 expression were most prominent on CD4+ memory T cells obtained from PB of symptomatic HIV patients with mild or severe neurocognitive dysfunctions, but PD-1 expression levels were also increased on CD4+ memory T cells from asymptomatic HIV patients with neurocognitive deficits that do not interfere with everyday functioning. These data suggest that PD-1-expressing CD4+ memory T cells in chronic HIV infections might be exhausted and might notably participate in the development of neurocognitive deficits in HIV patients despite cART.46,47 In this context, it might be also interesting to evaluate whether PD-1 upregulation on memory CD4+ T cells is associated with a loss of virus-specific CD8+ T cell responses.48 As many other cell surface inhibitory receptors coregulate T-cell exhaustion,42,49 we also looked for TIM-3 expression on CD4+ or CD8+ T-cell subpopulations, but could not detect a significant upregulation in PB and CSF samples of HIV patients when compared with a control group (data not shown).
In summary, our study underlines that the extent of CD4/CD8 inversion with a shift from naïve to EM T cells and the magnitude of immune activation of CD4+ or CD8+ T cells, predominantly in the CSF, is associated with a higher degree of neurocognitive dysfunctions in HIV patients. We believe that these findings have potential clinical implications, since patients with a low CD4/CD8 ratio and a skewed T-cell differentiation despite achieving full immunovirological response to cART might be at potential risk of developing neurocognitive deterioration and should be carefully monitored. This should include regularly analysis of the HIV virus load and testing for HIV variants in PB and CSF. Analysis of immune activation markers such as HLA-DR and PD-1 could be used to adapt cART using regimens with high CNS penetration effectiveness. Moreover, this study highlights that further strategies are necessary to prevent the development of neurocognitive dysfunctions in HIV patients, for example, the reconstitution of the naïve T-cell pool and a reprogramming of CD4+ memory T cells. Strategies could include the combined administration of PD-1 and/or cytokine blocking antibodies to enhance immunity during chronic HIV infections as was previously shown.31,50
Acknowledgments
We thank Verena Schütte, Kerstin Gottschalk, and Schumina Säuberlich for excellent technical assistance, and Stefanie Henkel and Laura Hebold for maintaining the clinical database.
Conflict of Interest
None declared.
Supporting Information
Tables S1–S4. Detailed statistical analyses of the data presented.
Figure S1. Gating strategy to determine HLA-DR-positive CD3+CD56−CD4+ and CD8+ T cells and CD3+CD56+ NKT cells in PB and CSF. Cells derived from the peripheral blood (PB; 1st row) and cerebrospinal fluid (CSF; 2nd row) were stained using fluorochrome-labeled antibodies directed against the linage markers CD45 (leukocytes), CD14 (monocytes), CD3 (T cells), CD56 (NK cells), CD4 (CD4+ T cells), and CD8 (CD8+ T cells) and the activation marker HLA-DR and analyzed by multiparameter cytometry. CD45+ leukocytes were selected in a CD45 versus forward scatter channel (FSC) plot. CD45+ cells were then displayed in a CD14 versus sideward scatter channel (SSC) plot to identify CD14- lymphocytes. To distinguish between CD3−CD56+ NK cells, CD3+CD56+ NKT cells and CD3+CD56− T cells, lymphocytes were further displayed in a CD3 versus CD56 plot. CD3+CD56− T cells were further split into CD4+ and CD8+ T cells and the percentage of HLA-DR-positive CD4+ T cells and CD8+ T cells was analyzed, respectively. HLA-DR-positive CD3+CD56+ NKT cells were analyzed in a similar manner. Resulting quadrant gates were analyzed postprocessing using Kaluza 1.2 Software (Beckman Coulter).
Figure S2. Gating strategy to determine CD4+ and CD8+ T-cell subsets in PB and CSF. Lymphocytes were selected in a side scatter channel (SSC) versus forward scatter channel (FSC) plot. Lymphocytes were then displayed in a CD3 versus CD56 plot. CD3+CD56− T cells were further split into CD4+ and CD8+ T cells. CD4+ and CD8+ T cells subsets were defined using the following co-expression of markers: Naive (naive, CCR7+CD45RA+), central memory (CM, CCR7+CD45RA−), effector memory (EM, CCR7−CD45RA−) and terminal differentiated effector (TEMRA, CCR7−CD45RA+) T cells. Resulting quadrant gates were analyzed postprocessing using Kaluza 1.2 Software (Beckman Coulter).
References
- Clifford DB, Ances BM. HIV-associated neurocognitive disorder. Lancet Infect Dis. 2013;13:976–986. doi: 10.1016/S1473-3099(13)70269-X. [DOI] [PMC free article] [PubMed] [Google Scholar]
- Spudich S. HIV and neurocognitive dysfunction. Curr HIV/AIDS Rep. 2013;10:235–243. doi: 10.1007/s11904-013-0171-y. [DOI] [PMC free article] [PubMed] [Google Scholar]
- Antinori A, Ammassari A, De Luca A, et al. Diagnosis of AIDS-related focal brain lesions: a decision-making analysis based on clinical and neuroradiologic characteristics combined with polymerase chain reaction assays in CSF. Neurology. 1997;48:687–694. doi: 10.1212/wnl.48.3.687. [DOI] [PubMed] [Google Scholar]
- McArthur JC, Hoover DR, Bacellar H, et al. Dementia in AIDS patients: incidence and risk factors. Multicenter AIDS Cohort Study. Neurology. 1993;43:2245–2252. doi: 10.1212/wnl.43.11.2245. [DOI] [PubMed] [Google Scholar]
- McArthur JC, Selnes OA, Glass JD, et al. HIV dementia. Incidence and risk factors. Res Publ Assoc Res Nerv Ment Dis. 1994;72:251–272. [PubMed] [Google Scholar]
- Steinbrink F, Evers S, Buerke B, et al. Cognitive impairment in HIV infection is associated with MRI and CSF pattern of neurodegeneration. Eur J Neurol. 2013;20:420–428. doi: 10.1111/ene.12006. [DOI] [PubMed] [Google Scholar]
- Lentz MR, Peterson KL, Ibrahim WG, et al. Diffusion tensor and volumetric magnetic resonance measures as biomarkers of brain damage in a small animal model of HIV. PLoS One. 2014;9:e105752. doi: 10.1371/journal.pone.0105752. [DOI] [PMC free article] [PubMed] [Google Scholar]
- Robertson KR, Smurzynski M, Parsons TD, et al. The prevalence and incidence of neurocognitive impairment in the HAART era. AIDS. 2007;21:1915–1921. doi: 10.1097/QAD.0b013e32828e4e27. [DOI] [PubMed] [Google Scholar]
- Heaton RK, Clifford DB, Franklin DR, Jr, et al. HIV-associated neurocognitive disorders persist in the era of potent antiretroviral therapy: CHARTER Study. Neurology. 2010;75:2087–2096. doi: 10.1212/WNL.0b013e318200d727. [DOI] [PMC free article] [PubMed] [Google Scholar]
- Simioni S, Cavassini M, Annoni JM, et al. Cognitive dysfunction in HIV patients despite long-standing suppression of viremia. AIDS. 2010;24:1243–1250. doi: 10.1097/QAD.0b013e3283354a7b. [DOI] [PubMed] [Google Scholar]
- Ellis RJ, Badiee J, Vaida F, et al. CD4 nadir is a predictor of HIV neurocognitive impairment in the era of combination antiretroviral therapy. AIDS. 2011;25:1747–1751. doi: 10.1097/QAD.0b013e32834a40cd. [DOI] [PMC free article] [PubMed] [Google Scholar]
- Smurzynski M, Wu K, Letendre S, et al. Effects of central nervous system antiretroviral penetration on cognitive functioning in the ALLRT cohort. AIDS. 2011;25:357–365. doi: 10.1097/QAD.0b013e32834171f8. [DOI] [PMC free article] [PubMed] [Google Scholar]
- Kumar AM, Borodowsky I, Fernandez B, et al. Human immunodeficiency virus type 1 RNA Levels in different regions of human brain: quantification using real-time reverse transcriptase-polymerase chain reaction. J Neurovirol. 2007;13:210–224. doi: 10.1080/13550280701327038. [DOI] [PubMed] [Google Scholar]
- Eden A, Price RW, Spudich S, et al. Immune activation of the central nervous system is still present after >4 years of effective highly active antiretroviral therapy. J Infect Dis. 2007;196:1779–1783. doi: 10.1086/523648. [DOI] [PubMed] [Google Scholar]
- Yilmaz A, Price RW, Spudich S, et al. Persistent intrathecal immune activation in HIV-1-infected individuals on antiretroviral therapy. J Acquir Immune Defic Syndr. 2008;47:168–173. doi: 10.1097/QAI.0b013e31815ace97. [DOI] [PMC free article] [PubMed] [Google Scholar]
- Lyons JL, Uno H, Ancuta P, et al. Plasma sCD14 is a biomarker associated with impaired neurocognitive test performance in attention and learning domains in HIV infection. J Acquir Immune Defic Syndr. 2011;57:371–379. doi: 10.1097/QAI.0b013e3182237e54. [DOI] [PMC free article] [PubMed] [Google Scholar]
- Airoldi M, Bandera A, Trabattoni D, et al. Neurocognitive impairment in HIV-infected naive patients with advanced disease: the role of virus and intrathecal immune activation. Clin Dev Immunol. 2012;2012:467154. doi: 10.1155/2012/467154. [DOI] [PMC free article] [PubMed] [Google Scholar]
- Pedersen KK, Pedersen M, Gaardbo JC, et al. Persisting inflammation and chronic immune activation but intact cognitive function in HIV-infected patients after long-term treatment with combination antiretroviral therapy. J Acquir Immune Defic Syndr. 2013;63:272–279. doi: 10.1097/QAI.0b013e318289bced. [DOI] [PubMed] [Google Scholar]
- Burdo TH, Weiffenbach A, Woods SP, et al. Elevated sCD163 in plasma but not cerebrospinal fluid is a marker of neurocognitive impairment in HIV infection. AIDS. 2013;27:1387–1395. doi: 10.1097/QAD.0b013e32836010bd. [DOI] [PMC free article] [PubMed] [Google Scholar]
- Cassol E, Misra V, Morgello S, Gabuzda D. Applications and limitations of inflammatory biomarkers for studies on neurocognitive impairment in HIV infection. J Neuroimmune Pharmacol. 2013;8:1087–1097. doi: 10.1007/s11481-013-9512-2. [DOI] [PMC free article] [PubMed] [Google Scholar]
- Thurnher MM, Schindler EG, Thurnher SA, et al. Highly active antiretroviral therapy for patients with AIDS dementia complex: effect on MR imaging findings and clinical course. AJNR Am J Neuroradiol. 2000;21:670–678. [PMC free article] [PubMed] [Google Scholar]
- Hanning U, Husstedt IW, Niederstadt TU, et al. Cerebral signal intensity abnormalities on T2-weighted MR images in HIV patients with highly active antiretroviral therapy: relationship with clinical parameters and interval changes. Acad Radiol. 2011;18:1144–1150. doi: 10.1016/j.acra.2011.04.013. [DOI] [PubMed] [Google Scholar]
- Schneider-Hohendorf T, Philipp K, Husstedt IW, et al. Specific loss of cellular L-selectin on CD4(+) T cells is associated with progressive multifocal leukoencephalopathy development during HIV infection. AIDS. 2014;28:793–795. doi: 10.1097/QAD.0000000000000201. [DOI] [PubMed] [Google Scholar]
- Price RW, Peterson J, Fuchs D, et al. Approach to cerebrospinal fluid (CSF) biomarker discovery and evaluation in HIV infection. J Neuroimmune Pharmacol. 2013;8:1147–1158. doi: 10.1007/s11481-013-9491-3. [DOI] [PMC free article] [PubMed] [Google Scholar]
- Gisslen M, Hagberg L, Rosengren L, et al. Defining and evaluating HIV-related neurodegenerative disease and its treatment targets: a combinatorial approach to use of cerebrospinal fluid molecular biomarkers. J Neuroimmune Pharmacol. 2007;2:112–119. doi: 10.1007/s11481-006-9035-1. [DOI] [PubMed] [Google Scholar]
- Serrano-Villar S, Moreno S, Fuentes-Ferrer M, et al. The CD4:CD8 ratio is associated with markers of age-associated disease in virally suppressed HIV-infected patients with immunological recovery. HIV Med. 2014;15:40–49. doi: 10.1111/hiv.12081. [DOI] [PubMed] [Google Scholar]
- Serrano-Villar S, Perez-Elias MJ, Dronda F, et al. Increased risk of serious non-AIDS-related events in HIV-infected subjects on antiretroviral therapy associated with a low CD4/CD8 ratio. PLoS One. 2014;9:e85798. doi: 10.1371/journal.pone.0085798. [DOI] [PMC free article] [PubMed] [Google Scholar]
- Autran B, Carcelain G, Li TS, et al. Positive effects of combined antiretroviral therapy on CD4+ T cell homeostasis and function in advanced HIV disease. Science. 1997;277:112–116. doi: 10.1126/science.277.5322.112. [DOI] [PubMed] [Google Scholar]
- Emu B, Moretto WJ, Hoh R, et al. Composition and function of T cell subpopulations are slow to change despite effective antiretroviral treatment of HIV disease. PLoS One. 2014;9:e85613. doi: 10.1371/journal.pone.0085613. [DOI] [PMC free article] [PubMed] [Google Scholar]
- Serrano-Villar S, Sainz T, Lee SA, et al. HIV-infected individuals with low CD4/CD8 ratio despite effective antiretroviral therapy exhibit altered T cell subsets, heightened CD8+ T cell activation, and increased risk of non-AIDS morbidity and mortality. PLoS Pathog. 2014;10:e1004078. doi: 10.1371/journal.ppat.1004078. [DOI] [PMC free article] [PubMed] [Google Scholar]
- Ghiglione Y, Falivene J, Ruiz MJ, et al. Early skewed distribution of total and HIV-specific CD8+ T-cell memory phenotypes during primary HIV infection is related to reduced antiviral activity and faster disease progression. PLoS One. 2014;9:e104235. doi: 10.1371/journal.pone.0104235. [DOI] [PMC free article] [PubMed] [Google Scholar]
- Tinago W, Coghlan E, Macken A, et al. Clinical, immunological and treatment-related factors associated with normalised CD4+/CD8+ T-cell ratio: effect of naive and memory T-cell subsets. PLoS One. 2014;9:e97011. doi: 10.1371/journal.pone.0097011. [DOI] [PMC free article] [PubMed] [Google Scholar]
- Schneider-Hohendorf T, Rossaint J, Mohan H, et al. VLA-4 blockade promotes differential routes into human CNS involving PSGL-1 rolling of T cells and MCAM-adhesion of TH17 cells. J Exp Med. 2014;211:1833–1846. doi: 10.1084/jem.20140540. [DOI] [PMC free article] [PubMed] [Google Scholar]
- La Gruta NL, Rothwell WT, Cukalac T, et al. Primary CTL response magnitude in mice is determined by the extent of naive T cell recruitment and subsequent clonal expansion. J Clin Invest. 2010;120:1885–1894. doi: 10.1172/JCI41538. [DOI] [PMC free article] [PubMed] [Google Scholar]
- Sainz T, Serrano-Villar S, Diaz L, et al. The CD4/CD8 ratio as a marker T-cell activation, senescence and activation/exhaustion in treated HIV-infected children and young adults. AIDS. 2013;27:1513–1516. doi: 10.1097/QAD.0b013e32835faa72. [DOI] [PubMed] [Google Scholar]
- Serrano-Villar S, Gutierrez C, Vallejo A, et al. The CD4/CD8 ratio in HIV-infected subjects is independently associated with T-cell activation despite long-term viral suppression. J Infect. 2013;66:57–66. doi: 10.1016/j.jinf.2012.09.013. [DOI] [PubMed] [Google Scholar]
- Taborda NA, Rugeles MT, Montoya CJ. Spontaneous control of HIV replication, but not HAART-induced viral suppression, is associated with lower activation of immune cells. J Acquir Immune Defic Syndr. 2014;66:365–369. doi: 10.1097/QAI.0000000000000162. [DOI] [PubMed] [Google Scholar]
- Gonzalez-Scarano F, Martin-Garcia J. The neuropathogenesis of AIDS. Nat Rev Immunol. 2005;5:69–81. doi: 10.1038/nri1527. [DOI] [PubMed] [Google Scholar]
- Anthony IC, Ramage SN, Carnie FW, et al. Influence of HAART on HIV-related CNS disease and neuroinflammation. J Neuropathol Exp Neurol. 2005;64:529–536. doi: 10.1093/jnen/64.6.529. [DOI] [PubMed] [Google Scholar]
- Peters PJ, Bhattacharya J, Hibbitts S, et al. Biological analysis of human immunodeficiency virus type 1 R5 envelopes amplified from brain and lymph node tissues of AIDS patients with neuropathology reveals two distinct tropism phenotypes and identifies envelopes in the brain that confer an enhanced tropism and fusigenicity for macrophages. J Virol. 2004;78:6915–6926. doi: 10.1128/JVI.78.13.6915-6926.2004. [DOI] [PMC free article] [PubMed] [Google Scholar]
- Schnell G, Price RW, Swanstrom R, Spudich S. Compartmentalization and clonal amplification of HIV-1 variants in the cerebrospinal fluid during primary infection. J Virol. 2010;84:2395–2407. doi: 10.1128/JVI.01863-09. [DOI] [PMC free article] [PubMed] [Google Scholar]
- Wherry EJ. T cell exhaustion. Nat Immunol. 2011;12:492–499. doi: 10.1038/ni.2035. [DOI] [PubMed] [Google Scholar]
- Day CL, Kaufmann DE, Kiepiela P, et al. PD-1 expression on HIV-specific T cells is associated with T-cell exhaustion and disease progression. Nature. 2006;443:350–354. doi: 10.1038/nature05115. [DOI] [PubMed] [Google Scholar]
- Trautmann L, Janbazian L, Chomont N, et al. Upregulation of PD-1 expression on HIV-specific CD8+ T cells leads to reversible immune dysfunction. Nat Med. 2006;12:1198–1202. doi: 10.1038/nm1482. [DOI] [PubMed] [Google Scholar]
- Petrovas C, Chaon B, Ambrozak DR, et al. Differential association of programmed death-1 and CD57 with ex vivo survival of CD8+ T cells in HIV infection. J Immunol. 2009;183:1120–1132. doi: 10.4049/jimmunol.0900182. [DOI] [PMC free article] [PubMed] [Google Scholar]
- Zhang JY, Zhang Z, Wang X, et al. PD-1 up-regulation is correlated with HIV-specific memory CD8+ T-cell exhaustion in typical progressors but not in long-term nonprogressors. Blood. 2007;109:4671–4678. doi: 10.1182/blood-2006-09-044826. [DOI] [PubMed] [Google Scholar]
- Tendeiro R, Foxall RB, Baptista AP, et al. PD-1 and its ligand PD-L1 are progressively up-regulated on CD4 and CD8 T-cells in HIV-2 infection irrespective of the presence of viremia. AIDS. 2012;26:1065–1071. doi: 10.1097/QAD.0b013e32835374db. [DOI] [PubMed] [Google Scholar]
- Barbour JD, Ndhlovu LC, Xuan Tan Q, et al. High CD8+ T cell activation marks a less differentiated HIV-1 specific CD8+ T cell response that is not altered by suppression of viral replication. PLoS One. 2009;4:e4408. doi: 10.1371/journal.pone.0004408. [DOI] [PMC free article] [PubMed] [Google Scholar]
- Blackburn SD, Shin H, Haining WN, et al. Coregulation of CD8+ T cell exhaustion by multiple inhibitory receptors during chronic viral infection. Nat Immunol. 2009;10:29–37. doi: 10.1038/ni.1679. [DOI] [PMC free article] [PubMed] [Google Scholar]
- Ha SJ, Mueller SN, Wherry EJ, et al. Enhancing therapeutic vaccination by blocking PD-1-mediated inhibitory signals during chronic infection. J Exp Med. 2008;205:543–555. doi: 10.1084/jem.20071949. [DOI] [PMC free article] [PubMed] [Google Scholar]
Associated Data
This section collects any data citations, data availability statements, or supplementary materials included in this article.
Supplementary Materials
Tables S1–S4. Detailed statistical analyses of the data presented.
Figure S1. Gating strategy to determine HLA-DR-positive CD3+CD56−CD4+ and CD8+ T cells and CD3+CD56+ NKT cells in PB and CSF. Cells derived from the peripheral blood (PB; 1st row) and cerebrospinal fluid (CSF; 2nd row) were stained using fluorochrome-labeled antibodies directed against the linage markers CD45 (leukocytes), CD14 (monocytes), CD3 (T cells), CD56 (NK cells), CD4 (CD4+ T cells), and CD8 (CD8+ T cells) and the activation marker HLA-DR and analyzed by multiparameter cytometry. CD45+ leukocytes were selected in a CD45 versus forward scatter channel (FSC) plot. CD45+ cells were then displayed in a CD14 versus sideward scatter channel (SSC) plot to identify CD14- lymphocytes. To distinguish between CD3−CD56+ NK cells, CD3+CD56+ NKT cells and CD3+CD56− T cells, lymphocytes were further displayed in a CD3 versus CD56 plot. CD3+CD56− T cells were further split into CD4+ and CD8+ T cells and the percentage of HLA-DR-positive CD4+ T cells and CD8+ T cells was analyzed, respectively. HLA-DR-positive CD3+CD56+ NKT cells were analyzed in a similar manner. Resulting quadrant gates were analyzed postprocessing using Kaluza 1.2 Software (Beckman Coulter).
Figure S2. Gating strategy to determine CD4+ and CD8+ T-cell subsets in PB and CSF. Lymphocytes were selected in a side scatter channel (SSC) versus forward scatter channel (FSC) plot. Lymphocytes were then displayed in a CD3 versus CD56 plot. CD3+CD56− T cells were further split into CD4+ and CD8+ T cells. CD4+ and CD8+ T cells subsets were defined using the following co-expression of markers: Naive (naive, CCR7+CD45RA+), central memory (CM, CCR7+CD45RA−), effector memory (EM, CCR7−CD45RA−) and terminal differentiated effector (TEMRA, CCR7−CD45RA+) T cells. Resulting quadrant gates were analyzed postprocessing using Kaluza 1.2 Software (Beckman Coulter).