

Abstract
Acquired melanocytic nevi are commonly found in sun exposed and unexposed human skin, but the potential for their transformation into invasive melanoma is not clear. Therefore, a mouse model of nevus initiation and progression was developed in C3H/HeN mice using a modified chemical carcinogenesis protocol. Nevi develop due to DNA damage initiated by dimethylbenz(a) anthracene (DMBA) followed by chronic promotion with 12‐O‐tetradecanoyl‐phorbol‐13‐acetate (TPA). Dysplastic pigmented skin lesions appeared in 7–9 wk with 100% penetrance. Nests of melanocytic cells appeared in a subset of skin draining lymph nodes (dLN) by 25 wk, but not in age matched controls. Immunohistochemistry, real‐time PCR, and flow cytometric analyses confirmed their melanocytic origin. Transformed cells were present in a subset of nevi and dLNs, which exhibited anchorage‐independent growth, tumor development, and metastasis in nude mice. Approximately 50% of the cell lines contained H‐Ras mutations and lost tumor suppressor p16Ink4a expression. While most studies of melanoma focus on tumor progression in transgenic mouse models where the mutations are present from birth, our model permits investigation of acquired mutations at the earliest stages of nevus initiation and promotion of nevus cell transformation. This robust nevus/melanoma model may prove useful for identifying genetic loci associated with nevus formation, novel oncogenic pathways, tumor targets for immune‐prevention, screening therapeutics, and elucidating mechanisms of immune surveillance and immune evasion. © 2015 The Authors. Molecular Carcinogenesis, published by Wiley Periodicals, Inc.
Keywords: carcinogenesis, melanocyte, nevi, Ras
Abbreviations
- dLN
draining lymph nodes
- UV
Ultraviolet radiations
- PTEN
Phosphatase and tensin homolog
- DMBA
7,12‐Dimethylbenz(a)anthracene
- TPA
12‐O‐tetradecanoyl‐phorbol‐13‐acetate
- dbcAMP
N6, 2'‐O‐dibutyryladenosine 3:5‐cyclic monophosphate
- TRP2
tyrosine related protein
- DCT
Dopachrome tautomerase
- GAPDH
Glyceraldehyde 3‐phosphate dehydrogenase
- PCR
polymerase chain reaction
- FBS
fetal bovine serum
- PBS
phosphate buffer saline
- IGV
Integrative Genomics Viewer
- VEGF
Vascular endothelial growth factor
- CCR7
C‐C chemokine receptor type 7
- ACB‐PCR
Allele‐specific competitive blocker – polymerase chain reaction
- HGF/SF
hepatocyte growth factor/scatter factor
- Asp
Agouti signaling protein
- PAH
Polyaromatic hydrocarbons
INTRODUCTION
Melanocytic nevi are benign proliferations of melanocytic cells that are positively correlated with susceptibility to melanoma 1, 2. They are commonly present in human skin. However, little is known about the factors that lead to their development and evolution into melanoma. In 20–50% of cases, melanoma can be traced back to a preexisting nevus 3, 4. Nevi that develop after birth (acquired nevi) harbor oncogenic mutations in BRAF, the predominant oncogene associated with melanoma 5. On the other hand, congenital nevi and Spitz nevi frequently harbor N‐RAS mutations and H‐RAS mutations, respectively 6, 7. These mutations are known to activate the MAP‐kinase signal transduction pathway. Activation of the MAP‐kinase pathway may be necessary for transformation of melanocytes, but it is not sufficient for their progression to melanoma 8. In addition, inactivation of the INK4A/ARF (or CDKN2A) locus is a common event in the development of human melanoma, but its role in nevus formation is not clear 11.
During the past decade, various mouse models have been developed which attempt to recapitulate the processes involved in developing melanoma. Genetically altered, or transgenic mouse models have been used to study the impact of disrupting one or more genes that are similarly mutated in human melanoma. Specifically, mutations that activate the RAS‐RAF‐AKT pathway or disrupt the PTEN, CDK4‐INK4A‐pRB, or ARF‐p53 pathways have been the focus of most studies (reviewed by Walker et al. 9). Importantly, these melanoma‐associated mutations are also commonly found in benign nevi, indicating that other, uncharacterized oncogenic mutations are required for further transformation and progression to melanoma. Nevus development has been investigated in pigmented hairless mice with genetic deficiencies in Ink4a/Arf and Xpa genes by exposing their skin with DMBA when they are newborn (day 3) and later, at an “adult” age, with continuous treatment with tumor promoter TPA 10. This model produced only a few nevi (∼1–2/mouse) and none advanced to melanoma. Further, a significant portion of mice remained nevus‐free. The combination of environmental carcinogens, aloe emodin plus UVB, has been shown to induce melanoma without development of nevi 11. Thus, the mechanisms governing melanocytic dysplasia, nevus formation and progression to melanoma cannot be elucidated. Romerdahl et al. also described a few decades earlier that UV can induce melanoma in C3H mice, but it was much less effective than the DMBA protocol applied to neonatal mice 12, or the robust model we present here.
We have established a DMBA/TPA protocol that affects 100% of treated C3H/HeN mice in which numerous nevi appear beginning at 7–9 wk. By 30 wk, we show that a subset of nevi harbor transformed cells, exhibit an immune‐suppressive tumor micro‐environment and metastasis in draining lymph nodes. Due to the immunocompetence of C3H/HeN mice and low rate of nevus transformation to melanoma, this model mimics the low transformation rate of nevi in humans. In comparison to C57Bl/6 (B6) strain, C3H/HeN (C3H) mice are more susceptible to the development of PAH induced tumors 13, 14. The DMBA metabolizing ability of B6 and C3H stains is similar as they have same allele for Ahb receptor (aryl hydrocarbon receptor). The difference in MHC I alleles is responsible for greater allergic contact hypersensitivity response in C3H compared to B6 strains 14. Other factors include a dominant allele of the agouti signaling protein (ASP), resulting in the production of the less stable, light colored pigment, pheomelanin 15. The favored production of pheomelanin is a known melanoma risk factor for humans with red or blonde hair 13. Differences in the background genes of these two strains may influence the substrates and intermediates affecting cellular functions that may promote melanocyte transformation 16. Current therapies target proteins in known dysregulated pathways with the aim of eradicating malignant melanoma 17. Thus, the increased susceptibility to nevus development in C3H/HeN mice should be useful for screening drugs that can block those dysregulated pathways and identify new pathways that contribute to nevus development and melanoma progression.
MATERIALS AND METHODS
Animals
Female C57BL/6 and C3H/HeN mice aged 6–8 wk were obtained from Charles River Laboratories (Wilmington, MA). Female NIH‐bg‐nu‐Xid mice were obtained from NCI‐Fredrick. All mice were housed in the University of Alabama at Birmingham (UAB) pathogen‐free animal facility. All animals were fed a normal diet and were given water ad libitum. The protocol for the study was approved by the UAB Institutional Animal Care and Use Committee.
Chemicals and Antibodies
7,12‐ Dimethylbenz(a) anthracene (DMBA) (≥95% purity), N6, 2'‐O‐dibutyryladenosine 3:5‐cyclic monophosphate (dbcAMP), and Sodium orthovandate (Na3VO4) were purchased from Sigma–Aldrich Chemical Co. (St. Louis, MO). 12‐O‐tetradecanoyl‐phorbol‐13‐acetate (TPA) was obtained from LC laboratories (Woburn, MA).
Nevus/Melanoma Induction Protocol
The shaved and naired back skin of mice was painted with 100 μg (∼400 nmoles) or 50 μg (∼200 nmoles) of DMBA in 200 μL of acetone. The animals were then treated with twice weekly application of 12.5 μg TPA (20 nmol) or 6.25 μg (10 nmol) in acetone. TPA was stopped at 20 wk unless otherwise stated. The area of the lesions was measured using length and width of all nevi. All the mice were naired weekly to count and measure the nevi. Treatment of the skin of mice with DMBA and TPA is known to cause epithelial tumors. Using a lower TPA dose (12.5 μg) resulted in the development of fewer epithelial papillomas, with a delay in their appearance (14–15 wk). Ceasing TPA treatments after 20 wk caused regression of papillomas, leading to 30–40% of mice to be papilloma free by 25 wk (data not shown). Mice with low to absent epithelial tumors were used in these studies.
Development of Melanocytic Cell Lines From Nevus Tissue and Lymph Nodes (LNs)
Nevus biopsies and LNs were digested in 200 μL of digestion buffer (collagenase D [Roche] [1 mg/mL] and DNAse [20μg/mL]) for 45 min. The cells were cultured in melanocyte growth media OptiMEM with dbcAMP (0.1 mM), Na3VO4 (1 μM), horse serum (7%), and TPA (25 ng/mL) and media was changed every 2 d.
Histological Evaluation and Melanin Bleaching
Nevus or lymph node biopsies were taken and immediately placed in 10% buffered formalin. The tissues were fixed for 24 h and then embedded in paraffin. Sections of 6 µm thickness were cut and deparafinized by incubating in xylene and then dehydrating serially in 100%, 95%, 70%, and 50% ethanol. The slides were washed with water and processed for hematoxylin and eosin (H&E) staining to identify melanocytic cells on serial sections. Corresponding sections were also melanin bleached using 0.25% potassium permanganate and 5% oxalic acid solutions and were processed for H&E staining or fluorescent staining discussed below.
Flow Cytometry
Lesions and adjacent skin from the DMBA/TPA treated mice or age matched untreated skin were collected. Single cell suspensions were prepared individually by collagenase D digestion. Lymph node cells were also prepared using collagenase digestion. Cells were collected, counted, and dispensed at 2 × 10⁶ cells/sample for pretreated with Fc receptor block, then stained with the appropriate primary antibody. After fixation/permeablization, cells were further stained with the appropriate antibodies and fluorochromes. For pERK staining, cells were fixed additionally with 90% methanol for 20 min before incubating them with the antibody. Flow cytometric analysis was performed using a BD LSRII cytometer with BD FACSDiva software for acquisition and FlowJo 9.5.2 for data analysis.
Fluorescence Staining
Cells (1 × 10⁴) were plated on round cover slips placed in a 12‐well culture plate. The cells were allowed to adhere and after 48 h the cover slips were washed with PBS and fixed in 1% formaldehyde for 10 min at 4°C and 10% methanol for another 10 min at −20°C. Cells were washed with PBS‐GSA (phosphate buffered saline with 10 mM Glycine and 0.2% Sodium Azide) and incubated in blocking buffer (5% Horse serum and 10x Donkey ɣ‐globulin or Fc block [clone 2.4G2]) at room temperature for 30 min. Cells were then incubated with anti‐S100, tyrosinase, Melan A, HMB45 or Trp‐2 antibody for 1 h followed by FITC, or 594 conjugated appropriate secondary antibody. After washing with PBS, the cells were counterstained with DAPI. Cells were detected with an Olympus BX41 microscope and further analyzed using ImagePro Plus software v6.0 (Media Cybernetics, Inc., Silver Springs, MD). For tissues sections, if melanin bleaching was required, sections were bleached as described. The slides underwent antigen retrieval by cooking the slides in sodium citrate buffer (pH 6.0) for 5 min at the highest pressure setting in a preheated pressure cooker, and then allowing them to cool them for an additional 20 min. After that, the slides were incubated in PBS, blocked as above and then sections were stained with the appropriate primary antibody and were detected as described for cell staining. In some cases LNs were embedded in OCT‐Tissue Tek and frozen immediately. Sections (6 µm) in thickness were cut using a cryotome. Sections were air dried, fixed and stained with the appropriate antibody and visualized as described in this section.
DNA/RNA Extraction, RT‐PCR and qPCR
The total genomic DNA and RNA was extracted from the samples using Trizol reagent (Invitrogen, Carlsbad, CA) according to the manufacturer's instructions. The concentration of total RNA was determined by measuring the absorbance at 260 nm using an eppendorf biophotometer plus. Purity of isolated RNA was determined with the ratio of absorbance 260 nm/280 nm >1.8. cDNA was synthesized from 1 µg RNA using Reverse transcriptase kit (Biorad) according to the manufacturer's instructions. cDNA was amplified by real‐time PCR using iQTM SYBR Green Master Mix (Biorad), with a Bio‐Rad MyiQ thermocycler, and SYBR Green detection system (Bio‐Rad). The primer sequences were retrieved from the Primer Bank 18 or were obtained as indicated. The primers used are: Tyrosinase Forward 5′‐ AGTTTACCCAGAAGCCAATGC‐3′ and Reverse 5′‐ CGACTGGCCTTGTTCCAAGT‐3′ 19; Dopachrome tautomerase (Dct or trp2) Forward 5′‐TTCAACCGGACATGCAAATGC‐3′ and reverse 5′‐ GCTTCTTCCGATTACAGTCGGG‐3′ (Accession no. NP_034154.2); Melan‐A Forward 5′‐ACGAAGTGGATACAGAACCTTGA‐3′ and Reverse 5′‐ GGCTCTCACATGAGCATCTTTC‐3′ (Accession no. NP_084269); melanocyte protein (PMEL or gp100) Forward 5′‐AAAAGGTACTACCGGATGGTCA‐3′ and Reverse 5′‐ TCCACCGTCAGGGAAGACA‐3′ (Accession no. NP_068682.2); GAPDH Forward 5′‐CATGTTCCAGTATGACTCCACTC‐3′ and Reverse 5′‐ GGCCTCACCCCATTTGATGT‐3′ 20. The standard PCR conditions were 95°C for 10 min and then 40 cycles at 95°C for 30 s, 60°C for 30 s. The expression levels of genes were normalized to the expression level of the GAPDH mRNA in each sample. For mRNA analysis, the calculations for determining the relative level of gene expression were made using the cycle threshold (Ct) method. The mean Ct values from duplicate measurements were used to calculate the expression of the target gene with normalization to a housekeeping gene used as internal control and using the formulae 2−ΔΔCT. The expression of p16 Ink4a and p19Arf mRNA was detected using primers and conditions described elsewhere 21. We followed the established allele‐specific competitive blocker PCR (ACB‐PCR) as per Parsons et al. (Parsons et al., 2005), the WT allele blocking primer was phosphorylated at the 3′ end to block primer extension. The primers used were WT Forward 5′‐CAGCAGGTCAAGAAGAGTATAGTGCCA‐PO4‐3, Mutant Forward 5′‐CATCTTAGACACAGCAGGTCT‐3′ and common reverse 5′‐GCGAGCAGCCAGGTCACAC‐3′. The blocker allele and mutant allele‐specific primers were used at a 4:1 ratio (WT:mutant) using RT‐PCR protocols that were optimized for increased specificity and sensitivity in detecting the H‐Ras Q61L point mutation. Thermocycling conditions were 10 min at 95°C and 35 cycles of 20 s at 95°C, 30 s at 60°C, and 20 s at 72°C.
DNA Isolation and Analysis of Gene Deletion
The genomic DNA was extracted from the samples using Trizol reagent (Invitrogen, Carlsbad, CA) according to the manufacturer's instructions. The concentration of total DNA was determined by measuring the absorbance at 260 nm using an eppendorf biophotometer plus. Purity of isolated DNA was determined with the ratio of absorbance 260 nm/280 nm >1.8. PCR to detect exon deletions in p16 Ink4a and p19Arf gene locus was done using the primers and strategy as described 21.
Soft Agar Anchorage‐Independent Growth Assay
The soft agar colony forming assay was done as described with some modifications 22. Cells (1 × 10⁴) were suspended in a top layer of Melanocyte growth medium containing 7% horse serum and 7% FBS and 0.4% low melting agarose (Invitrogen) and plated on a bottom layer of Melanocyte growth medium containing 7% horse serum and 7% FBS and 0.7% agarose. The cells were cultured in duplicates, and the medium was changed twice weekly. The colonies were allowed to grow for 3 wk. Colonies were counted in each well visually by staining with 0.05% crystal violet. The diameter of each colony (>100 μm) was measured by taking pictures and counting the colonies in at least five frames.
Growth in Nude Mice
Cells, 2 × 10⁶ cells were injected in PBS: matrigel (1:1) subcutaneously into immunocompromised mice (NIH‐bg‐nu‐Xid), two injections per animal in triplicates. Tumors were counted weekly and tumor volume was measured using the formula for hemiellipsoid (Volume = 1/2 × (4π/3) × (l/2) × (w/2) × h, where l, length, w, width, and h, height).
Metastasis Assay
Cells, 2 × 10⁶ cells were injected in retro orbital sinus of nude mice and sacrificed 8 wk later. Lungs were infused and fixed in formalin. Sections were cut and stained with H &E and analyzed for tumor foci.
RNA‐Seq Analysis for Mutation Detection
RNA‐sequencing was performed using Illumina Genome Analyzer IIx (GAIIx) platform and was done as described elsewhere 23. TopHat version 2.0.0 was used to align RNA‐Seq reads to the reference genome (mm 9) using the short read aligner Bowtie (version 2.0.0.5). Mutations were analyzed using Broad Institute's Integrative Genomics Viewer (IGV).
RESULTS
C3H/HeN Mice Develop Nevus Lesions in a Time and Dose Dependent Manner
Following a two‐step DMBA/TPA protocol, 100% of C3H/HeN mice developed pigmented lesions, which were visually discernible by 7–9 wk (Figure 1A). TPA application alone does not generate nevi (data not shown), highlighting the importance of DMBA as an initiator. In the absence of TPA, a single dose of DMBA generated only a few, very small nevi, in contrast to mice treated with the combination of DMBA and TPA (Figure 1A). The number of pigmented lesions increased as the DMBA dose increased (Figure 1B). Lesion size depended on both the DMBA and TPA doses used (Figure 1B and C). To analyze whether these lesions were stable, TPA administration was stopped at 20 wk and the number and size of individual nevi were mapped, then mice went untreated for 10 wk then a second lesion assessment was made. We observed that a substantial number of lesions regressed (Figure 1D), resulting in a reduced tumor burden per mouse (Figure 1E); however, 44% of the lesions were stable in the absence of continued TPA treatment, and the penetrance remained at 100%. Moreover, the remaining lesions were larger at 30 wk compared to 20 wk, indicating that the stable lesions continued to grow independent of TPA (Figure1F).
Figure 1.
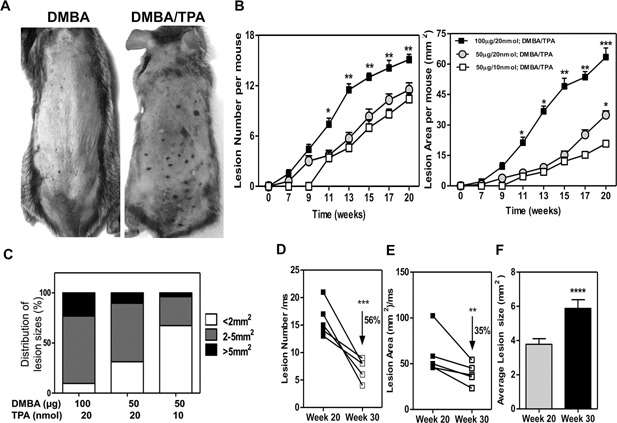
Chemical carcinogenesis induces nevi in C3H/HeN mice. Application of DMBA/TPA induces pigmented lesions that begin to appear on skin by 7 wk. (A) Representative photo of mice at 20 wk after DMBA (100 μg) or DMBA (100 μg)/TPA (20 nmol) protocol. Note that individual lesions are identified as darkened spots on the skin surface. (B) Kinetics of pigmented lesion formation and growth demonstrate that nevus development is DMBA and TPA dose dependent. (C) Size distribution of lesions. (D, E) Reduction in lesion numbers (D) and affected area per mouse (E), 10 wk after TPA treatment was stopped. Each line represents an individual mouse. (F) Lesion growth without TPA from weeks 20 through 30. P values: *, <0.05; **, <0.01; ***, <0.001, ****, 0.0001.
Histological Analysis of Accumulated Pigment Cells in the Dermis
Biopsies of the nevi revealed that intensely pigmented cells were found in the dermis. In some cases, the cells invaded the subcutaneous tissue (Figure 2A). The lesions were composed of densely packed melanocytes that were arranged in nests, exhibiting both epithelioid and spindle shaped morphology. Pigment‐bleached serial sections revealed nests of cells with abundant cytoplasm, large central nuclei with prominent nucleoli, and were often surrounded by inflammatory cells and blood vessels (Figure 2A). The tyrosinase (Tyr) mRNA level was higher in the nevus biopsies than in untreated skin (Figure 2B). Melanoma tumor‐associated staining with S100, Ki67, and VEGF was enriched in tissue sections of lesion biopsies compared to normal and age‐matched skin (Figure 2D and E). VEGF has been reported to differentially stain human melanomas but not human nevi 24. Biopsied skin lesions from treated mice were positive for anti‐VEGF immunofluorescence, while age‐matched tissues were negative (Figure 2D). VEGF staining was confirmed by flow cytometric analysis of nevus cell preparations (Figure 2C). MelanA+ gated cells expressed higher levels of VEGF in comparison to normal skin cells (Peak channel 480 versus 240, respectively). Furthermore, a substantial number of S100+ cells in the dermis were also Ki67 positive, indicating proliferative activity consistent with transformation (Figure 2E).
Figure 2.
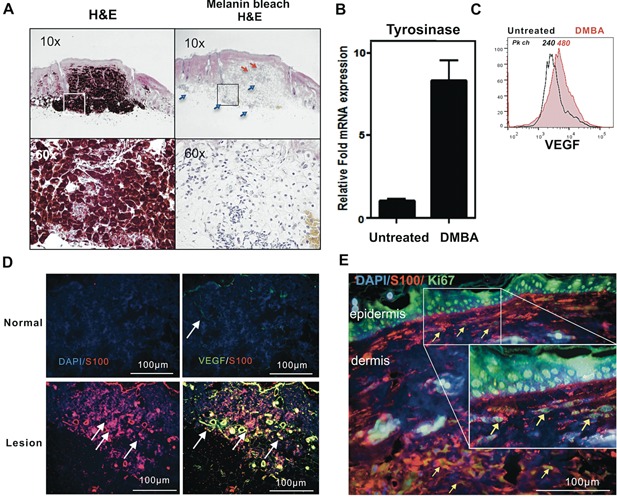
Melanoma‐associated markers and increased angiogenesis in chemically induced pigmented lesions. (A) Panels of H&E stained nevus tissue serial section pairings of unbleached (left) and bleached (right) views taken with objective magnification of 10x or 60x as shown. Pigmented cells reached and invaded the subcutaneous layer. Enhanced angiogenesis (red arrow) and infiltrating inflammatory cells (blue arrow) in the lesion. (B) qPCR analysis of untreated skin and DMBA treated pigmented lesions for tyrosinase mRNA levels from at least 3 nevi each from 3 mice. (C) Flow cytometric analysis for VEGF. The cells were gated on MelanA+ cells. (D–E) Formalin sections were stained with anti‐mouse S100 antibody, rabbit anti‐mouse VEGF, or rabbit anti‐mouse Ki67. (TPA‐induced hyperproliferation of epidermis is confirmed by uniform Ki67 staining.) Arrows highlight Ki67+ melanocytic (S100+) cells. Scale bars are shown.
MelanA + Skin Lesion Cells Contain a Discrete Subset of CCR7+, Vimentin + Cells
CCR7 overexpression in melanoma cells has been shown to facilitate metastasis 25, 26. Further, the mesenchymal marker vimentin and Ki67 positivity are hallmarks of melanoma metastasis and aggressiveness 27, 28. Single cell preparations from DMBA/TPA treated skin contained twice the number of MelanA+ cells compared to control untreated skin. Almost half (45%) of the MelanA+ cells were also positive for CCR7 as well as vimentin, indicating that the nevi contained a subset of cells with characteristics of metastatic melanoma (Figure 3A).
Figure 3.
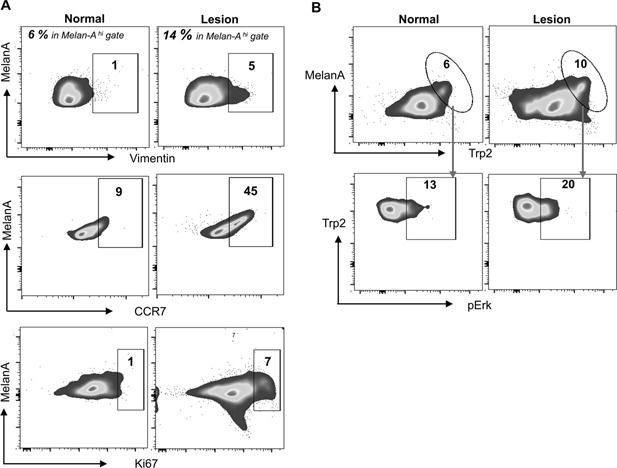
Invasive cell phenotype detected in pigmented lesions. Three mice from each group were sacrificed and skin and nevus biopsies were processed for isolation of single cells, counted and stained for FACS analysis. (A) MelanA high cells were gated as in A (% shown) and examined for vimentin, CCR7 or Ki67. (B) The cells were stained, gated on the melanocytic marker anti‐mouse MelanA or Anti‐mouse TRP2, then analyzed for pERK.
MelanA + Skin Lesion Cells Contain Ki67+, TRP2hi Cells With Increased Levels of Survival‐Associated Phospho‐ERK
The presence of a high number of Ki67+ cells has been reported to be an effective way to distinguish melanomas from benign nevi 29. Further, mitogen‐activated protein kinase/extracellular signal regulated kinase (ERK) activation by phosphorylation (pERK) is an important cell survival pathway in melanoma cells 30. We observed a 7‐fold increase of Ki67 positive cells (Figure 3A) and increased pERK content in the TRP2high subset of MelanA+ cells, in comparison to control skin, consistent with transformation to melanoma in a subset of pigmented cells within nevi (Figure 3B).
A Subset of Nevi Continue to Grow in the Absence of Chronic Tumor Promotion Signals
To determine the role of TPA in driving and maintaining the tumor microenvironment, we compared the cellular composition of lesions 10 wk after cessation of TPA treatment at week 20. Flow cytometry of single cell suspensions prepared from treated skin at 20 wk detected high numbers of CD11b+ cells (32%) in comparison to normal skin (6%) (Figure 4A). The CD11c+ cells in pigmented lesions were reduced 2‐fold as compared normal and adjacent skin (Figure 4B). Following 10 wk without TPA treatment, we isolated cells from lesions and adjacent skin for phenotyping. The cellular infiltrate of lesional skin contained a significant increase in CD11b+ cells (18%), but fewer MHCII+ cells (14%) in comparison to the composition of lesion‐adjacent (7% CD11b+, 23% MHCII+ cells) and normal skin (7% CD11b+, 26% MHCII+ cells) (Figure 4B). Further, the lesions contained 10‐fold more myeloid‐derived suppressor cells (MDSCs) (CD11b+, Gr‐1+) and increased fraction of CD4+ and CD8low T‐cells numbers. (Figure 4 B). The percent of CD4+ Foxp3+ cells was also higher in the lesion compared with adjacent or normal skin (data not shown).
Figure 4.
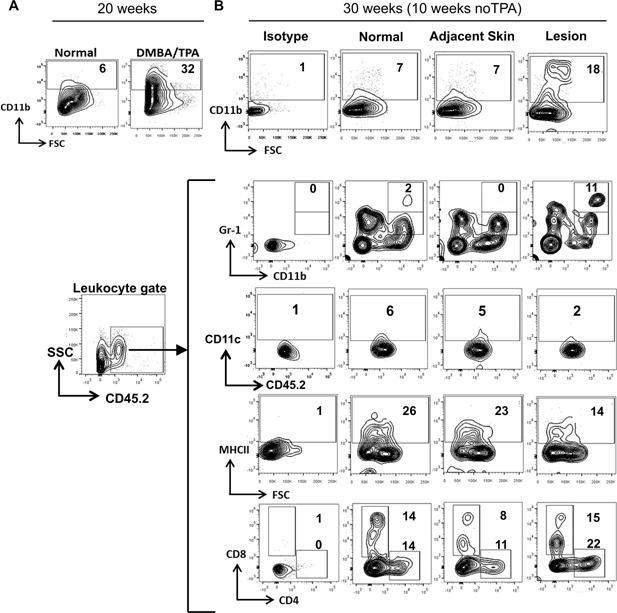
Inflammatory microenvironment around pigmented lesions. (A) DMBA/TPA treatment recruits CD11b+ cells to pigmented lesions. After 20 wk of treatment, mice were sacrificed and isolated lesions were processed as described. (B) A subset of treated mice were received no further TPA treatment for 10 wk. At 30 wk, pigmented lesions and adjacent skin were isolated as described. Skin tissue from untreated age‐matched control mice (normal) and treated mice (adjacent skin and pigmented lesions) were processed into single cell suspensions and stained for CD11b, CD11c, CD45.2, CD8, CD4, MHCII, and Gr‐1 as shown in the figure.
Migration of Pigmented Cells to the Lymph Nodes
To determine if any melanocytic cell metastasis occurred, we examined skin‐draining lymph nodes (LNs) from 30‐wk mice for the presence of pigmented cells and expression of melanoma‐related markers. H&E stained LNs from DMBA/TPA treated mice contained significant numbers of pigmented cells in the paracortex, rather than just the lymph nodes sinuses that are occasionally observed in TPA‐only treated or age‐matched control mice (Figure 5A). The photomicrographs of LNs from DMBA treated mice contain enhanced pigmentation as compared to controls (Figure 5B). All dLNs from treated mice contained some pigmented cells in the capsular sinuses; in addition, 15–20% of dLNs contained pigmented cells deep in the paracortex and cortex regions, indicative of more aggressive melanoma. In order to establish that these cells were not melanin‐laden macrophages, we co‐stained with the macrophage marker CD11b. Most of the pigmented cells were Tyr+, Trp2+, and/or S100+ but CD11b+ cells were distinct, confirming that pigmented cells were not melanophages (Figure 5C).
Figure 5.
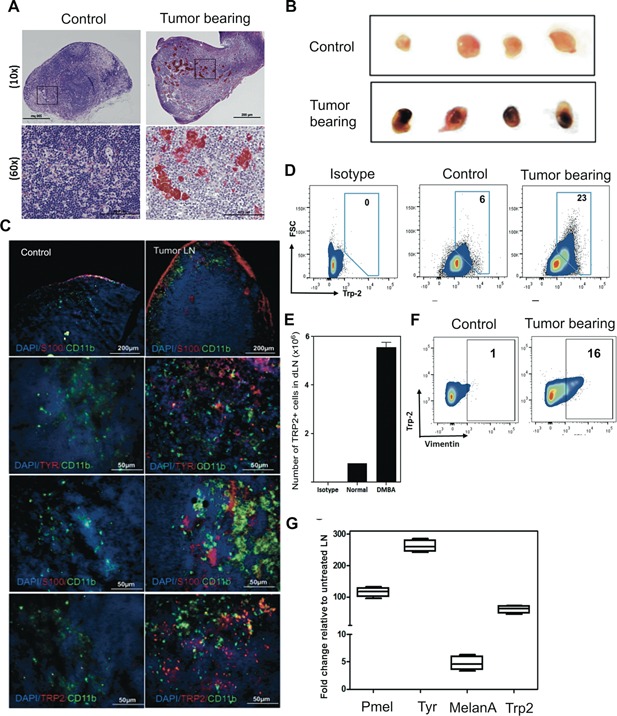
Melanocytic cell nests in dLNs of DMBA/TPA treated mice. (A) H&E stained LN sections and (B) the visual representation of LNs from both groups of mice. (C) Frozen sections (6μm) were stained with the indicated antibody to detect co‐localization of macrophages and tumor cells. (D–F) LN cells from mice stained with the indicated antibody. Total TRP2+ cell numbers present in four LN per mouse were calculated from at least two mice per group. (G) Increased melanocyte lineage gene expression in LNs of carcinogen treated mice as compared to TPA treated mice at week 30.
Next, we quantified melanocytic cell content in dLNs using flow cytometric analysis. LN cells from DMBA treated groups contained an increase in the percentage of Trp2+ cells, as compared to age‐matched controls (Figure 5D). The absolute numbers were nearly 6‐fold higher in dLNs of the DMBA treated groups than in control mice (Figure 5E). Further, Trp2+ cells contained vimentin+ cells, which is indicative of decreased differentiation (Figure 5F). Tpr2/Dct, MelanA, Tyr, and gp100/Pmel mRNA expression in LNs of the DMBA treated group was confirmed by qRT‐PCR analysis (Figure 5G).
Establishment of Long‐Term Melanocytic Cultures From Skin Lesions and LNs
To determine whether immortalized cells were present, we assessed the ability of skin biopsy tissue or individual LNs to generate melanocytic lines in culture. Continuous cell cultures were established from a subset of pigmented skin lesions, harvested at 30–wk, in a DMBA dose‐responsive manner (25% and 10% of individual nevi from mice treated with 100 and 50 μg DMBA, respectively) (Figure S1A). Further, up to 33% of LNs from DMBA treated mice gave rise to melanocytic cell cultures, also at a frequency related to DMBA dose (Figure S1B). The melanocytic origin of cell lines derived from nevi and LNs was confirmed by immunofluorescence staining with melanoma‐associated markers (Figure S2). Most of the cell lines expressed activated pERK, suggesting that survival signal pathways were established. We were unable to establish cell lines from the skin or LNs of mice chronically treated with TPA alone.
Tumorigenic Properties of Nevus‐Derived Melanoma Cell Lines
Anchorage‐independent growth in vitro is an important feature of metastatic potential 31. Therefore, we tested the capacity of nevus‐derived cell lines to grow as colonies in soft agar. We observed that early passage (<p3–5) cultured cell lines from nevi grew aggressively in soft agar, but normal melanocytes did not (Figure 6A–C and Table S1). Growth was less than, but comparable to control mouse melanoma B16F10 cells (Figure 6A–C). The tumorigenic potential of our cell lines was further assessed by their ability to grow as orthotopic tumors in immunodeficient NIH‐bg‐nu‐Xid mice. We observed that a majority of cell lines grew progressively in immunodeficient mice, confirming their tumorigenic potential in vivo (Figure 6D and summarized in Table S1). Furthermore, invasive metastatic properties were evident, since orthotopic tumors also metastasized to dLNs (Figure 6E). Moreover, following i.v. injection into nude mice cells grew readily in the lungs (Figure 6F and S3). These data provide evidence that nevus‐derived lines possess properties consistent with metastatic melanoma.
Figure 6.
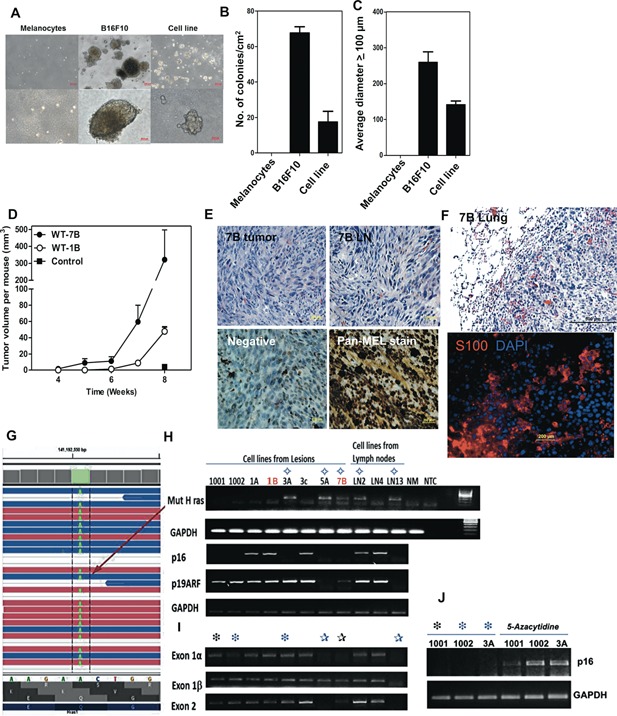
Tumorigenic potential of lesion‐derived cell lines. (A) Anchorage‐independent growth of pigmented lesion‐derived lines. (B, C) The number (B) and size (diameter in μm) (C) of colonies formed in soft agar per cm2. (D–F) Tumor growth and metastasis of a nevus‐derived cell line, 7B, in nude mice. (D) Tumor growth kinetics. (E) Tumor mass at site of s.c. injection (H&E stained, upper left panel). Note mitotic figure highlighted (red arrow); Lymph node metastasis (remaining panels; upper left, H&E stain). Immunoperoxidase staining of LN metastasis (lower panels) with secondary Ab only (lower left panel, Negative) and Pan‐Mel Ab mixture: HMB45, MART‐1, TYR (lower right panel). (F) Lung tumor growth in nude mice following i.v. injection of cell line 7B. H&E staining (top; mitotic figures highlighted with red arrowheads); Immunofluorescence S100 staining (bottom panel). (G) RNAseq analysis. A missense mutation in H‐Ras codon 61 changing Q‐>L (Q61L) was detected. (H–J) Screen for (H) expression of mutant H‐Ras (Q61L) and p16Ink4a/p19 Arf, (I) DNA deletion of p16Ink4a/p19Arf exons, and (J) epigenetic silencing of p16Ink4a as a mechanism for melanoma progression.
Melanoma Cell Lines Contain Genetic Abnormalities in Ras and p16 Ink4a
A representative cell line underwent RNA‐sequencing, which revealed the presence of an H‐Ras mutation at codon 61 (A–T), changing amino acid from Q to L (Q61L) (Figure 6G). In addition, the cell line sustained deletions in the tumor suppressor p16Ink4a gene (data not shown). Therefore, we screened for the expression of the activated mutant H‐Ras (Q61L) oncogene mRNA and for the loss of p16 Ink4a mRNA expression in our panel of cell lines, using an established allele‐specific competitive blocker—PCR (ACB‐PCR) and primer‐specific PCR, respectively (Figure 6H). More than half of the cell lines lost p16Ink4a expression (6/11) while a minority also lost p19Arf expression (2/11). Half of the cell lines without p16 Ink4a expression contained exon deletions in the locus (Figure 6I). Cells with an intact gene locus were able to re‐express p16Ink4a mRNA following culture with 5‐azacytidine, indicating the locus had undergone epigenetic silencing (Figure 6J). Interestingly, these genetic anomalies (i.e., H‐Ras [Q61L] mutation and loss of p16 Ink4a gene expression) were absent in 4 of 11 lines, suggesting that p16Ink4a may contain inactivating missense mutations or other mechanisms that lead to progression are involved. The data are summarized in Table S1.
DISCUSSION
Nevi are benign proliferative lesions of melanocytic origin that arise in both UV‐exposed and un‐exposed skin. They can be congenital as well as acquired, and are common in light‐skinned individuals with blond or light brown hair and blue or green eyes. Although the majority of melanocytic nevi are benign, a proportion can go on to become invasive melanomas. The immune factors responsible for their onset and their evolution into melanomas are not well understood. This lack of information is due, in part, to the lack of a suitable animal model with which to investigate this issue.
Tumors derived from our mouse model share many features of human nevi and melanoma. Gross examination of the skin revealed multiple pigmented, gradually enlarging, macules, and papules. Histologically, they resemble human melanocytic nevi. Immunohistochemical and flow cytometric analysis demonstrated that the neoplasms expressed melanoma‐associated proteins S100, MelanA, and Trp2; mRNA levels for Tyr were also increased over those in normal skin. While report that murine nevi do not progress to become melanomas 32, we found that the advanced lesions showed features indicative of invasive melanomas, including CCR7, Ki67, and pERK expression. These and vimentin positive cells were also detected in draining LNs. In absence of TPA the majority of lesions regressed; however, a subset of lesions continued to grow in a TPA‐independent manner, consistent with a fully transformed state. TPA increases ROS production and induces hyper‐proliferation of keratinocytes both in vitro and in vivo 33, 34. TPA activates PKC, which is important for DNA synthesis, production of eicosanoids, cytokines (e.g., TNFα) and growth factors, and affects cell‐cell interactions and communication 35, 36. The effects of TPA are reversible when limited to a few doses; however, prolonged application can promote irreversible genetic changes that lead to cell transformation and TPA‐independent tumor growth 36.
Proliferative cell lines were established from a subset of skin lesions and draining LNs. The lines exhibited anchorage independent growth in vitro, as well as tumor growth in nude mice. In addition, metastatic growth to lungs was observed when injected i.v. into nude and normal mice. Many, but not all of the cell lines exhibited genetic abnormalities, such as the loss of p16Ink4a and mutations in H‐Ras, which similar to loss of p16Ink4a expression and the N‐ras mutations that are associated with a significant proportion of human melanomas.
While there are several other animal models used to investigate the pathogenesis of melanoma, few trace the evolution of benign nevi into metastatic melanoma. The most common mouse model used to study melanoma has been the transplantable B16 melanoma cell line in congenic mice 37. Since this cell line is already a melanoma, it cannot be used to study melanoma initiation 38. Recent innovations in development of melanoma mouse models include the introduction of the human BRAFV600E transgene under Tyr promoter 39, 40. However, introduction of transgenes can have unpredictable effects 41. Further, the presence of these mutations from birth may lead specific tolerance to these mutations 42. Inducible mouse models are often crossed with knockout strains of p16 Ink4a or Pten gene expression to promote rapid development of melanoma and metastasis 43, 44. The hepatocyte growth factor/scatter factor (HGF/SF) transgenic mouse model is another well‐established model that develops melanoma as a consequence of a single prolonged exposure of UV during the neonatal stage 45. The initial DNA damage events and immune responsiveness to mutations acquired during the neonatal stage remain to be thoroughly investigated.
In this C3H/HeN model, not all melanocytes carry the same oncogenic mutation, as is the case with transgenic mouse models. Although there are differences between models in terms of time to onset and multiplicity, in addition to differences in immune recognition of oncogenes, these differences may reflect many factors: strain background differences and, importantly, the unpredictable effects of genetic engineering. The present model avoids the complexity and possibly immune skewing effects of neonatal DNA damage, and transgene introduction.
C3H/HeN mice develop cutaneous cell‐mediated immune responses to DMBA, in contrast to C57/BL6 (B6) mice, which are completely resistant to DMBA induced cell‐mediated contact hypersensitivity responses (Figure S4A). The C3H/HeN model provides the flexibility to study the role of immune surveillance at different steps of tumor development 46. This is a particularly appealing feature, given the fact that there has been success with the use of immunological approaches for the treatment of melanoma. We observed a significant increase in the incidence and size of nevi that developed in C3H/HeN mice, compared with B6 mice (Figure S4B–E). The migration of melanocytic cells to LNs is greater for C3H than B6. Further, a higher percentage of the lesions from C3H mice were able to generate continuous cell lines, in comparison to the lesions from B6 mice (Figure S4F).
It is well known that, in the absence of cooperating factors, single mutations in oncogenes are insufficient for malignant transformation and can lead to permanent growth arrest (senescence) and even apoptosis. 47, 48. As such, even when mutations common to melanomas are present, melanocytic nevi remain in a benign state for years and rarely progress to malignancy 5. Interestingly, the level of p16Ink4a mRNA expression gradually decreases as melanoma progresses from benign nevi to melanoma. Thus, there is a significant correlation between lack of p16Ink4a expression and metastasis [5,5, 8. Consistent with other studies, our results support the concept that p16Ink4a plays a pivotal role in growth arrest of nevi, inhibiting their progression to melanoma; however, other factors may also be involved.9, 49, 50, 51, 52
The cell lines we developed possessed similar characteristics to human melanomas. More than half contained mutations in H‐Ras, and lost p16 expression, similar to the genetically engineered H‐RasG12V p16Ink4a null C57BL/6 model 53. Although H‐Ras mutations are less frequently associated with human melanomas as N‐RAS mutations, the increased frequency of H‐Ras mutations in mice suggests that the downstream signaling pathway shared by H‐Ras and N‐Ras is what is critical for murine melanocytic cell transformation. The majority of cell lines expressed high levels of phosphorylated‐ERK, indicating activation of MAP kinase signal transduction, which is highly associated with p16Ink4a silencing. Importantly, 4 of 11 independent cell lines were negative for these commonly found genetic anomalies. Deep sequencing and RNA‐seq analysis of the cell lines and lesions may elucidate new mutations and mechanisms that contribute to nevus cell transformation. Since the incidence of nevi is often associated with an increased risk of melanoma, determining the genetic loci responsible for nevus formation as well as melanoma is of great interest. The quantitative trait loci (QTLs) can interact in a non‐additive manner, thus the knowledge of their interactions with one another and their effect on the disease will help understand how all these loci impact the disease jointly 54. Using animal models like this one can be of great value, to help understand and uncover candidate genes to be studied in humans 55.
Sunlight and artificial sources of UVR are important risk factors for the development of nevi and melanoma 56. Indeed, fewer melanocytic nevi develop in children that are regularly protected with sunscreen 57. It is clear, however, that sunlight is not the sole inductive stimulus for melanoma. Many individuals acquire nevi in sites that are shielded from the sun, or are present at or shortly after birth. We show that nevi can be generated by exposure to PAHs, and contain mutations similar to human nevi as well as melanomas. This raises the possibility that exposure to xenobiotics may be relevant in the initiation of nevus development, and their transformation into invasive melanoma 58. Thus, this model will be valuable for elucidating novel genetic and epigenetic alterations as well as the immunologic influences that drive pigment cell dysregulation and transformation.
Supporting information
Additional supporting information may be found in the online version of this article at the publisher's web‐site.
supporting information Figure S1: Assessment of immortalized melanocytic cells within skin lesions and draining LNs.
supporting information Figure S2: Melanocytic lineage of cell lines derived from pigmented skin lesions and LNs of DMBA/TPA treated mice.
supporting information Figure S3: Lung metastasis from orthotopic tumor transplant in nude mouse is tyrosinase positive.
supporting information Figure S4: C3H/HeN mice are more susceptible to melanoma development than C57BL/6 mice.
ACKNOWLEDGMENTS
We acknowledge the support of the Heflin Center Genomic Core and the Cancer Center Core (P30CA13148‐40), and the UAB Comprehensive Flow Cytometry Core of the Rheumatic Diseases Core Center, supported by NIH grants P30AR048311 and P30AI27667. These studies were supported by a VA‐merit Award (CAE, LT), the Skin Diseases Research Center NIAMS award P30 AR050948 (CAE, LT) and NIH NCI award R01 CA138988 (MA, LT).
Present address of Tahseen H. Nasti is Department of Immunology/Microbiology, Emory University, Atlanta, GA.
Laura Timares and Craig A. Elmets are co‐principal investigators.
Conflict of Interest: The authors state no conflict of interest.
REFERENCES
- 1. Bataille V, Kato BS, Falchi M. et al. Nevus size and number are associated with telomere length and represent potential markers of a decreased senescence in vivo. Cancer Epidemiol Biomarkers Prev 2007; 16:1499–1502. [DOI] [PubMed] [Google Scholar]
- 2. Newton Bishop JA, Harland M, Bishop DT. The genetics of melanoma: The UK experience. Clin Exp Dermatol 1998; 23:158–161. [DOI] [PubMed] [Google Scholar]
- 3. Bauer J, Garbe C. Acquired melanocytic nevi as risk factor for melanoma development. A comprehensive review of epidemiological data. Pigment Cell Res 2003; 16:297–306. [DOI] [PubMed] [Google Scholar]
- 4. Skowronek J, Filipiak K, Karas Z, Krenz RM, Wlodarczyk H. Examination of DNA‐ploidy in melanocytic nevi cells using video‐imaging cytometry. Pol J Pathol 1997; 48:37–41. [PubMed] [Google Scholar]
- 5. Michaloglou C, Vredeveld LC, Soengas MS. et al. BRAFE600‐associated senescence‐like cell cycle arrest of human naevi. Nature 2005; 436:720–724. [DOI] [PubMed] [Google Scholar]
- 6. Bauer J, Curtin JA, Pinkel D, Bastian BC. Congenital melanocytic nevi frequently harbor NRAS mutations but no BRAF mutations. J Invest Dermatol 2007; 127:179–182. [DOI] [PubMed] [Google Scholar]
- 7. van Dijk MC, Bernsen MR, Ruiter DJ. Analysis of mutations in B‐RAF, N‐RAS, and H‐RAS genes in the differential diagnosis of Spitz nevus and spitzoid melanoma. Am J Surg Pathol 2005; 29:1145–1151. [DOI] [PubMed] [Google Scholar]
- 8. Maldonado JL, Timmerman L, Fridlyand J, Bastian BC. Mechanisms of cell‐cycle arrest in Spitz nevi with constitutive activation of the MAP‐kinase pathway. Am J Pathol 2004; 164:1783–1787. [DOI] [PMC free article] [PubMed] [Google Scholar]
- 9. Walker GJ, Soyer HP, Terzian T, Box NF. Modelling melanoma in mice. Pigment Cell Melanoma Res 2011; 24:1158–1176. [DOI] [PubMed] [Google Scholar]
- 10. van Schanke A, van Venrooij GM, Jongsma MJ. et al. Induction of nevi and skin tumors in Ink4a/Arf Xpa knockout mice by neonatal, intermittent, or chronic UVB exposures. Cancer Res 2006; 66:2608–2615. [DOI] [PubMed] [Google Scholar]
- 11. Strickland FM, Muller HK, Stephens LC. et al. Induction of primary cutaneous melanomas in C3H mice by combined treatment with ultraviolet radiation, ethanol and aloe emodin. Photochem Photobiol 2000; 72:407–414. [DOI] [PubMed] [Google Scholar]
- 12. Romerdahl CA, Stephens LC, Bucana C, Kripke ML. The role of ultraviolet radiation in the induction of melanocytic skin tumors in inbred mice. Cancer Commun 1989; 1:209–216. [PubMed] [Google Scholar]
- 13. Nasti TH, Timares L. MC1R, eumelanin and pheomelanin: Their role in determining the susceptibility to skin cancer. Photochem Photobiol 2014; 88:1111–1125. [DOI] [PMC free article] [PubMed] [Google Scholar]
- 14. Elmets CA, Athar M, Tubesing KA, Rothaupt D, Xu H, Mukhtar H. Susceptibility to the biological effects of polyaromatic hydrocarbons is influenced by genes of the major histocompatibility complex. Proc Natl Acad Sci USA. 1998; 95:14915–14919. [DOI] [PMC free article] [PubMed] [Google Scholar]
- 15. Slominski A, Tobin DJ, Shibahara S, Wortsman J. Melanin pigmentation in mammalian skin and its hormonal regulation. Physiol Rev 2004; 84:1155–1228. [DOI] [PubMed] [Google Scholar]
- 16. Slominski A, Zmijewski MA, Pawelek J. L‐tyrosine and L‐dihydroxyphenylalanine as hormone‐like regulators of melanocyte functions. Pigment Cell Melanoma Res 2012; 25:14–27. [DOI] [PMC free article] [PubMed] [Google Scholar]
- 17. Slominski AT, Carlson JA. Melanoma resistance: A bright future for academicians and a challenge for patient advocates. Mayo Clin Proc 2014; 89:429–433. [DOI] [PMC free article] [PubMed] [Google Scholar]
- 18. Wang X, Seed B. A PCR primer bank for quantitative gene expression analysis. Nucleic Acids Res 2003; 31:e154–e161. [DOI] [PMC free article] [PubMed] [Google Scholar]
- 19. Utikal J, Maherali N, Kulalert W, Hochedlinger K. Sox2 is dispensable for the reprogramming of melanocytes and melanoma cells into induced pluripotent stem cells. J Cell Sci 2009; 122:3502–3510. [DOI] [PMC free article] [PubMed] [Google Scholar]
- 20. Nasti TH, Iqbal O, Tamimi IA, Geise JT, Katiyar SK, Yusuf N. Differential roles of T‐cell subsets in regulation of ultraviolet radiation induced cutaneous photocarcinogenesis. Photochem Photobiol 2011; 87:387–398. [DOI] [PMC free article] [PubMed] [Google Scholar]
- 21. Lecomte C, Andujar P, Renier A. et al. Similar tumor suppressor gene alteration profiles in asbestos‐induced murine and human mesothelioma. Cell Cycle 2005; 4:1862–1869. [DOI] [PubMed] [Google Scholar]
- 22. Greulich H, Chen TH, Feng W. et al. Oncogenic transformation by inhibitor‐sensitive and ‐resistant EGFR mutants. PLoS Med 2005; 2:e313. [DOI] [PMC free article] [PubMed] [Google Scholar]
- 23. Jiang W, Crossman DK, Mitchell EH, Sohn P, Crowley MR, Serra R. WNT5A inhibits metastasis and alters splicing of Cd44 in breast cancer cells. PLoS ONE 2013; 8:e58329. [DOI] [PMC free article] [PubMed] [Google Scholar]
- 24. Simonetti O, Lucarini G, Brancorsini D. et al. Immunohistochemical expression of vascular endothelial growth factor, matrix metalloproteinase 2, and matrix metalloproteinase 9 in cutaneous melanocytic lesions. Cancer 2002; 95:1963–1970. [DOI] [PubMed] [Google Scholar]
- 25. Emmett MS, Lanati S, Dunn DB, Stone OA, Bates DO. CCR7 mediates directed growth of melanomas towards lymphatics. Microcirculation 2011; 18:172–182. [DOI] [PMC free article] [PubMed] [Google Scholar]
- 26. Fang L, Lee VC, Cha E, Zhang H, Hwang ST. CCR7 regulates B16 murine melanoma cell tumorigenesis in skin. J Leukoc Biol 2008; 84:965–972. [DOI] [PMC free article] [PubMed] [Google Scholar]
- 27. Ben‐Ze'ev A, Raz A. Relationship between the organization and synthesis of vimentin and the metastatic capability of B16 melanoma cells. Cancer Res 1985; 45:2632–2641. [PubMed] [Google Scholar]
- 28. Ladstein RG, Bachmann IM, Straume O, Akslen LA. Ki‐67 expression is superior to mitotic count and novel proliferation markers PHH3, MCM4 and mitosin as a prognostic factor in thick cutaneous melanoma. BMC Cancer 2010; 10:140–155. [DOI] [PMC free article] [PubMed] [Google Scholar]
- 29. Jakobiec FA, Bhat P, Colby KA. Immunohistochemical studies of conjunctival nevi and melanomas. Arch Ophthalmol 2010; 128:174–183. [DOI] [PubMed] [Google Scholar]
- 30. Hwang CS, Prieto VG, Diwan AH. et al. Changes in pERK1/2 and pAKT expression in melanoma lesions after imatinib treatment. Melanoma Res 2008; 18:241–245. [DOI] [PMC free article] [PubMed] [Google Scholar]
- 31. Mori S, Chang JT, Andrechek ER, et al. Anchorage‐independent cell growth signature identifies tumors with metastatic potential. Oncogene 2009; 28:2796–2805. [DOI] [PMC free article] [PubMed] [Google Scholar]
- 32. Florell SR, Thomas J, Grossman D. Predominant formation of heavily pigmented dermal melanocytomas resembling 'animal‐type' melanomas in hepatocyte growth factor (C57BL/6 x C3H)F1 mice following neonatal UV irradiation. J Cutan Pathol 2007; 34:667–674. [DOI] [PMC free article] [PubMed] [Google Scholar]
- 33. Fischer SM, Baldwin JK, Adams LM. Effects of anti‐promoters and strain of mouse on tumor promoter‐induced oxidants in murine epidermal cells. Carcinogenesis 1986; 7:915–918. [DOI] [PubMed] [Google Scholar]
- 34. Klein‐Szanto AJ, Slaga TJ. Effects of peroxides on rodent skin: Epidermal hyperplasia and tumor promotion. J Invest Dermatol 1982; 79:30–34. [DOI] [PubMed] [Google Scholar]
- 35. Hennings H, Boutwell RK. Studies on the mechanism of skin tumor promotion. Cancer Res 1970; 30:312–320. [PubMed] [Google Scholar]
- 36. Rundhaug JE, Fischer SM. Molecular mechanisms of mouse skin tumor promotion. Cancers 2010; 2:436–482. [DOI] [PMC free article] [PubMed] [Google Scholar]
- 37. Fidler IJ, Nicolson GL. Organ selectivity for implantation survival and growth of B16 melanoma variant tumor lines. J Natl Cancer Inst 1976; 57:1199–1202. [DOI] [PubMed] [Google Scholar]
- 38. McKinney AJ, Holmen SL. Animal models of melanoma: A somatic cell gene delivery mouse model allows rapid evaluation of genes implicated in human melanoma. Chin J Cancer 2011; 30:153–162. [DOI] [PMC free article] [PubMed] [Google Scholar]
- 39. Goel VK, Ibrahim N, Jiang G. et al. Melanocytic nevus‐like hyperplasia and melanoma in transgenic BRAFV600E mice. Oncogene 2009; 28:2289–2298. [DOI] [PMC free article] [PubMed] [Google Scholar]
- 40. Dhomen N, Da Rocha Dias S, Hayward R. et al. Inducible expression of (V600E) Braf using tyrosinase‐driven Cre recombinase results in embryonic lethality. Pigment Cell Melanoma Res 2010; 23:112–120. [DOI] [PubMed] [Google Scholar]
- 41. Scharfenberger L, Hennerici T, Kiraly G, Kitzmuller S, Vernooij M, Zielinski JG. Transgenic mouse technology in skin biology: Generation of complete or tissue‐specific knockout mice. J Invest Dermatol 2014; 134:e16–e20. [DOI] [PubMed] [Google Scholar]
- 42. van Helden PM, Unterthurner S, Hermann C. et al. Maintenance and break of immune tolerance against human factor VIII in a new transgenic hemophilic mouse model. Blood 2011; 118:3698–3707. [DOI] [PubMed] [Google Scholar]
- 43. Dankort D, Curley DP, Cartlidge RA. et al. Braf(V600E) cooperates with Pten loss to induce metastatic melanoma. Nat Genet 2009; 41:544–552. [DOI] [PMC free article] [PubMed] [Google Scholar]
- 44. Milagre C, Dhomen N, Geyer FC. et al. A mouse model of melanoma driven by oncogenic KRAS. Cancer Res 2010; 70:5549–5557. [DOI] [PMC free article] [PubMed] [Google Scholar]
- 45. Noonan FP, Recio JA, Takayama H. et al. Neonatal sunburn and melanoma in mice. Nature 2001; 413:271–272. [DOI] [PubMed] [Google Scholar]
- 46. Elmets CA, Yusuf N, Hamza S. et al. Topical application of dimethylbenz[a]anthracene results in the generation of multiple melanocytic nevi in C3H/HeN mice. Toxicol Appl Pharmacol 2004; 195:355–360. [DOI] [PubMed] [Google Scholar]
- 47. Serrano M. The tumor suppressor protein p16INK4a. Exp Cell Res 1997; 237:7–13. [DOI] [PubMed] [Google Scholar]
- 48. Serrano M, Lin AW, McCurrach ME, Beach D, Lowe SW. Oncogenic ras provokes premature cell senescence associated with accumulation of p53 and p16INK4a. Cell 1997; 88:593–602. [DOI] [PubMed] [Google Scholar]
- 49. Dhomen N, Reis‐Filho JS, da Rocha Dias S. et al. Oncogenic Braf induces melanocyte senescence and melanoma in mice. Cancer Cell 2009; 15:294–303. [DOI] [PubMed] [Google Scholar]
- 50. Wajapeyee N, Serra RW, Zhu X, Mahalingam M, Green MR. Oncogenic BRAF induces senescence and apoptosis through pathways mediated by the secreted protein IGFBP7. Cell 2008; 132:363–374. [DOI] [PMC free article] [PubMed] [Google Scholar]
- 51. Santra MK, Wajapeyee N, Green MR. F‐box protein FBXO31 mediates cyclin D1 degradation to induce G1 arrest after DNA damage. Nature 2009; 459:722–725. [DOI] [PMC free article] [PubMed] [Google Scholar]
- 52. Ross AL, Sanchez MI, Grichnik JM. Nevus senescence. ISRN Dermatol 2011; 2011:642157:1–8. [DOI] [PMC free article] [PubMed] [Google Scholar]
- 53. Chin L, Pomerantz J, Polsky D. et al. Cooperative effects of INK4a and ras in melanoma susceptibility in vivo. Genes Dev 1997; 11:2822–2834. [DOI] [PMC free article] [PubMed] [Google Scholar]
- 54. Gomez‐Raya L, Okomo‐Adhiambo M, Beattie C, Osborne K, Rink A, Rauw WM. Modeling inheritance of malignant melanoma with DNA markers in Sinclair swine. Genetics 2007; 176:585–597. [DOI] [PMC free article] [PubMed] [Google Scholar]
- 55. Du ZQ, Vincent‐Naulleau S, Gilbert H. et al. Detection of novel quantitative trait loci for cutaneous melanoma by genome‐wide scan in the MeLiM swine model. Int J Cancer 2007; 120:303–320. [DOI] [PubMed] [Google Scholar]
- 56. Kelly JW, Rivers JK, MacLennan R, Harrison S, Lewis AE, Tate BJ. Sunlight: A major factor associated with the development of melanocytic nevi in Australian schoolchildren. J Am Acad Dermatol 1994; 30:40–48. [DOI] [PubMed] [Google Scholar]
- 57. Gallagher RP, Rivers JK, Lee TK, Bajdik CD, McLean DI, Coldman AJ. Broad‐spectrum sunscreen use and the development of new nevi in white children: A randomized controlled trial. JAMA 2000; 283:2955–2960. [DOI] [PubMed] [Google Scholar]
- 58. Mehlman MA. Causal relationship from exposure to chemicals in oil refining and chemical industries and malignant melanoma. Ann NY Acad Sci 2006; 1076:822–828. [DOI] [PubMed] [Google Scholar]
Associated Data
This section collects any data citations, data availability statements, or supplementary materials included in this article.
Supplementary Materials
Additional supporting information may be found in the online version of this article at the publisher's web‐site.
supporting information Figure S1: Assessment of immortalized melanocytic cells within skin lesions and draining LNs.
supporting information Figure S2: Melanocytic lineage of cell lines derived from pigmented skin lesions and LNs of DMBA/TPA treated mice.
supporting information Figure S3: Lung metastasis from orthotopic tumor transplant in nude mouse is tyrosinase positive.
supporting information Figure S4: C3H/HeN mice are more susceptible to melanoma development than C57BL/6 mice.