

Abstract
Metabolic syndrome (MetS) is a constellation of cardiometabolic abnormalities that commonly occur together and increase risk for cardiovascular disease and type II diabetes. Having MetS, especially during middle-age, increases the risk for dementia in later life. Abdominal obesity is a central feature of MetS; therefore, increased efforts to prevent obesity and identify predictors of weight gain are of extreme importance. Altered processing of food reward in the brain of obese individuals has been suggested to be a possible mechanism related to overeating. We scanned fifteen healthy middle-aged controls (aged 44–54) and sixteen middle-aged adults with MetS after a fast (hungry) and after a preload (sated), while they rated the pleasantness of sucrose (sweet) and caffeine (bitter) solutions. Data were analyzed using voxelwise linear mixed-effects modeling, and a region of interest analysis to examine associations between hypothalamic activation to sweet taste and BMI during hunger and satiety. The results indicate that middle-aged individuals with MetS respond with significantly less brain activation than controls without MetS during pleasantness evaluation of sweet and bitter tastes in regions involved in sensory and higher-level taste processing. Participants with higher BMI had greater hypothalamic response during pleasantness evaluation of sucrose in the sated condition. Importantly, this study is the first to document differential brain circuitry in middle-aged adults with MetS, a population at risk for poor physical and cognitive outcomes. Future research aimed at better understanding relationships among MetS, obesity, and brain function is warranted to better conceptualize and develop interventions for overeating in these disorders.
Keywords: Obesity, metabolic syndrome, taste, fMRI, hunger, satiety, reward, aging
1. Introduction
The metabolic syndrome (MetS) is a constellation of cardiometabolic abnormalities that tend to co-occur more often than would be expected by chance. The classification is used to identify individuals at increased risk for cardiovascular disease (CVD; Lakka et al., 2002) and type 2 diabetes mellitus (T2DM; Reaven, 1988), who are optimal candidates for behavioral, pharmaceutical and surgical interventions. The risk factors most commonly linked to MetS include insulin resistance, dyslipidemia (elevated triglyceride and low high-density lipoprotein [HDL] cholesterol levels), central obesity, elevated blood pressure, and impaired glucose tolerance or diabetes mellitus (See Table 1). MetS is highly prevalent in the United States, with approximately one-fifth of adults meeting criteria (Beltran-Sanchez et al., 2013). Additionally, not only is the syndrome associated with deleterious physical health outcomes, but having the MetS during middle age substantially increases the risk for future cognitive impairment and dementia (Kalmijn et al., 2000; Whitmer et al., 2005).
Table 1.
Criteria for clinical diagnosis of the metabolic syndrome (Alberti et al., 2009).
| Measure | Categorical Cut Points |
|---|---|
| Elevated waist circumference | Population and country-specific definitions |
| Elevated triglycerides (drug treatment for elevated triglycerides is an alternate indicator) ☛ | ≥ 150 mg/dL (1.7 mmol/L) |
| Reduced HDL-C (drug treatment for reduced HDL-C is an alternate indicator) ☛ | <40 mg/dL (1.0 mmol/L) in males <50 mg/dL (1.3 mmol/L) in females |
| Elevated blood pressure (antihypertensive drug treatment in a patient with a history of hypertension is an alternate indicator) | Systolic ≥130 and/or Diastolic ≥85 |
| Elevated fasting glucose (drug treatment of elevated glucose is an alternate indicator) | ≥100 mg/dL |
Abbreviations: HDL-C = high-density lipoprotein cholesterol.
The most commonly used drugs for elevated triglycerides and reduced HDL-C are fibrates and nicotinic acid. A patient taking 1 of these drugs can be presumed to have high triglycerides and low HDL-C. High-dose ω-3 fatty acids presumes high triglycerides.
Most patients with type 2 diabetes mellitus will have the metabolic syndrome by the proposed criteria
The underlying pathophysiological cause of MetS is still relatively unknown, despite a large body of literature on the topic. In debates among the World Health Organization (WHO), the National Cholesterol Education Program Adult Treatment Panel III (ATP, 2002), the International Diabetes Federation (IDF; Alberti, Zimmet, & Shaw, 2005 (Alberti et al., 2005), and the American Heart Association/National Heart, Lung and Blood Institute (AHA/NHLBI; Grundy et al., 2005) over how to diagnostically classify the syndrome, both abdominal obesity and insulin resistance have been proposed as primary mechanisms (Abbasi et al., 2002; Alberti et al., 2009; Despres, 2006). Given that abdominal obesity may be a central factor to development of the syndrome, and lifestyle factors including overconsumption of palatable food, play a significant role in the development of abdominal obesity, increased efforts to prevent obesity and to better understand why some individuals gain excessive weight are of extreme importance.
Food reward is a crucial factor involved in food consumption. Specifically, food reward is a complex integrative process that reflects a combination of flavor (taste, smell, texture, irritation), learned associations, and physiological state such as hunger and satiety (Berridge, 1996). The hedonic tone, or pleasantness of a stimulus is modulated by internal signals; thus, food is most pleasant to consume when hungry and decreases as an individual eats to satiety. (Cabanac, 1971).
The mesolimbic DA system modulates the experience of food reward and thus, plays an important role in energy intake (Martel and Fantino, 1996). DA release in the dorsal striatum facilitates feeding (Szczypka et al., 2001) and correlates with pleasantness ratings (Small et al., 2003). DA receptor agonists suppress appetite and lead to weight loss (Leddy et al., 2004; Towell et al., 1988), while DA antagonists tend to increase appetite and lead to weight gain (Baptista, 1999).
There is evidence to suggest that abnormal functioning of the DA system may underlie disordered eating in obesity. D2/D3 agonist administration greatly reduces rats’ preference for chocolate (Cooper and Al-Naser, 2006) and D2 receptor levels are decreased in the striatum of pathologically obese persons (Wang et al., 2001). Increased BMI is associated with a blunted striatal response to a chocolate milkshake (i.e., an olfactory-taste mixture) especially in individuals with the A1 allele of the Taq1A polymorphism of the DRD2 receptor gene (Stice et al., 2008a). Reduced activation during pleasantness evaluation of a sweet taste in the nucleus accumbens, caudate nucleus and amygdala is strongly related to higher BMI and waist circumference in older adults (Green et al., 2011).
The hypothalamus plays a crucial role in the maintenance of energy homeostasis through modulation of eating behavior, neuroendocrine function, and reward (Berthoud and Morrison, 2008). Hypothalamic nuclei integrate hormone and nutrient signals regarding an individual’s current state of energy balance. The arcuate nucleus of the hypothalamus is sensitive to the body’s state of energy balance (Berthoud and Morrison, 2008). The periventrical nucleus of the hypothalamus receives input from the arcuate nucleus, has widespread projections in the cortex, and is associated with neuroendocrine function and the hypothalamic-pituitary axis. The lateral hypothalamus receives inputs from the arcuate nucleus in addition to other regions involved in sensory processing, reward value, and learning and memory (OFC, nucleus accumbens, amygdala, ventral tegmental area, insula) and has widespread projections to the cortex (Berthoud, 2002). Activation of the lateral hypothalamus is strongly related to feeding behavior, and this region projects widely throughout the brain. Electrical stimulation of the hypothalamus in sated rats leads to feeding, which terminates once the stimulation is no longer present (Hettes et al., 2010; Stanley et al., 1993; Stanley et al., 1996). In normal, healthy young adults, hypothalamic activation is less following a preload than when fasted (Haase et al., 2009).
Although the literature suggests that obesity is related to altered processing of reward value in the brain, and obesity often precedes and likely contributes to development of the metabolic syndrome, there are currently no studies examining the potential for altered response to food reward in the brain of individuals with metabolic syndrome during hunger and satiety. To address this question, we used a paradigm that has been shown to activate gustatory (thalamus, insula) and higher-order reward regions (caudate, nucleus accumbens, orbitofrontal cortex) in young (Haase et al., 2009), middle-aged (Green et al., 2012), and older adults (Jacobson et al., 2010). In order to investigate the question of reward specifically, participants evaluated the pleasantness of two gustatory stimuli at different ends of the hedonic spectrum (sweet and bitter) during functional magnetic resonance imaging.
We hypothesized that during the physiological state of hunger, middle-aged adults with MetS would have decreased activation in reward-related brain regions (e.g., striatum) compared to healthy middle-aged adults during pleasantness evaluation of sweet taste. In contrast, we hypothesized that after a nutritional preload, compared to the control group, participants with MetS would have greater activation in brain regions modulated by hunger (e.g., hypothalamus) and reward processing regions (e.g., striatum) during pleasantness evaluation of a sweet taste.
Finally, the hypothalamus plays a crucial role in modulating energy balance and using the current paradigm, we have shown that hypothalamic activation to sweet taste is decreased after a nutritional preload compared to after a fast in healthy young adults (Haase et al., 2009). Additionally, in obese individuals the decrease in hypothalamic activation from hunger to satiety is attenuated (Matsuda et al., 1999). We aimed to test whether this phenomenon was also present in our sample of middle-aged adults with and without metabolic syndrome. We hypothesized that there would be no association between BMI and hypothalamic activation during the hunger condition, and that there would be a positive correlation between BMI and hypothalamic activation (as BMI increases, hypothalamic activation increases) during satiety.
2. Results
2.1. Demographics, Preliminary Psychophysics, and MetS Criteria
One-way ANOVAs revealed no differences between the two groups on age, odor threshold, taste threshold, or height (ps > 0.05; see Table 2). However, as expected, the groups significantly differed on weight (lbs), body mass index (BMI; kg/m2), waist circumference (cm), and mean systolic and diastolic blood pressure measurements (mmHg).
Table 2.
Participant demographics, psychophysics, and body measurements
| Mean (SE) | F | Significance | Partial Eta Squared | ||
|---|---|---|---|---|---|
| Healthy (N=15) | MetS (N=16) | ||||
| Age | 48.7 (0.8) | 50.6 (0.8) | 2.84 | p = 0.10 | η2 = 0.089 |
| Odor Threshold L | 7.2 (0.5) | 7.0 (0.3) | 0.12 | p = 0.73 | η2 = 0.004 |
| Odor Threshold R | 6.4 (0.4) | 6.8 (0.4) | 0.59 | p = 0.48 | η2 = 0.020 |
| Taste Threshold | 0.0033 (0.001) | 0.0060 (0.002) | 0.87 | p = 0.36 | η2 = 0.029 |
| Height (cm) | 170.53 (2.05) | 170.34 (2.45) | 0.004 | p = 0.95 | η2 < 0.001 |
| *Weight (lbs) | 162.6 (5.92) | 250.8 (7.33) | 86.27 | p < 0.001 | η2 = 0.748 |
| *BMI (kg/m2) | 25.25 (3.3) | 39.26 (2.2) | 85.06 | p < 0.001 | η2 = 0.746 |
| *Waist Circumference (cm) | 91.34 (3.30) | 121.33 (2.25) | 57.65 | p < 0.001 | η2 = 0.665 |
| *Systolic Blood Pressure (mmHg) | 122.9 (4.70) | 141.2 (2.57) | 12.10 | p = 0.002 | η2 = 0.294 |
| *Diastolic Blood Pressure (mmHg) | 76.1 (2.84) | 83.7 (1.89) | 5.16 | p = 0.03 | η2 = 0.151 |
2.1.1. Hunger and Taste Psychophysics
Psychophysical ratings of hunger, and the intensity and pleasantness of caffeine and sucrose were recorded at several times during the scanning sessions. On the hunger (i.e., no preload) day, psychophysical ratings were recorded prior to the participant entering the scanner (after a 12-hour fast) and after the scan. On the satiety (i.e., preload) day, psychophysical ratings were recorded three times: (1) at the beginning of the session, after the 12-hour fast and prior to consuming the preload; (2) after consuming the preload, prior to the scan; and (3) post-scan. Mean psychophysical ratings of hunger, intensity, and pleasantness are displayed separately for the hunger and satiety conditions, respectively (see Tables 3 and 4).
Table 3.
Psychophysical ratings of hunger and taste (hunger condition)
| Mean (SE) | |||
|---|---|---|---|
| Controls (n=15) | MetS (n=15) | ||
| Hunger Pre-Scan | 29.73 (6.21) | 40.2 (6.44) | |
| Hunger Post-Scan | 32.67 (7.12) | 30.0 (7.42) | |
|
| |||
| Intensity | Caffeine Pre-Scan | 42.47 (7.84) | 32.27 (5.52) |
| Caffeine Post-Scan | 45.47 (8.00) | 39.13 (6.68) | |
| Sucrose Pre-Scan | 40.46 (6.49) | 37.00 (4.57) | |
| Sucrose Post-Scan | 41.07 (5.31) | 38.67 (5.89) | |
|
| |||
| Pleasantness | Caffeine Pre-Scan | 38.13 (3.80) | 38.40 (2.90) |
| Caffeine Post-Scan | 33.00 (4.36) | 33.93 (3.33) | |
| Sucrose Pre-Scan | 59.23 (3.95) | 60.60 (3.17) | |
| Sucrose Post-Scan | 56.00 (2.64) | 61.33 (2.21) | |
Table 4.
Psychophysical ratings of hunger and taste (satiety condition)
| Mean (SE) | |||
|---|---|---|---|
| Controls (n=15) | MetS (n=16) | ||
| Hunger Pre-Preload | 38.93 (7.15) | 42.03 (7.15) | |
| Hunger Post-Preload | 3.27 (1.93) | 3.88 (1.93) | |
| Hunger Post-Scan | 3.07 (2.56) | 5.00 (2.56) | |
|
| |||
| Intensity | Caffeine Pre-Preload | 43.73 (7.48) | 30.50 (3.15) |
| Caffeine Post-Preload | 47.92 (8.08) | 40.31 (6.60) | |
| Caffeine Post-Scan | 47.13 (8.22) | 41.25 (6.18) | |
| Sucrose Pre-Preload | 37.07 (5.16) | 35.00 (5.81) | |
| Sucrose Post-Preload | 37.28 (5.79) | 29.75 (5.11) | |
| Sucrose Post-Scan | 42.67 (6.15) | 42.94 (4.90) | |
|
| |||
| Pleasantness | Caffeine Pre-Preload | 37.87 (4.08) | 39.31 (2.37) |
| Caffeine Post-Preload | 34.31 (4.06) | 36.94 (3.98) | |
| Caffeine Post-Scan | 27.07 (4.61) | 37.31 (3.92) | |
| Sucrose Pre-Preload | 61.53 (1.94) | 57.69 (2.73) | |
| Sucrose Post-Preload | 60.53 (2.44) | 53.75 (3.47) | |
| Sucrose Post-Scan | 59.47 (4.10) | 58.44 (3.47) | |
2.1.1.1. Hunger Ratings
Hunger ratings were examined in both the hunger and satiety conditions using a mixed-model design with MetS and time (hunger session: pre- or post-scan; satiety session: prior to consuming the preload, post-preload consumption, and post-scan) as explanatory variables. During the hunger condition, there was no effect of time F(1, 28) = 0.89, p = 0.35, partial η2 = 0.03 or metabolic syndrome, F(1, 28) = 0.20, p = 0.67, partial η2 = 0.007, on hunger ratings. There was also no significant time by metabolic syndrome interaction on hunger ratings, F(1, 28) = 2.91, p = 0.10, partial η2 = 0.09.
A separate analysis was run on hunger ratings during the satiety condition. The analysis revealed a significant main effect of time/preload on hunger ratings in this condition, F(2, 28) = 57.63, p < 0.001, partial η2 = .67. Participants were significantly less hungry post preload (M = 3.63, SE = 5.06) and post-scan (M = 4.03, SE = 1.81) than after the 12-hour fast (M = 41.05, SE = 5.06). The hunger ratings post-preload did not differ across groups.
2.1.1.2. Intensity Ratings
Intensity of the sucrose and caffeine were also examined separately for each session using mixed model ANOVAs with metabolic status, taste (sucrose or caffeine), and time (pre- or post-scan for the hunger condition, and prior to consuming the preload, post-preload consumption, and post-scan for the satiety condition) as explanatory variables. In the hunger condition, there were no main or interaction effects (ps > 0.05).
During the satiety session, there was a significant main effect of time, F(2, 29) = 3.85, p = 0.028, partial η2 = 0.13, and a significant time by taste interaction, F(2, 29) = 4.21, p = 0.02, partial η2 = 0.14. Intensity ratings of sucrose, but not caffeine, increased significantly between the 2nd time point (post-preload consumption; M = 33.57, SE = 3.85) and 3rd time point (post-scan; M = 44.16, SE = 4.09).
2.1.1.3. Pleasantness Ratings
Pleasantness ratings of the taste stimuli were also examined separately for the hunger and satiety conditions using mixed-model ANOVAs with metabolic status, taste (sucrose or caffeine), and time (pre- or post-scan for the hunger condition, and prior to consuming the preload, post-preload consumption, and post-scan for the satiety condition) as explanatory variables. In the hunger condition, there were no main effects of time, F(1, 28) = 2.28, p = 0.142, partial η2 = 0.08, or MetS, F(1, 28) = 0.57, p = 0.46, partial η2 = 0.02. There were also no significant interactions between time and MetS, F(1, 28) = 0.34, p = 0.57, partial η2 = 0.01, taste and MetS, F(1, 28) = 0.22, p = 0.65, partial η2 = 0.01, or time, taste, and MetS, F(1, 28) = 0.23, p = 0.64, partial η2 = 0.01. There was a significant effect of taste on pleasantness ratings, F(1, 28) = 62.45, p < 0.001, partial η2 = 0.69. As expected, sucrose was rated as more pleasant (M = 59.29, SE = 2.17) than caffeine (M = 35.87, SE = 1.76) controlling for time and MetS.
2.2. Neuroimaging Results
2.2.1 Whole Brain Analyses
There were no significant changes in activation from the hunger to satiety condition in either the control or MetS group during pleasantness evaluation of caffeine. In the MetS group, there were also no significant changes in activation from the hunger to satiety conditions during pleasantness evaluation of sucrose. However, in the control group during pleasantness evaluation of sucrose, there was a significant reduction in activation from hunger to satiety in one region of the left superior frontal gyrus extending into the left middle frontal gyrus and anterior cingulate. There was also a significant increase in activation from hunger to satiety in a region of the left precuneus extending into the posterior cingulate and cingulate gyrus (See Table 5).
Table 5.
Differences in activation from hunger to satiety conditions.
| Region | Hem. | TLRC | # Voxels | Max Int. | ||
|---|---|---|---|---|---|---|
| x | y | z | ||||
| SUCROSE | ||||||
| Hunger-Satiety: Control | ||||||
| Precuneus | L | −7 | −49 | 32 | 32 | 0.41 |
| Posterior Cingulate | L | |||||
| Cingulate Gyrus | L | |||||
| Superior Frontal Gyrus | L | −22 | 44 | 14 | 23 | −0.36 |
| Medial Frontal Gyrus | L | |||||
| Middle Frontal Gyrus | L | |||||
| Anterior Cingulate | L | |||||
|
| ||||||
| Hunger-Satiety: MetS | ||||||
| None | ||||||
| CAFFEINE | ||||||
| Hunger-Satiety: Control | ||||||
| None | ||||||
| Hunger-Satiety: MetS | ||||||
| None | ||||||
Abbreviations: Hem = hemisphere; TLRC = Talairach atlas coordinates; Max Int = T statistic for maximum intensity voxel in cluster (positive values suggest greater activation in hunger relative to satiety condition whereas negative values indicate greater activation in satiety relative to the hunger condition.)
The results of the linear mixed-effects modeling analysis of brain activation during evaluation of pleasantness in the hunger condition, including the main effect of MetS, the main effect of taste, and the taste by MetS interaction, are listed in Table 6. Statistical maps of clusters reaching significance are illustrated in Figure 1. A main effect of MetS (1a: Control group > MetS group) was revealed in four regions including: (1) the right lentiform nucleus, putamen, insula, and pre/postcentral gyrus; (2) right inferior temporal gyrus/Brodmann Area (BA) 20 and fusiform gyrus; (3) left cerebellum; and (4) left superior temporal gyrus and insula. There was also a main effect of taste (See 1b). Sucrose activated the bilateral anterior cingulate and right medial frontal gyrus to a greater extant than caffeine. In contrast, activation during pleasantness evaluation of caffeine was greater in the right paracentral lobule, left cingulate gyrus, and left lingual gyrus. There was no metabolic status by tastant interaction on brain activation during the hunger condition.
Table 6.
Main and interaction effects during hunger.
| Direction of Response | Brain Region Activated | Hem | TLRC Coordinates | # Voxels | F statistics for maximum intensity voxel | ||
|---|---|---|---|---|---|---|---|
| Control >MetS | |||||||
| Lentiform Nucleus/Putamen | R | 29 | −7 | 14 | 31 | 15.16 | |
| Insula | R | 42 | −8 | 10 | |||
| Precentral Gyrus | R | 51 | −14 | 13 | |||
| Postcentral Gyrus | R | 52 | −9 | 15 | |||
| Inferior Temporal Gyrus/BA 20 | R | 53 | −52 | −13 | 29 | 21.08 | |
| Fusiform Gyrus | R | 52 | −50 | −15 | |||
| Cerebellem (Culmen) | L | −16 | −55 | −22 | 29 | 15.91 | |
| Cerebellem (Declive) | L | −14 | −60 | −22 | |||
| Superior Temporal Gyrus/BA 42 | L | −61 | −28 | 14 | 24 | 14.02 | |
| Insula | L | −36 | −22 | 17 | |||
| Main Effect of Taste | |||||||
| Sucrose > Caffeine | |||||||
| Anterior Cingulate | R | 14 | 35 | 5 | 65 | 19.17 | |
| Medial Frontal Gyrus/BA 10 | R | 6 | 48 | −4 | |||
| Anterior Cingulate | L | −4 | 29 | 5 | 24 | 16.01 | |
| Caffeine > Sucrose | Paracentral Lobule | R | 5 | −16 | 44 | 29 | 18.58 |
| Cingulate Gyrus | L | −3 | −9 | 41 | |||
| Lingual Gyrus | L | −7 | −64 | 2 | 24 | 11.93 | |
| MetS x Taste Interaction | |||||||
| *No interaction* | |||||||
Abbreviations: L = left; R = right, Hem = hemisphere, BA = Brodmann Area.
Figure 1.

Main effects of metabolic syndrome and taste: (a) Statistical map of the main effect (F values) of metabolic syndrome during hunger (controls > MetS) in left cerebellum(1), right inferior temporal gyrus/BA 20, fusiform gyrus(2), right lentiform nucleus, insula, putamen(3), and left superior temporal gyrus/BA 42, insula(4). (b) Statistical map of the main effect (F values) of taste, during hunger, in the left anterior cingulate (sucrose > caffeine)(5), right paracentral lobule and left cingulate gyrus (caffeine > sucrose)(6), left lingual gyrus (caffeine > sucrose)(7), and right anterior cingulate and Brodmann Area 10 (sucrose > caffeine)(8). (c) Statistical map of the main effect of metabolic syndrome during satiety. Healthy controls demonstrated greater activation than the group with MetS in the right prefrontal cortex/Brodmann Area 10(1) and Cerebellum(2).
The results of the linear mixed-effects modeling analysis for the satiety condition, including the main effect of MetS, the main effect of taste, and the taste by MetS interaction, are listed in Table 7. Statistical maps of clusters reaching significance are illustrated in Figure 1c.
Table 7.
Main and interaction effects during satiety.
| Direction of Response | Brain Region Activated | Hem | TLRC Coordinates | # Voxels | F statistics for maximum intensity voxel | ||
|---|---|---|---|---|---|---|---|
| x | y | z | |||||
| Main Effect of MetS | |||||||
| Control >MetS | |||||||
| Cerebellum (Declive) | L | −4 | −67 | −13 | 83 | 12.29 | |
| Declive | R | 7 | −66 | −14 | |||
| Culmen | L | −11 | −54 | −16 | |||
| Culmen | R | 29 | −57 | −21 | |||
| Superior Temporal Gyrus/BA 10 | R | 14 | 65 | 14 | 21 | 14.53 | |
| Main Effect of Taste | |||||||
| *No main effect of taste* | |||||||
| MetS x Taste Interaction | |||||||
| *No interaction* | |||||||
Abbreviations: L = left; R = right, Hem = hemisphere, BA = Brodmann Area.
There were no significant main effects of taste or interaction between metabolic status and taste during the satiety condition. However, there was a significant effect of metabolic syndrome (control > MetS) in the bilateral cerebellum and a region of the right superior temporal gyrus and BA 10.
2.2.2 Association of Hypothalamus Activation and Adiposity
When all participants were included in the analysis, there were no significant correlations between hypothalamic activation during pleasantness evaluation of sucrose and BMI in either the hunger or satiety condition. However, given that insulin receptors are densely expressed in the hypothalamus (Schulingkamp, Pagano, Hung & Raffa, 2000) and participants with T2DM potentially represent a distinct subset of the group with MetS, we also chose to run the analyses excluding these participants. When excluding the participants with T2DM, the Pearson product moment correlation (r = .63, p = .001) between BMI and hypothalamic activation during pleasantness evaluation of sucrose in the sated state was significant and is displayed in Figure 2. A positive correlation indicates that higher BMI (suggestive of greater levels of adiposity) is related to greater activation in the hypothalamus when participants were sated. Of note, this correlation was significant when participants with T2DM were excluded from the analysis. There was no significant association between BMI and hypothalamic activation during sucrose evaluation in a physiological state of hunger, regardless of whether participants with T2DM were included in the analysis. (p > .05)
Figure 2.
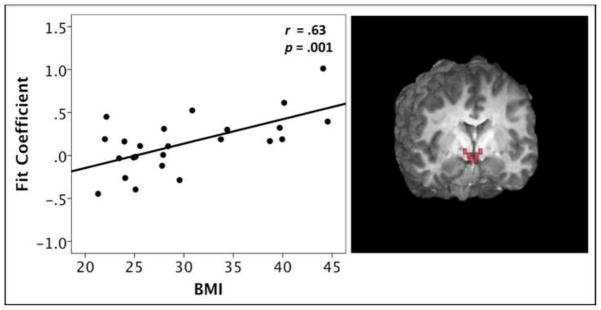
Positive Pearson correlation between BMI and hypothalamus (ROI) activation during pleasantness evaluation of sucrose, while in the sated condition
3. Discussion
Both obesity and the MetS are highly prevalent conditions in the United States. In addition to increasing risk for CVD and T2DM, the MetS has also been linked to cognitive decline in late life (Kalmijn et al., 2000; Whitmer et al., 2005) and increased risk for ischemic stroke, periventricular hyperintensities, and subcortical white matter lesions (WMLs; Bokura et al., 2008; Kwon et al., 2006; Kwon et al., 2009; Park et al., 2008). Given that over one third of the U.S. adult population is obese (Flegal et al., 2012), and abdominal obesity is a central factor for the development of MetS, better characterizing and identifying who is at risk for these conditions has become increasingly important.
Previous studies suggest that an altered response in reward-related brain circuitry may underlie disordered eating and obesity (Green et al., 2011; Stice et al., 2008a). However, this phenomenon has not yet been explored in obese middle-age individuals with MetS, a population at risk for poor physical and cognitive outcomes. To address this, we scanned 15 middle-aged healthy controls and 16 middle-aged adults with MetS to investigate potential differences in brain responses according to metabolic status during pleasantness evaluation of sweet and bitter tastes.
3.1 Psychophysical Ratings of Hunger, Intensity and Pleasantness
We collected subjective ratings of hunger, taste intensity and taste pleasantness at several time points during the scanning sessions. With regard to hunger, the nutritional preload was successful in decreasing hunger prior to entering the scanner for all participants. There were no significant differences in ratings of hunger between the control and MetS group at any time point. Interestingly, the mean hunger rating pre-scan (during the hunger condition) was approximately 30 for controls and 40 for the group with MetS. However, these means did not differ statistically due to a large amount of variability within each group (i.e., standard deviations were 30.36 and 18.68 for control and MetS, respectively).
There were no group differences between intensity ratings of either taste. There were also no group differences in pleasantness ratings. Both groups rated the sucrose between “moderately pleasant” and “strongly pleasant”. Additionally, both groups rated caffeine as “strongly unpleasant”.
Overall, the control and MetS groups did not significantly differ on subjective ratings of hunger, taste intensity, or pleasantness. Although no differences in subjective ratings of pleasantness were reported, there were group differences in activation of brain regions involved in processing pleasure (lentiform nucleus, putamen). We speculate that this suggests that there are group differences in the neural processing of rewarding taste stimuli, and that these differences may not be sufficiently captured by subjective ratings.
Several groups have reported that pleasantness ratings correlate with brain activation or dopamine release in healthy young adults (Small, Jones-Gotman, & Dagher, 2003; Kringelbach, O’Doherty, & Rolls, 2003; Rolls Kringelbach, & de Araujo, 2003). However, in individuals with differing genetic status (Felsted, Ren, Chouinard-Decorte & Small, 2010), different age groups including middle-aged (Green et al., 2012) and older adults (Jacobson et al., 2011), as well as populations characterized by altered eating behavior such as obesity (Green et al., 2011) and recovered anorexics (Cowdrey, Park, Harmer, & McCabe, 2011), links between pleasantness ratings and brain activation may be disrupted and activation of reward-related brain regions may not correlate with pleasantness ratings (Green et al., 2011).
FMRI activation typically captures group differences in pleasantness that are not apparent from subject ratings. We speculate that obese persons may be reluctant to report that they find sweet stimuli highly pleasant. Additionally, there is significant noise involved in the measurement of pleasantness using verbal ratings. Measuring the fMRI response during pleasantness evaluation may produce differing results than verbal ratings because fMRI does not include the subjectivity inherent in self-report of pleasantness.
3.2. Differences in fMRI Activation From Hunger to Satiety
Within subjects analyses revealed that in the control group, there were differences in activation according to physiological state (hunger v. satiety) during pleasantness evaluation of sucrose. Specifically, there was a reduced response in the satiety, relative to the hunger condition in the left precuneus, and a greater response during the satiety condition in a left frontal region including the superior and middle frontal gyrus and anterior cingulate. This is consistent with previous research from our group using this paradigm. Specifically, we have previously reported differential processing of pure tastes according to hunger condition (Haase et al., 2007; Haase et al., 2009; Haase et al., 2011; Jacobson et al., 2010).
Of interest, there were no differences in fMRI activation according to physiological state in the MetS group. We speculate that this may suggest that there is inefficient functioning of the central satiety system in the MetS individuals such that they are not demonstrating the expected difference in activation from the hunger to satiety condition.
3.3 Reduced Activation of Dopaminergic Reward Circuitry in MetS
Participants with MetS demonstrated less brain activation during pleasantness evaluation of taste stimuli in the hunger condition relative to the control group in regions involved with sensory processing of taste information (pre- and postcentral gyri, insula), and reward value (lentiform nucleus, putamen). The latter regions are part of the basal ganglia complex that receive dopaminergic projections from midbrain nuclei and are involved in higher-level processing of gustatory information such as reward value. Dopamine modulates the experience of reward, and decreased dopamine efficiency has been implicated in overeating (Wang et al., 2009). The current results suggest less activation of reward-related brain regions in individuals with MetS during the physiological state of hunger. Interestingly, this effect was significant regardless of stimulus valence (both bitter and sweet tastes).
These findings are consistent with previous research suggesting that having greater amounts of visceral fat is associated with a suppressed reward response. It has been hypothesized that this blunted reward response may be related to overeating, and/or down regulation of dopamine receptors. We have previously documented very strong, negative correlations between adiposity and brain activation of the caudate, nucleus accumbens, and amygdala in older adults rating the pleasantness of sucrose (Green et al., 2011). Additionally, negative associations between adiposity and activation of reward regions to flavor have also been reported in young adults and adolescents (Stice et al., 2008a; Stice et al., 2008b). Notably, carrying the A1 allele of the Taq1A polymorphism of the DRD2 gene is associated with a stronger link between striatal activation to a milkshake and BMI. The A1 allele has been linked to alcoholism, obesity, and reduced D2 receptors/compromised striatal dopamine signaling. This suggests that inefficient dopamine function in the striatum may be related to disorders characterized by overconsumption (Blum et al., 1990; Noble et al., 1991; Noble et al., 1994).
3.4. Cerebellum
During both physiological conditions, there was less activation of the cerebellum in the group with MetS compared to the healthy control group. Although previously considered to be mainly involved in motor function, there is also a body of research implicating the cerebellum as playing a key role in autonomic function, including food intake and energy homeostasis (Cavdar et al., 2001; Dietrichs, 1984; Wen et al., 2004; Zhu et al., 2004; Zhu and Wang, 2008). Anatomically, there are direct bidirectional connections between the cerebellum and the hypothalamus (Cavdar et al., 2001; Dietrichs, 1984; Dietrichs and Haines, 1984; Dietrichs et al., 1992). Additionally, there are indirect cerebellar-hypothalamic connections via taste/feeding and higher-order emotion/limbic regions (e.g., nucleus of the solitary tract, amygdala, neocortex).
The cerebellum is consistently activated in response to taste and olfactory stimuli (Cerf-Ducastel and Murphy, 2001; Cerf-Ducastel et al., 2012; Haase et al., 2009; Jacobson et al., 2010; Sobel et al., 1998) and activation to food-related stimuli is modulated by hunger (Gautier et al., 2001; Haase et al., 2009; Haase et al., 2011; Liu et al., 2000; Tataranni et al., 1999). Interestingly, the decrease in regional cerebral blood flow from hunger to satiety in the cerebellum is greater in obese relative to lean men (Gautier et al., 2000). The current study yields novel information that is supported by a growing body of literature suggesting altered activity of the cerebellum during hunger and satiety in individuals with differing levels of adiposity.
3.5. Frontopolar cortex
After a nutritional preload, the group with MetS also demonstrated less frontal (BA 10) and cerebellar activation during pleasantness evaluation of the tastes. One theory of BA 10 function implicates the region in the selection and maintenance of abstract internal goals while other goals are being performed (Badre and D’Esposito, 2007; Burgess et al., 2007; Gilbert et al., 2005; Koechlin and Summerfield, 2007) and in monitoring of internal states and stimuli (Christoff and Gabrieli, 2000). Providing pleasantness ratings requires a participant to sense the taste and note any relevant characteristics (quality, intensity, learned associations, etc.) prior to using a joystick to record their pleasantness judgment. Greater activation of BA 10 in the control group may suggest that this population utilizes more cognitive resources involved in integrating internal information (including his or her current state of energy balance) in making hedonic judgments. Grabenhorst and Rolls (2011) have proposed that area 10 is involved in transforming hedonic judgments into choices that ultimately guide behavior. A group more attune to internal information might be more successful in refraining from emotional eating in the absence of physiological hunger.
3.6. Fusiform Gyrus
A main effect of MetS was also demonstrated in the fusiform gyrus; specifically the control group had greater activation than the MetS group. The fusiform gyrus is consistently activated in neuroimaging studies using taste stimulation and pleasantness evaluation (Haase et al., 2009; Haase et al., 2011; Jacobson et al., 2010), visual food cues (Frank et al., 2010; Heni et al., 2013; Killgore and Yurgelun-Todd, 2007; Siep et al., 2009; van der Laan et al., 2011), and is often discussed as aiding the visual system in discrimination of high from low calorie foods. Additionally, greater activation of this region is observed after intranasal insulin administration (Guthoff et al., 2010), and obese individuals demonstrate less activation in this region than lean individuals (Frank et al., 2013). Finally, structural differences according to BMI in the fusiform gyrus have also been reported (Yokum et al., 2012), suggesting altered processing of food stimuli in this region in obese and insulin-resistant individuals.
3.7. Associations Between Hypothalamus Activation and Adiposity
Associations between adiposity and hypothalamic activation in response to food-related stimuli during hunger and satiety have not yet been examined in middle-aged adults. When correlations between BMI and hypothalamic activation during pleasantness evaluation of sucrose were run without participants with T2DM, there were no significant associations when participants were hungry, but hypothalamic activation was positively correlated with BMI when participants were sated. In other words, after consuming a 700kcal preload, participants with higher levels of adiposity demonstrated greater activation of the hypothalamus in response to a nutritive taste stimulus (sucrose). This correlation was not significant when participants with T2DM were included in the analysis suggesting that this phenomena may only relate to individuals without severe levels of insulin resistance.
This relationship between obesity and increased activation of the hypothalamus during satiety is significant given the crucial role of these nuclei in integrating hormone and nutrient signals regarding an individual’s current state of energy balance. In healthy participants, activation of the hypothalamus is decreased immediately following a preload (Haase et al., 2009; Liu et al., 2000; Smeets, de Graaf, Stafleu, van Osch, & van der Grond, 2005; Smeets et al., 2007), but this effect is less in obese individuals (Matsuda et al., 1999). In our sample, participants with larger BMIs had a stronger BOLD response in the hypothalamus during the satiety condition, which we speculate could be related to a smaller decrease in activation from hunger to satiety, although we did not directly measure this. Moreover, a greater hypothalamic response to food-related stimuli during satiety in obese middle-aged adults could suggest an inadequate modulation of hunger by hormones acting on the hypothalamus, and/or an adaptation to chronic overeating. It will be important for future studies to investigate this in more detail and using longitudinal models.
Alterations in hypothalamic response to a sweet taste in participants with greater levels of adiposity may be an indication of deficiencies in signaling long-term energy stores (i.e., leptin and/or insulin resistance) or short-term energy needs. High circulating leptin and insulin after a meal and in individuals with higher levels of body fat should serve to reduce the reward response. Deficiencies in nutrient signaling might lead to a disconnection between gastrointestinal signals of energy availability and CNS regulation of hunger. In addition, obese individuals may not be cognizant of or reactive to satiety signals, which may result in eating beyond satiety. An altered hypothalamic response after consuming a meal in these individuals may be a result of chronic overeating.
There are limitations to the study that warrant discussion. Our groups were not matched on gender. There is some evidence that gender is associated with differential processing of taste during hunger and satiety, and in response to taste stimuli, we have observed greater decreases in activation from hunger to satiety in healthy young adult males relative to females in frontal (BA 10) and reward/limbic brain regions (dorsal striatum, amygdala; Haase et al., 2011). The current study had insufficient power to test the effect of gender. In future studies of middle-aged adults with and without metabolic syndrome, it will be of interest to examine effects of gender on brain activation in response to tastes during the physiological states of hunger and satiety. Additionally, we included six subjects with a diagnosis of T2DM in the “MetS” group. Future research should examine differences in brain response to taste between individuals with MetS who do and do not meet criteria for T2DM. Finally, because the purpose of the threshold screening was to eliminate ageusics, we screened for ageusia using a sweet taste threshold task (Murphy et al., 1990), and we did not collect data regarding bitter taste thresholds. However, the groups had equivalent intensity ratings for the sweet and bitter stimuli presented in the study, and all participants were able to detect the tastes and make pleasantness judgments in the scanner.
Conclusions
To date, research on CNS taste function and brain responses to anticipation and receipt of food reward in individuals with MetS is very limited. The results of the current study demonstrated that middle-aged adults with MetS respond with significantly less brain activation than typical controls without MetS to taste stimuli when hungry and after a meal. Differential processing of food-related stimuli in individuals with high levels of adipose tissue and cardiometabolic abnormalities has significant implications for increased understanding of the neural underpinnings of eating behavior in these individuals. Future research on relationships among these variables is warranted in order to better conceptualize and develop interventions for overeating in these disorders.
4. Experimental Procedure
4.1 Participants
Thirty-one middle-aged (44–54 years old) adults were recruited from the San Diego community, Kaiser Permanente, and the UCSD Bariatric and Metabolic Institute. Fifteen of the participants were healthy controls (HC; 8 females and 7 males) who did not meet criteria for MetS. The MetS group consisted of 16 middle-aged adults (11 females and 5 males) who met the criteria outlined in Table 1. For one of the participants with MetS, data were only available for psychophysical testing and fMRI data analyses during the satiety session (see description of sessions below). Participants gave informed consent and received monetary compensation for their participation.
4.2 Procedures
Participants completed three sessions on different days. The first session served as an initial screening in order to: (1) determine metabolic status, and (2) screen for exclusionary criteria. Neuroimaging took place during the second and third sessions.
4.2.1 Screening Session
Participants were screened for exclusionary criteria including ageusia, anosmia, upper respiratory infection or allergies within the prior two weeks, left-handedness, major head injury, and any contraindications for fMRI (e.g., metal in the body). To screen for ageusia and anosmia, taste and odor thresholds were assessed using a forced choice procedure (Cain et al., 1983; modified as in Murphy et al., 1990). Specifically, the taste threshold was measured using sucrose solutions of varying concentration and odor threshold was assessed using a series of concentrations of butanol presented in an ascending sequence.
Participants were also screened for MetS criteria using the most recent IDF guidelines for clinical diagnosis of MetS (Table 1; Alberti et al., 2009). To measure waist circumference, each participant’s waist was measured at the midpoint between the highest point of the iliac crest and the lowest point of the rib cage. Height and weight were measured during the screening session using a stadiometer and digital scale, respectively. Body mass index (BMI) was calculated by dividing weight in kilograms by height in meters squared. Blood pressure was recorded as the average of three consecutive measurements using a blood pressure monitor. If a participant did not have a diagnosis of hyperlipidemia, HDL and triglyceride levels were assessed using CardioChek Triglyceride and HDL Cholesterol Strips after a 12-hour fast. Finally, a self-report questionnaire was used to determine if participants were currently being treated for hypertension, dyslipidemia, or T2DM.
4.2.2. Neuroimaging Sessions
The neuroimaging sessions were conducted at the University of California, San Diego Center for Functional Magnetic Resonance Imaging (fMRI). Participants were scanned on two separate occasions. One session was designated as the “hunger” condition, and participants were scanned after fasting overnight for a minimum of 12 hours. The other session was designated as the “satiety” condition, and participants were scanned after consuming a 700 kilocalorie (kcal) nutritional preload. The order of hunger and satiety sessions were counterbalanced.
Prior to and post-fMRI scans, participants were asked to report psychophysical ratings of pleasantness and intensity of the two taste stimuli and hunger using modified versions of the General Labeled Magnitude Scale (gLMS; Figure 3; Bartoshuk et al., 2004; Green et al., 1993; Green et al., 1996). During the satiety condition, participants were also asked to report psychophysical ratings one extra time: after the preload, prior to entering the scanner.
Figure 3.

Modified general labeled magnitude scale (gLMS) for pleasantness
4.2.2.1 Stimulus Delivery
A detailed description of the protocol and the system for delivering taste stimuli in the fMRI environment used in the proposed study are outlined in the Journal of Neuroscience Methods (Haase et al., 2007).
The critical elements are briefly described below. The current study was designed to investigate fMRI activation during pleasantness evaluation of one pleasant taste (sweet) and one aversive taste (bitter). Therefore, the study examined brain activation in response to pleasantness evaluation of sucrose (0.64M) and caffeine (0.02M) presented as aqueous solutions. Participants lay supine in the scanner and were fitted with a bite bar. The purpose of the bite bar was to minimize head movement, including that associated with swallowing, and to allow the tubing for taste delivery to rest comfortably between the lips. The stimuli were individually filled in syringes and delivered to the tongue of the participant through 25-foot long tubing connected to programmable pumps located in the operator room. The pumps were computer-programmed to push the syringes so that 0.3 ml of solution was presented in 1 sec from each syringe at the appropriate time.
Two functional scans were performed on each day of scanning. Each stimulus was delivered 8 times per functional run, presented pseudo-randomly with a 10s inter-stimulus interval (ISI). Distilled water was presented twice after each stimulus; the first time as a rinse, and the second to be used as a baseline for data analysis. A minimum of 30-seconds elapsed before the same stimulus was presented again (except for water delivery, no stimulus was presented twice in a row). This procedure was designed to minimize habituation and adaptation of the gustatory system.
During the functional scans, taste stimulation was paired with a pleasantness evaluation task. The 10-second ISI allowed 1 second for taste delivery, 2 seconds for swallowing (with a cue “please swallow” presented on a screen), and 7 seconds for providing a magnitude estimate of the pleasantness of the taste. A joystick was employed by participants in order to place a crosshair on a number corresponding to a modified general labeled magnitude scale (gLMS) for pleasantness. This whole process was completed with the use of an interactive computer interface displayed on a screen, visible to the participants via a mirror.
4.2.2.2. Image Acquisition
The neuroimaging data were collected on two 3 Tesla scanners at the UCSD Center for fMRI. Therefore, 19 participants (12 controls and 7 individuals with metabolic syndrome) were scanned using a 3T General Electric (GE) Signa EXCITE research scanner and the remaining 12 participants (3 controls and 9 individuals with metabolic syndrome) were scanned on a 3T GE Discovery MR750 scanner. All voxelwise statistical analyses were corrected for any potential effect of scanner by including it as a variable of no interest in the model.
Structural images for anatomical localization of functional images were collected prior to the functional scans using a high-resolution T1-weighted whole-brain FSPGR sequence (Field of view (FOV) = 25.6cm, slice thickness = 1.2mm, resolution 1×1×1 mm3, echo time (TE) = 30ms, Locs per slab = 190, flip angle = 15°). The structural images for the last 8 participants (3 controls and 5 individuals with MetS) were collected using a T1-weighted IRSPGR sequence (Field of view (FOV) = 24cm, slice thickness = 1.2mm, resolution 0.9375×0.9375×1.2 mm3, echo time (TE) = 3ms, Locs per slab = 170, flip angle = 8°) with a real-time, image-based prospective motion correction technique (PROMO) (Brown et al., 2010; White et al., 2010). For functional data, a whole brain gradient echo planer pulse sequence was used to acquire T2*-weighted functional images (32 axial slices, FOV = 19.2cm, matrix size = 64×64, spatial resolution = 3×3×3 mm3, flip angle = 90°, echo time (TE) = 30ms, repetition time (TR) = 2000ms).
4.2.2.3 Image Analysis
Functional data were processed using Analysis of Functional NeuroImage (AFNI) software (Cox 1996) and FMRIB Software Library (FSL; Smith et al., 2004). The data were preprocessed using motion correction and alignment of the anatomical image and functional runs. An automated in vivo shimming method using 3-dimensional field maps was employed to correct for heterogeneity of the magnetic field and to reduce signal dropout around the sinuses using FSL. Images were spatially smoothed to 4 full width at half maximum (FWHM), automasked to clip voxels outside of the brain, and normalized to Talaraich space using AFNI to control for individual structural differences. The two functional runs in each condition (hunger or satiety) were individually rescaled to a baseline of 100 and concatenated for each participant.
A deconvolution was run on each individual’s concatenated runs using 3dDeconvolve in AFNI (Cox, 1996). A deconvolution uses Ordinary Least Squares regression to estimate the hemodynamic response at each voxel in a participant’s run given the experimental paradigm (i.e., stimulus onset timing). In other words, the onset of each taste stimulus (i.e., sucrose, caffeine) and the water baseline were specified and used in the creation of contrasts (i.e., sucrose minus water; caffeine minus water). The water baseline serves as a control for non-gustatory intraoral stimulation with aqueous solution (Zald and Pardo, 2000). The output from running 3dDeconvolve contains fit coefficients (i.e., beta weights) for each voxel, indicating the amplitude of the signal model for each contrast, and corresponding t-statistics.
A region of interest (ROI) analysis was also conducted on fMRI data for each participant in each physiological condition using 3dROIstats in AFNI (Cox, 1996). The borders of the nucleus accumbens, amygdala, hypothalamus, caudate head, body, and tail were anatomically defined by using the Talairach Daemon database. The datasets containing the delineated ROIs were resampled to match the functional dataset grid to produce masks. The masks were applied to the output datasets from the deconvolution for each participant during pleasantness evaluation of sucrose in order to extract mean beta values corresponding to each region and condition.
4.2.3 Statistical Methods
4.2.3.1. Demographics and Psychophysical Data
One-Way Analyses of Variance (ANOVAs) were conducted on height, weight, BMI, waist circumference, odor thresholds in left and right nostrils, and taste threshold in order to examine potential demographic, psychophysical, or body measurement differences between groups. Psychophysical ratings of hunger, intensity and pleasantness were analyzed using mixed-model ANOVAs to explore changes in hunger, intensity and pleasantness of each taste (sucrose or caffeine) over time (pre- and post-scan; pre-and post-preload), and to determine if any potential changes differed according to metabolic status. Newman-Keuls Multiple Range Tests were employed to follow up on significant interactions and determine which mean differences were significant.
4.2.3.2. Neuroimaging Data
Several thresholding steps were taken in an attempt to control for Type I error in all group analyses. Individual voxels were thresholded at p ≤ 0.015. To protect a whole-brain probability of false positives at an overall alpha of 0.05, group statistical maps were corrected for multiple comparisons at the cluster level using the AFNI program AlphaSim (Cox, 1996). AlphaSim uses Monte Carlo simulations to compute the probability of generating a random “significant” cluster of noise (i.e., a false positive) given the individual voxel threshold, the voxel connection radius, the amount of blurring, and the search volume (i.e., overall dataset size). For an overall alpha level of 0.05, a cluster threshold of 21 contiguous voxels was applied.
In order to investigate the change in activation from hunger to satiety, voxelwise one-sample t-tests were run for the hunger minus satiety contrast. These t-tests were conducted in the control and MetS group separately for each tastant (sucrose and caffeine).
At the group level, one-sample, linear mixed-effects (LME) analyses were conducted with the 3dLME program in AFNI (Chen et al., 2013) to examine between-group differences in response to pleasantness evaluation of caffeine and sucrose. The LME model included scanner (pre- or post-upgrade) as an additive, explanatory factor of no interest, metabolic status as a between-subject factor, and taste as a within-subject factor. For experiment 1, metabolic status included two groups: (1) middle-aged adults without MetS and (2) middle-aged adults with MetS. FMRI responses during pleasantness evaluation of sucrose and caffeine were directly compared: (1) after a 12-hour fast (the hunger condition) and (2) after a nutritional preload (the satiety condition).
Given the importance of the hypothalamus in the regulation of feeding behavior via modulation of reward value and the experience of hunger and satiety, we also used a region of interest (ROI) analysis to investigate the potential for differential hypothalamic activation according to BMI. To investigate this relationship, correlations were run between BMI and hypothalamic activation during pleasantness evaluation of sucrose in the hunger and satiety conditions.
Highlights.
Significantly less brain activation in middle-aged adults with MetS than controls
When hungry, less activation when judging pleasantness of sweet and bitter stimuli
Less activation in regions involved in sensory and higher-level taste processing
When sated, hypothalamic activation to sweet increased with BMI
Additional research on brain response in MetS is warranted to inform interventions
Acknowledgments
This research was supported by NIH grant No. AG004085-26 from the National Institute on Aging to Claire Murphy. Erin Green was supported primarily by NIH grant No. AG004085-26. She has also received support from the Rose Marie Pangborn Scholarship and the Advanced Fellowship in Mental Illness and Treatment at the Sierra-Pacific Mental Illness Research, Education and Clinical Center (MIRECC). We thank Stephanie Oleson, Lisa Graves, and Elissa McIntosh for assistance with data acquisition. We also thank the UCSD Center for fMRI; and Drs. Santiago Horgan, William Perry and Charlie D. Morgan and the UCSD Bariatric and Metabolic Institute and the San Diego Kaiser Permanente Positive Choice program for assistance in recruitment.
Footnotes
Publisher's Disclaimer: This is a PDF file of an unedited manuscript that has been accepted for publication. As a service to our customers we are providing this early version of the manuscript. The manuscript will undergo copyediting, typesetting, and review of the resulting proof before it is published in its final citable form. Please note that during the production process errors may be discovered which could affect the content, and all legal disclaimers that apply to the journal pertain.
References
- Abbasi F, Brown BW, Jr, Lamendola C, McLaughlin T, Reaven GM. Relationship between obesity, insulin resistance, and coronary heart disease risk. J Am Coll Cardiol. 2002;40:937–43. doi: 10.1016/s0735-1097(02)02051-x. [DOI] [PubMed] [Google Scholar]
- Alberti KG, Zimmet P, Shaw J. The metabolic syndrome--a new worldwide definition. Lancet. 2005;366:1059–62. doi: 10.1016/S0140-6736(05)67402-8. [DOI] [PubMed] [Google Scholar]
- Alberti KG, Eckel RH, Grundy SM, Zimmet PZ, Cleeman JI, Donato KA, Fruchart JC, James WP, Loria CM, Smith SC., Jr Harmonizing the metabolic syndrome: a joint interim statement of the International Diabetes Federation Task Force on Epidemiology and Prevention; National Heart, Lung, and Blood Institute; American Heart Association; World Heart Federation; International Atherosclerosis Society; and International Association for the Study of Obesity. Circulation. 2009;120:1640–5. doi: 10.1161/CIRCULATIONAHA.109.192644. [DOI] [PubMed] [Google Scholar]
- ATP. Third Report of the National Cholesterol Education Program (NCEP) Expert Panel on Detection, Evaluation, and Treatment of High Blood Cholesterol in Adults (Adult Treatment Panel III) final report. Circulation. 2002;106:3143–421. [PubMed] [Google Scholar]
- Badre D, D’Esposito M. Functional magnetic resonance imaging evidence for a hierarchical organization of the prefrontal cortex. Journal of Cognitive Neuroscience. 2007;19:2082–2099. doi: 10.1162/jocn.2007.19.12.2082. [DOI] [PubMed] [Google Scholar]
- Baptista T. Body weight gain induced by antipsychotic drugs: mechanisms and management. Acta psychiatrica Scandinavica. 1999;100:3–16. doi: 10.1111/j.1600-0447.1999.tb10908.x. [DOI] [PubMed] [Google Scholar]
- Bartoshuk LM, Duffy VB, Green BG, Hoffman HJ, Ko CW, Lucchina LA, Marks LE, Snyder DJ, Weiffenbach JM. Valid across-group comparisons with labeled scales: the gLMS versus magnitude matching. Physiol Behav. 2004;82:109–14. doi: 10.1016/j.physbeh.2004.02.033. [DOI] [PubMed] [Google Scholar]
- Beltran-Sanchez H, Harhay MO, Harhay MM, McElligott S. Prevalence and trends of metabolic syndrome in the adult U.S. population, 1999–2010. Journal of the American College of Cardiology. 2013;62:697–703. doi: 10.1016/j.jacc.2013.05.064. [DOI] [PMC free article] [PubMed] [Google Scholar]
- Berridge KC. Food reward: brain substrates of wanting and liking. Neurosci Biobehav Rev. 1996;20:1–25. doi: 10.1016/0149-7634(95)00033-b. [DOI] [PubMed] [Google Scholar]
- Berthoud HR. Multiple neural systems controlling food intake and body weight. Neurosci Biobehav Rev. 2002;26:393–428. doi: 10.1016/s0149-7634(02)00014-3. [DOI] [PubMed] [Google Scholar]
- Berthoud HR, Morrison C. The brain, appetite, and obesity. Annu Rev Psychol. 2008;59:55–92. doi: 10.1146/annurev.psych.59.103006.093551. [DOI] [PubMed] [Google Scholar]
- Blum K, Noble EP, Sheridan PJ, Montgomery A, Ritchie T, Jagadeeswaran P, Nogami H, Briggs AH, Cohn JB. Allelic association of human dopamine D2 receptor gene in alcoholism. JAMA. 1990;263:2055–60. [PubMed] [Google Scholar]
- Bokura H, Yamaguchi S, Iijima K, Nagai A, Oguro H. Metabolic syndrome is associated with silent ischemic brain lesions. Stroke. 2008;39:1607–9. doi: 10.1161/STROKEAHA.107.508630. [DOI] [PubMed] [Google Scholar]
- Brown TT, Kuperman JM, Erhart M, White NS, Roddey JC, Shankaranarayanan A, Han ET, Rettmann D, Dale AM. Prospective motion correction of high-resolution magnetic resonance imaging data in children. Neuroimage. 2010;53:139–45. doi: 10.1016/j.neuroimage.2010.06.017. [DOI] [PMC free article] [PubMed] [Google Scholar]
- Burgess PW, Dumontheil I, Gilbert SJ. The gateway hypothesis of rostral prefrontal cortex (area 10) function. Trends in Cognitive Sciences. 2007;11:290–298. doi: 10.1016/j.tics.2007.05.004. [DOI] [PubMed] [Google Scholar]
- Cabanac M. Physiological role of pleasure. Science. 1971;173:1103–7. doi: 10.1126/science.173.4002.1103. [DOI] [PubMed] [Google Scholar]
- Cain WS, Gent J, Catalanotto FA, Goodspeed RB. Clinical evaluation of olfaction. Am J Otolaryngol. 1983;4:252–256. doi: 10.1016/s0196-0709(83)80068-4. [DOI] [PubMed] [Google Scholar]
- Cavdar S, San T, Aker R, Sehirli U, Onat F. Cerebellar connections to the dorsomedial and posterior nuclei of the hypothalamus in the rat. J Anat. 2001;198:37–45. doi: 10.1046/j.1469-7580.2001.19810037.x. [DOI] [PMC free article] [PubMed] [Google Scholar]
- Cerf-Ducastel B, Murphy C. fMRI activation in response to odorants orally delivered in aqueous solutions. Chem Senses. 2001;26:625–37. doi: 10.1093/chemse/26.6.625. [DOI] [PubMed] [Google Scholar]
- Cerf-Ducastel B, Haase L, Murphy C. Effect of Magnitude Estimation of Pleasantness and Intensity on fMRI Activation to Taste. Chemosens Percept. 2012;5:100–109. doi: 10.1007/s12078-011-9109-1. [DOI] [PMC free article] [PubMed] [Google Scholar]
- Chen G, Saad ZS, Britton JC, Pine DS, Cox RW. Linear mixed-effects modeling approach to FMRI group analysis. Neuroimage. 2013;73:176–90. doi: 10.1016/j.neuroimage.2013.01.047. [DOI] [PMC free article] [PubMed] [Google Scholar]
- Christoff K, Gabrieli JDE. The frontopolar cortex and human cognition: Evidence for a rostrocaudal hierarchical organization within the human prefrontal cortex. Psychobiology. 2000;28:168–186. [Google Scholar]
- Cooper SJ, Al-Naser HA. Dopaminergic control of food choice: contrasting effects of SKF 38393 and quinpirole on high-palatability food preference in the rat. Neuropharmacology. 2006;50:953–63. doi: 10.1016/j.neuropharm.2006.01.006. [DOI] [PubMed] [Google Scholar]
- Cowdrey FA, Park RJ, Harmer CJ, McCabe C. Increased neural processing of rewarding and aversive food stimuli in recovered anorexia nervosa. Biol Psychiatry. 2011;70(8):736–43. doi: 10.1016/j.biopsych.2011.05.028. [DOI] [PubMed] [Google Scholar]
- Cox RW. AFNI: software for analysis and visualization of functional magnetic resonance neuroimages. Comput Biomed Res. 1996;29:162–73. doi: 10.1006/cbmr.1996.0014. [DOI] [PubMed] [Google Scholar]
- Despres JP. Is visceral obesity the cause of the metabolic syndrome? Ann Med. 2006;38:52–63. doi: 10.1080/07853890500383895. [DOI] [PubMed] [Google Scholar]
- Dietrichs E. Cerebellar autonomic function: direct hypothalamocerebellar pathway. Science. 1984;223:591–3. doi: 10.1126/science.6198719. [DOI] [PubMed] [Google Scholar]
- Dietrichs E, Haines DE. Demonstration of hypothalamo-cerebellar and cerebello-hypothalamic fibres in a prosimian primate (Galago crassicaudatus) Anat Embryol (Berl) 1984;170:313–8. doi: 10.1007/BF00318735. [DOI] [PubMed] [Google Scholar]
- Dietrichs E, Wiklund L, Haines DE. The hypothalamo-cerebellar projection in the rat: origin and transmitter. Arch Ital Biol. 1992;130:203–11. [PubMed] [Google Scholar]
- Felsted JA, Ren X, Chouinard-Decorte F, Small DM. Genetically determined differences in brain response to a primary food reward. J Neurosci. 2010;30(7):2428–32. doi: 10.1523/JNEUROSCI.5483-09.2010. [DOI] [PMC free article] [PubMed] [Google Scholar]
- Flegal KM, Carroll MD, Kit BK, Ogden CL. Prevalence of obesity and trends in the distribution of body mass index among US adults, 1999–2010. JAMA : the Journal of the American Medical Association. 2012;307:491–7. doi: 10.1001/jama.2012.39. [DOI] [PubMed] [Google Scholar]
- Frank S, Laharnar N, Kullmann S, Veit R, Canova C, Hegner YL, Fritsche A, Preissl H. Processing of food pictures: influence of hunger, gender and calorie content. Brain Res. 2010;1350:159–66. doi: 10.1016/j.brainres.2010.04.030. [DOI] [PubMed] [Google Scholar]
- Frank S, Wilms B, Veit R, Ernst B, Thurnheer M, Kullmann S, Fritsche A, Birbaumer N, Preissl H, Schultes B. Altered brain activity in severely obese women may recover after Roux-en Y gastric bypass surgery. Int J Obes (Lond) 2013 doi: 10.1038/ijo.2013.60. [DOI] [PubMed] [Google Scholar]
- Gautier JF, Chen K, Salbe AD, Bandy D, Pratley RE, Heiman M, Ravussin E, Reiman EM, Tataranni PA. Differential brain responses to satiation in obese and lean men. Diabetes. 2000;49:838–46. doi: 10.2337/diabetes.49.5.838. [DOI] [PubMed] [Google Scholar]
- Gautier JF, Del Parigi A, Chen KW, Salbe AD, Bandy D, Pratley RE, Ravussin E, Reiman EM, Tataranni PA. Effect of satiation on brain activity in obese and lean women. Obesity Research. 2001;9:676–684. doi: 10.1038/oby.2001.92. [DOI] [PubMed] [Google Scholar]
- Gilbert SJ, Frith CD, Burgess PW. Involvement of rostral prefrontal cortex in selection between stimulus-oriented and stimulus-independent thought. European Journal of Neuroscience. 2005;21:1423–1431. doi: 10.1111/j.1460-9568.2005.03981.x. [DOI] [PubMed] [Google Scholar]
- Grabenhorst F, Rolls ET. Value, pleasure and choice in the ventral prefrontal cortex. Trends in Cognitive Sciences. 2011;15:56–67. doi: 10.1016/j.tics.2010.12.004. [DOI] [PubMed] [Google Scholar]
- Green BG, Shaffer GS, Gilmore MM. Derivation and Evaluation of a Semantic Scale of Oral Sensation Magnitude with Apparent Ratio Properties. Chemical Senses. 1993;18:683–702. [Google Scholar]
- Green BG, Dalton P, Cowart B, Shaffer G, Rankin K, Higgins J. Evaluating the ‘labeled magnitude scale’ for measuring sensations of taste and smell. Chemical Senses. 1996;21:323–334. doi: 10.1093/chemse/21.3.323. [DOI] [PubMed] [Google Scholar]
- Green E, Jacobson A, Haase L, Murphy C. Reduced nucleus accumbens and caudate nucleus activation to a pleasant taste is associated with obesity in older adults. Brain Res. 2011;1386:109–17. doi: 10.1016/j.brainres.2011.02.071. [DOI] [PMC free article] [PubMed] [Google Scholar]
- Green E, Jacobson A, Haase L, Murphy C. Can age-related CNS taste differences be detected as early as middle age? Evidence from fMRI. Neuroscience. 2012;232:194–203. doi: 10.1016/j.neuroscience.2012.11.027. [DOI] [PMC free article] [PubMed] [Google Scholar]
- Green E, Murphy C. Altered processing of sweet taste in the brain of diet soda drinkers. Physiol Behav. 2012;107:560–7. doi: 10.1016/j.physbeh.2012.05.006. [DOI] [PMC free article] [PubMed] [Google Scholar]
- Grundy SM, Cleeman JI, Daniels SR, Donato KA, Eckel RH, Franklin BA, Gordon DJ, Krauss RM, Savage PJ, Smith SC, Jr, Spertus JA, Costa F. Diagnosis and management of the metabolic syndrome: an American Heart Association/National Heart, Lung, and Blood Institute Scientific Statement. Circulation. 2005;112:2735–52. doi: 10.1161/CIRCULATIONAHA.105.169404. [DOI] [PubMed] [Google Scholar]
- Guthoff M, Grichisch Y, Canova C, Tschritter O, Veit R, Hallschmid M, Haring HU, Preissl H, Hennige AM, Fritsche A. Insulin modulates food-related activity in the central nervous system. J Clin Endocrinol Metab. 2010;95:748–55. doi: 10.1210/jc.2009-1677. [DOI] [PubMed] [Google Scholar]
- Haase L, Cerf-Ducastel B, Buracas G, Murphy C. On-line psychophysical data acquisition and event-related fMRI protocol optimized for the investigation of brain activation in response to gustatory stimuli. J Neurosci Methods. 2007;159:98–107. doi: 10.1016/j.jneumeth.2006.07.009. [DOI] [PubMed] [Google Scholar]
- Haase L, Cerf-Ducastel B, Murphy C. Cortical activation in response to pure taste stimuli during the physiological states of hunger and satiety. Neuroimage. 2009;44:1008–21. doi: 10.1016/j.neuroimage.2008.09.044. [DOI] [PMC free article] [PubMed] [Google Scholar]
- Haase L, Green E, Murphy C. Males and females show differential brain activation to taste when hungry and sated in gustatory and reward areas. Appetite. 2011;57:421–34. doi: 10.1016/j.appet.2011.06.009. [DOI] [PMC free article] [PubMed] [Google Scholar]
- Heni M, Kullmann S, Ketterer C, Guthoff M, Bayer M, Staiger H, Machicao F, Haring HU, Preissl H, Veit R, Fritsche A. Differential effect of glucose ingestion on the neural processing of food stimuli in lean and overweight adults. Hum Brain Mapp. 2014;35(3):918–928. doi: 10.1002/hbm.22223. Epub ahead of print 10 Jan 2013. [DOI] [PMC free article] [PubMed] [Google Scholar]
- Hettes SR, Gonzaga WJ, Heyming TW, Nguyen JK, Perez S, Stanley BG. Stimulation of lateral hypothalamic AMPA receptors may induce feeding in rats. Brain Res. 2010;1346:112–20. doi: 10.1016/j.brainres.2010.05.008. [DOI] [PubMed] [Google Scholar]
- Jacobson A, Green E, Murphy C. Age-related functional changes in gustatory and reward processing regions: An fMRI study. Neuroimage. 2010;53:602–10. doi: 10.1016/j.neuroimage.2010.05.012. [DOI] [PMC free article] [PubMed] [Google Scholar]
- Kalmijn S, Foley D, White L, Burchfiel CM, Curb JD, Petrovitch H, Ross GW, Havlik RJ, Launer LJ. Metabolic cardiovascular syndrome and risk of dementia in Japanese-American elderly men. The Honolulu-Asia aging study. Arterioscler Thromb Vasc Biol. 2000;20:2255–60. doi: 10.1161/01.atv.20.10.2255. [DOI] [PubMed] [Google Scholar]
- Killgore WD, Yurgelun-Todd DA. Positive affect modulates activity in the visual cortex to images of high calorie foods. Int J Neurosci. 2007;117:643–53. doi: 10.1080/00207450600773848. [DOI] [PubMed] [Google Scholar]
- Kobayakawa T, Endo H, Ayabe-Kanamura S, Kumagai T, Yamaguchi Y, Kikuchi Y, Takeda T, Saito S, Ogawa H. The primary gustatory area in human cerebral cortex studied by magnetoencephalography. Neuroscience Letters. 1996;212:155–8. doi: 10.1016/0304-3940(96)12798-1. [DOI] [PubMed] [Google Scholar]
- Koechlin E, Summerfield C. An information theoretical approach to prefrontal executive function. Trends Cogn Sci. 2007;11:229–35. doi: 10.1016/j.tics.2007.04.005. [DOI] [PubMed] [Google Scholar]
- Kringelbach ML, O’Doherty Rolls ET, Andrews C. Activaiton of the human orbitofrontal cortex to a liquid food stimulus is correlated with its subjective pleasantness. Cereb Cortex. 2003;13(10):1064–71. doi: 10.1093/cercor/13.10.1064. [DOI] [PubMed] [Google Scholar]
- Kwon HM, Kim BJ, Lee SH, Choi SH, Oh BH, Yoon BW. Metabolic syndrome as an independent risk factor of silent brain infarction in healthy people. Stroke. 2006;37:466–70. doi: 10.1161/01.STR.0000199081.17935.81. [DOI] [PubMed] [Google Scholar]
- Kwon HM, Kim BJ, Park JH, Ryu WS, Kim CK, Lee SH, Ko SB, Nam H, Lee YS, Yoon BW. Significant association of metabolic syndrome with silent brain infarction in elderly people. J Neurol. 2009;256:1825–31. doi: 10.1007/s00415-009-5201-8. [DOI] [PubMed] [Google Scholar]
- Lakka HM, Laaksonen DE, Lakka TA, Niskanen LK, Kumpusalo E, Tuomilehto J, Salonen JT. The metabolic syndrome and total and cardiovascular disease mortality in middle-aged men. JAMA. 2002;288:2709–16. doi: 10.1001/jama.288.21.2709. [DOI] [PubMed] [Google Scholar]
- Leddy JJ, Epstein LH, Jaroni JL, Roemmich JN, Paluch RA, Goldfield GS, Lerman C. Influence of methylphenidate on eating in obese men. Obes Res. 2004;12:224–32. doi: 10.1038/oby.2004.29. [DOI] [PubMed] [Google Scholar]
- Liu Y, Gao JH, Liu HL, Fox PT. The temporal response of the brain after eating revealed by functional MRI. Nature. 2000;405:1058–62. doi: 10.1038/35016590. [DOI] [PubMed] [Google Scholar]
- Martel P, Fantino M. Influence of the amount of food ingested on mesolimbic dopaminergic system activity: a microdialysis study. Pharmacol Biochem Behav. 1996;55:297–302. doi: 10.1016/s0091-3057(96)00087-1. [DOI] [PubMed] [Google Scholar]
- Matsuda M, Liu Y, Mahankali S, Pu Y, Mahankali A, Wang J, DeFronzo RA, Fox PT, Gao JH. Altered hypothalamic function in response to glucose ingestion in obese humans. Diabetes. 1999;48:1801–6. doi: 10.2337/diabetes.48.9.1801. [DOI] [PubMed] [Google Scholar]
- Murphy C, Gilmore MM, Seery CS, Salmon DP, Lasker BR. Olfactory thresholds are associated with degree of dementia in Alzheimer’s disease. Neurobiol Aging. 1990;11:465–9. doi: 10.1016/0197-4580(90)90014-q. [DOI] [PubMed] [Google Scholar]
- Noble EP, Blum K, Ritchie T, Montgomery A, Sheridan PJ. Allelic association of the D2 dopamine receptor gene with receptor-binding characteristics in alcoholism. Arch Gen Psychiatry. 1991;48:648–54. doi: 10.1001/archpsyc.1991.01810310066012. [DOI] [PubMed] [Google Scholar]
- Noble EP, Noble RE, Ritchie T, Syndulko K, Bohlman MC, Noble LA, Zhang Y, Sparkes RS, Grandy DK. D2 dopamine receptor gene and obesity. Int J Eat Disord. 1994;15:205–17. doi: 10.1002/1098-108x(199404)15:3<205::aid-eat2260150303>3.0.co;2-p. [DOI] [PubMed] [Google Scholar]
- Park K, Yasuda N, Toyonaga S, Tsubosaki E, Nakabayashi H, Shimizu K. Significant associations of metabolic syndrome and its components with silent lacunar infarction in middle aged subjects. J Neurol Neurosurg Psychiatry. 2008;79:719–21. doi: 10.1136/jnnp.2007.134809. [DOI] [PubMed] [Google Scholar]
- Reaven GM. Banting lecture 1988. Role of insulin resistance in human disease. Diabetes. 1988;37:1595–607. doi: 10.2337/diab.37.12.1595. [DOI] [PubMed] [Google Scholar]
- Rolls ET, Kringelbach ML, de Araujo IE. Different representation of pleasant and unpleasant odours in the human brain. Eur J Neurosci. 2003;18(3):695–703. doi: 10.1046/j.1460-9568.2003.02779.x. [DOI] [PubMed] [Google Scholar]
- Schulingkamp RJ, Pagano TC, Hung D, Raffa RB. Insulin receptors and insulin action in the brain: review and clinical implications. Neurosci Biobehav Rev. 2000;24(8):855–872. doi: 10.1016/s0149-7634(00)00040-3. [DOI] [PubMed] [Google Scholar]
- Siep N, Roefs A, Roebroeck A, Havermans R, Bonte ML, Jansen A. Hunger is the best spice: An fMRI study of the effects of attention, hunger and calorie content on food reward processing in the amygdala and orbitofrontal cortex. Behavioural Brain Research. 2009;198:149–158. doi: 10.1016/j.bbr.2008.10.035. [DOI] [PubMed] [Google Scholar]
- Small DM, Jones-Gotman M, Dagher A. Feeding-induced dopamine release in dorsal striatum correlates with meal pleasantness ratings in healthy human volunteers. Neuroimage. 2003;19:1709–15. doi: 10.1016/s1053-8119(03)00253-2. [DOI] [PubMed] [Google Scholar]
- Smeets PA, de Graaf C, Stafleu A, van Osch MJ, van der Grond J. Functional MRI of human hypothalamic responses following glucose ingestion. Neuroimage. 2005;24:363–8. doi: 10.1016/j.neuroimage.2004.07.073. [DOI] [PubMed] [Google Scholar]
- Smeets PA, Vidarsdottir S, de Graaf C, Stafleu A, van Osch MJ, Viergever MA, Pijl H, van der Grond J. Oral glucose intake inhibits hypothalamic neuronal activity more effectively than glucose infusion. Am J Physiol Endocrinol Metab. 2007;293:E754–8. doi: 10.1152/ajpendo.00231.2007. [DOI] [PubMed] [Google Scholar]
- Smith SM, Jenkinson M, Woolrich MW, Beckmann CF, Behrens TE, Johansen-Berg H, Bannister PR, De Luca M, Drobnjak I, Flitney DE, Niazy RK, Saunders J, Vickers J, Zhang Y, De Stefano N, Brady JM, Matthews PM. Advances in functional and structural MR image analysis and implementation as FSL. Neuroimage. 2004;23(Suppl 1):S208–19. doi: 10.1016/j.neuroimage.2004.07.051. [DOI] [PubMed] [Google Scholar]
- Sobel N, Prabhakaran V, Hartley CA, Desmond JE, Zhao Z, Glover GH, Gabrieli JD, Sullivan EV. Odorant-induced and sniff-induced activation in the cerebellum of the human. J Neurosci. 1998;18:8990–9001. doi: 10.1523/JNEUROSCI.18-21-08990.1998. [DOI] [PMC free article] [PubMed] [Google Scholar]
- Stanley BG, Ha LH, Spears LC, Dee MG., 2nd Lateral hypothalamic injections of glutamate, kainic acid, D,L-alpha-amino-3-hydroxy-5-methyl-isoxazole propionic acid or N-methyl-D-aspartic acid rapidly elicit intense transient eating in rats. Brain Res. 1993;613:88–95. doi: 10.1016/0006-8993(93)90458-y. [DOI] [PubMed] [Google Scholar]
- Stanley BG, Willett VL, 3rd, Donias HW, Dee MG, 2nd, Duva MA. Lateral hypothalamic NMDA receptors and glutamate as physiological mediators of eating and weight control. Am J Physiol. 1996;270:R443–9. doi: 10.1152/ajpregu.1996.270.2.R443. [DOI] [PubMed] [Google Scholar]
- Stice E, Spoor S, Bohon C, Small DM. Relation between obesity and blunted striatal response to food is moderated by TaqIA A1 allele. Science. 2008a;322:449–52. doi: 10.1126/science.1161550. [DOI] [PMC free article] [PubMed] [Google Scholar]
- Stice E, Spoor S, Bohon C, Veldhuizen MG, Small DM. Relation of reward from food intake and anticipated food intake to obesity: a functional magnetic resonance imaging study. J Abnorm Psychol. 2008b;117:924–35. doi: 10.1037/a0013600. [DOI] [PMC free article] [PubMed] [Google Scholar]
- Szczypka MS, Kwok K, Brot MD, Marck BT, Matsumoto AM, Donahue BA, Palmiter RD. Dopamine production in the caudate putamen restores feeding in dopamine-deficient mice. Neuron. 2001;30:819–28. doi: 10.1016/s0896-6273(01)00319-1. [DOI] [PubMed] [Google Scholar]
- Tataranni PA, Gautier JF, Chen K, Uecker A, Bandy D, Salbe AD, Pratley RE, Lawson M, Reiman EM, Ravussin E. Neuroanatomical correlates of hunger and satiation in humans using positron emission tomography. Proc Natl Acad Sci U S A. 1999;96:4569–74. doi: 10.1073/pnas.96.8.4569. [DOI] [PMC free article] [PubMed] [Google Scholar]
- Towell A, Muscat R, Willner P. Behavioural microanalysis of the role of dopamine in amphetamine anorexia. Pharmacol Biochem Behav. 1988;30:641–8. doi: 10.1016/0091-3057(88)90077-9. [DOI] [PubMed] [Google Scholar]
- van der Laan LN, de Ridder DT, Viergever MA, Smeets PA. The first taste is always with the eyes: a meta-analysis on the neural correlates of processing visual food cues. Neuroimage. 2011;55:296–303. doi: 10.1016/j.neuroimage.2010.11.055. [DOI] [PubMed] [Google Scholar]
- Wang GJ, Volkow ND, Logan J, Pappas NR, Wong CT, Zhu W, Netusil N, Fowler JS. Brain dopamine and obesity. Lancet. 2001;357:354–7. doi: 10.1016/s0140-6736(00)03643-6. [DOI] [PubMed] [Google Scholar]
- Wang GJ, Volkow ND, Thanos PK, Fowler JS. Imaging of brain dopamine pathways: implications for understanding obesity. J Addict Med. 2009;3:8–18. doi: 10.1097/ADM.0b013e31819a86f7. [DOI] [PMC free article] [PubMed] [Google Scholar]
- Wen YQ, Zhu JN, Zhang YP, Wang JJ. Cerebellar interpositus nuclear inputs impinge on paraventricular neurons of the hypothalamus in rats. Neurosci Lett. 2004;370:25–9. doi: 10.1016/j.neulet.2004.07.072. [DOI] [PubMed] [Google Scholar]
- White N, Roddey C, Shankaranarayanan A, Han E, Rettmann D, Santos J, Kuperman J, Dale A. PROMO: Real-time prospective motion correction in MRI using image-based tracking. Magn Reson Med. 2010;63:91–105. doi: 10.1002/mrm.22176. [DOI] [PMC free article] [PubMed] [Google Scholar]
- Whitmer RA, Sidney S, Selby J, Johnston SC, Yaffe K. Midlife cardiovascular risk factors and risk of dementia in late life. Neurology. 2005;64:277–81. doi: 10.1212/01.WNL.0000149519.47454.F2. [DOI] [PubMed] [Google Scholar]
- Yokum S, Ng J, Stice E. Relation of regional gray and white matter volumes to current BMI and future increases in BMI: a prospective MRI study. Int J Obes (Lond) 2012;36:656–64. doi: 10.1038/ijo.2011.175. [DOI] [PMC free article] [PubMed] [Google Scholar]
- Zhu JN, Zhang YP, Song YN, Wang JJ. Cerebellar interpositus nuclear and gastric vagal afferent inputs reach and converge onto glycemia-sensitive neurons of the ventromedial hypothalamic nucleus in rats. Neurosci Res. 2004;48:405–17. doi: 10.1016/j.neures.2003.12.009. [DOI] [PubMed] [Google Scholar]
- Zhu JN, Wang JJ. The cerebellum in feeding control: possible function and mechanism. Cell Mol Neurobiol. 2008;28:469–78. doi: 10.1007/s10571-007-9236-z. [DOI] [PMC free article] [PubMed] [Google Scholar]