Abstract
Purpose:
The purpose of this work is to investigate the radiosensitizing effect of gold nanoparticle (GNP) induced vasculature damage for proton, megavoltage (MV) photon, and kilovoltage (kV) photon irradiation.
Methods:
Monte Carlo simulations were carried out using tool for particle simulation (TOPAS) to obtain the spatial dose distribution in close proximity up to 20 μm from the GNPs. The spatial dose distribution from GNPs was used as an input to calculate the dose deposited to the blood vessels. GNP induced vasculature damage was evaluated for three particle sources (a clinical spread out Bragg peak proton beam, a 6 MV photon beam, and two kV photon beams). For each particle source, various depths in tissue, GNP sizes (2, 10, and 20 nm diameter), and vessel diameters (8, 14, and 20 μm) were investigated. Two GNP distributions in lumen were considered, either homogeneously distributed in the vessel or attached to the inner wall of the vessel. Doses of 30 Gy and 2 Gy were considered, representing typical in vivo enhancement studies and conventional clinical fractionation, respectively.
Results:
These simulations showed that for 20 Au-mg/g GNP blood concentration homogeneously distributed in the vessel, the additional dose at the inner vascular wall encircling the lumen was 43% of the prescribed dose at the depth of treatment for the 250 kVp photon source, 1% for the 6 MV photon source, and 0.1% for the proton beam. For kV photons, GNPs caused 15% more dose in the vascular wall for 150 kVp source than for 250 kVp. For 6 MV photons, GNPs caused 0.2% more dose in the vascular wall at 20 cm depth in water as compared to at depth of maximum dose (Dmax). For proton therapy, GNPs caused the same dose in the vascular wall for all depths across the spread out Bragg peak with 12.7 cm range and 7 cm modulation. For the same weight of GNPs in the vessel, 2 nm diameter GNPs caused three times more damage to the vessel than 20 nm diameter GNPs. When the GNPs were attached to the inner vascular wall, the damage to the inner vascular wall can be up to 207% of the prescribed dose for the 250 kVp photon source, 4% for the 6 MV photon source, and 2% for the proton beam. Even though the average dose increase from the proton beam and MV photon beam was not large, there were high dose spikes that elevate the local dose of the parts of the blood vessel to be higher than 15 Gy even for 2 Gy prescribed dose, especially when the GNPs can be actively targeted to the endothelial cells.
Conclusions:
GNPs can potentially be used to enhance radiation therapy by causing vasculature damage through high dose spikes caused by the addition of GNPs especially for hypofractionated treatment. If GNPs are designed to actively accumulate at the tumor vasculature walls, vasculature damage can be increased significantly. The largest enhancement is seen using kilovoltage photons due to the photoelectric effect. Although no significant average dose enhancement was observed for the whole vasculature structure for both MV photons and protons, they can cause high local dose escalation (>15 Gy) to areas of the blood vessel that can potentially contribute to the disruption of the functionality of the blood vessels in the tumor.
Keywords: gold nanoparticles, vasculature dose enhancement, radiotherapy, proton therapy, Monte Carlo simulation
1. INTRODUCTION
In the last decade, preclinical studies have shown the potential of using gold nanoparticles (GNPs) as a radiosensitizer. Hainfeld et al. first showed using in vivo experiments that the one year survival increased four times for tumor bearing mice irradiated with a 250 kVp x-ray source 5 min after intravenous injection of 1.9 nm GNPs as compared to radiation alone.1 Following that, several in vivo studies also demonstrated a significant increase in the one year survival after irradiation with kilovoltage (kV) photons following intravenous injection of GNPs as compared to radiation alone.2–5 While most studies used kV photons, Kim et al. have shown that GNPs can be used to enhance proton treatment.6 In vitro studies have investigated the benefit of using GNPs to increase dose to tumor cells. The results suggest that the GNP induced radiosensitization effect is highly cell-specific and cellular uptake of GNPs is in general important for observing decreased cell survival after radiation.7–11 In Hainfeld’s in vivo experiment, the tumors were irradiated only 5 min after the GNP injection,1,11 a time which is too short for tumor cells to accumulate a significant amount of GNPs inside the cellular space. The incubation time in most in vitro studies is 6–24 h. This indicates that other factors contribute to GNP aided cell killing besides direct DNA damage to tumor cells.
Microvasculature damage plays a critical role in regulating tumor response to radiation therapy and drug treatment. Garcia-Barros et al. have shown that microvascular endothelia apoptosis is required for clonogenic cell dysfunction.12 This has led to the development of vascular disrupting agents (VDAs) for cancer therapy, which produce rapid and widespread shut down of tumor blood flow.13–19 The role of vasculature damage in tumor response to radiation has also been investigated providing strong evidence for microvascular endothelial engagement in tumor response to radiation therapy.19–22 The high gold concentration in blood shortly after the injections of GNPs makes GNPs a potential VDA in combination with radiation therapy by increasing the dose to blood vessels. The advantage of using GNPs as VDA is through selective dose enhancement in the irradiated region without interrupting vasculature function in the whole body and thus features reduced toxicity as compared to conventional VDAs. Joh et al. have shown with in vivo experiment that the endothelial cell damage increased three times in tumors irradiated 5 min after GNP injection compared to radiation alone.5
Ngwa et al. have proposed an analytical model to investigate the endothelial dose enhancement using several brachytherapy radiation sources and kV photons to explain and quantify the vasculature dose enhancement from GNPs. They showed with simulation results that the dose enhancement factor is 12.9 for a 50 kVp source for a gold concentration in blood of 18 Au-mg/g.23 Similarly, Berbeco et al. investigated the endothelial dose enhancement using megavoltage (MV) photon sources using theoretical model and found a dose enhancement factor of 1.7 for a gold concentration of 30 Au-mg/g.24 Later, the endothelial dose enhancement was calculated using simulations for alpha particles and various high Z materials for the endothelial cell membrane and the dose to the nucleus.25,26
In this study, we developed a different approach toward the same goal and investigated the validity of several assumptions in previous studies. First, the number, energy, and direction of the secondary electrons generated from GNP interactions with the particle source were recorded at the GNP surface and the dose deposition of these electrons in surrounding tissue approximated as water is simulated from a Monte Carlo simulation. This takes into account the loss of low energy electrons being self-absorbed in the GNPs and only includes those able to escape from the GNP. Second, since the dose deposited from secondary electrons were calculated using Monte Carlo simulation,27 we provide accurate spatial dose deposition around GNPs and eliminating the need to use empirical electron energy loss function which can result in propagation of errors from using approximated input values. Third, we considered two distributions of the GNPs in the lumen. The first distribution has GNPs distributed at the lumen wall. The second distribution has GNPs evenly distributed in the lumen volume because the radiation was administrated within several minutes in most in vivo experiments, and thus, these experiments did not leave enough time for active endothelial cell targeting. Using this model, we investigated the endothelial dose enhancement factor for various particle sources including proton beams, kV photon beams, and MV photon beams. The following questions were addressed in this work: (1) what is the highest achievable dose in the vasculature wall, (2) how is the dose enhancement affected by the size of the lumen, (3) how is the dose enhancement affected by the size of the GNPs, and (4) how does GNP dose enhancement differ for the three particle sources.
2. METHODS
2.A. Monte Carlo simulation
To obtain the spatial dose distribution around the GNPs, Monte Carlo simulation was carried out using tool for particle simulation (TOPAS).28 The simulations details were explained in our previous work29 and are briefly described here. Three particle sources were investigated: (1) a spread out Bragg peak (SOBP) proton beam with 12.7 cm range and 7 cm modulation, (2) two kV photon beams (150 and 250 kVp), and (3) a 6 MV Varian True Beam flattening filter free Linac photon beam. A 20 × 20 × 40 cm3 water phantom was irradiated by the particles and the particle shower spectrum at a given depth (as shown in Fig. 1) was recorded as a phase space profile passing a 50 mm diameter surface perpendicular to the beam axis. For the proton beam, phase spaces were acquired at three depths equally spaced along the SOBP (SOBP1, SOBP2, and SOBP3) as indicated in Fig. 1(a). For the 6 MV Linac photon beam, three depths coinciding with the maximum dose (PDD100) and 80% and 50% of the maximum dose (PDD80 and PDD50) were chosen to acquire the particle phase space file as indicated in Fig. 1(b). For kV photon beams, the phase spaces were acquired at 1 mm depth in water. The phase space files were then modified to have the same beam diameter as a single GNP by adjusting the length scale and angular distribution of the incoming particles. The modified phase spaces were used as a particle source to irradiate a single GNP. The range of GNP sizes used in the literature for in vivo studies are between 1.9 and 30 nm. This study focused on 10 nm GNPs, as this size of GNPs were used in several in vivo studies.3,5,6 GNP diameters of 2 and 20 nm were also investigated to evaluate the effect of the GNP size. The energy and direction of the electrons produced through ionization and excitation interactions in the GNP were recorded at the outer surface of the GNP in a second phase space file. The phase spaces recorded at the outer surface of the GNP were then used as a source to calculate radial doses in water, as described below.
FIG. 1.

(a) Percentage depth dose for a SOBP proton beam, phase spaces were acquired at three depths equally spaced along the SOBP (SOBP1, SOBP2, and SOBP3). (b) A 6 MV photon beam, three depths coinciding with the maximum dose (PDD100) and 80% and 50% of the maximum dose (PDD80 and PDD50) were chosen to acquire the particle phase space file. (c) kVp photon beams, the phase spaces were acquired at 1 mm depth in water.
2.B. Radial dose distribution of GNPs
The Monte Carlo simulation provides the radial dose distribution in the vicinity of a GNP for a single ionization event and the interaction probability for a given dose. The details of the definition and calculation of radial dose distribution and interaction probability can be found in our previous work.29,30 Briefly, the phase spaces of secondary particles originating from interactions within the GNP were used as a source at the center of a 40 × 40 × 40 μm3 water phantom, with dose scored as a function of distance from the GNP. The dose is divided by the number of ionization interactions in the GNP to provide the radial dose distribution in the vicinity of a GNP for a single ionization event. The interaction probability per prescribed gray is defined by the chance of having one ionization event in a single GNP when the dose absorbed in the surrounding tissue from the radiation source is 1 Gy. The interaction probability for different modalities per prescribed gray is shown in Table I. The radial dose per ionization for the three particle sources interacting with 10 nm GNPs is shown in Fig. 2(a).
TABLE I.
The interaction probability per gray for three therapy modalities.
| SOBP protons | 6 MV photons | kV photons | ||||||
|---|---|---|---|---|---|---|---|---|
| GNP size | SOBP1 | SOBP2 | SOBP3 | PDD100 | PDD80 | PDD50 | 150 kVp | 250 kVp |
| 10 nm | 5.8 × 10⁻⁶ | 5.8 × 10⁻⁶ | 5.8 × 10⁻⁶ | 5.6 × 10⁻⁶ | 7.9 × 10⁻⁶ | 9.4 × 10⁻⁶ | 2.3 × 10⁻⁴ | 1.8 × 10⁻⁴ |
FIG. 2.
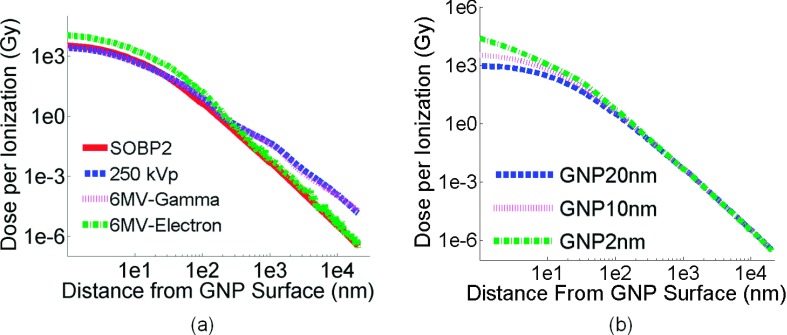
(a) Comparison of the radial dose deposition per ionization for a single 10 nm GNP in a SOBP proton beam, a 6 MV photon beam (at depth of PDD80, electron component and photon component, separately), and a 250 kVp photon beam. (b) Comparison of the radial dose deposition per ionization for three GNP sizes in a SOBP proton beam at SOBP2.
The GNP dose per ionization produced from 6 MV photons is plotted for the electron and photon component of the radiation field separately. The dose per ionization for the electron component of the 6 MV field has the highest value within 10 nm from the GNP surface, the value decreases below the dose from the photon component at a distance of 100 nm from GNP surface. Near the GNP surface, the dose per ionization agrees within 25% for the proton SOBP at the depth of SOBP2, the 250 kVp photon field, and the 6 MV photon component at PDD80. As the distance from the GNP surface increases, the dose from protons drops rapidly. At a distance of 10 μm from the GNP surface, the GNP dose from 250 kVp is 35 times higher than the dose from the proton beam.
The interaction probability per prescribed gray for SOBP2 for three GNP sizes is shown in Table II. The interaction probability per gold atom is also listed. The dose per ionization event for GNPs of various sizes is shown in Fig. 2(b). For one ionization event, 2 nm GNPs produce nearly a 215 times higher dose near the surface of the nanoparticles compared to 20 nm GNPs. The difference is reduced to less than 10% as the distance from the surface increases to 1 μm. The difference for the interaction probability per gold atom is in the order of 2% for different GNP sizes as shown in Table II. However, the secondary electrons generated in a small GNP are less likely to be self-absorbed inside of GNP and thus contribute to the high dose per ionization near the GNP surface.
TABLE II.
The interaction probability per gray for different GNP sizes at the center of the SOBP (SOBP2).
| GNP ize (nm) | 20 | 10 | 2 |
|---|---|---|---|
| Interaction probability per GNP | 4.6 × 10⁻⁵ | 5.8 × 10⁻⁶ | 4.7 × 10⁻⁸ |
| Interaction probability per Au atom | 2.3 × 10⁻¹⁰ | 2.32 × 10⁻¹⁰ | 2.35 × 10⁻¹⁰ |
2.C. Vascular geometric model
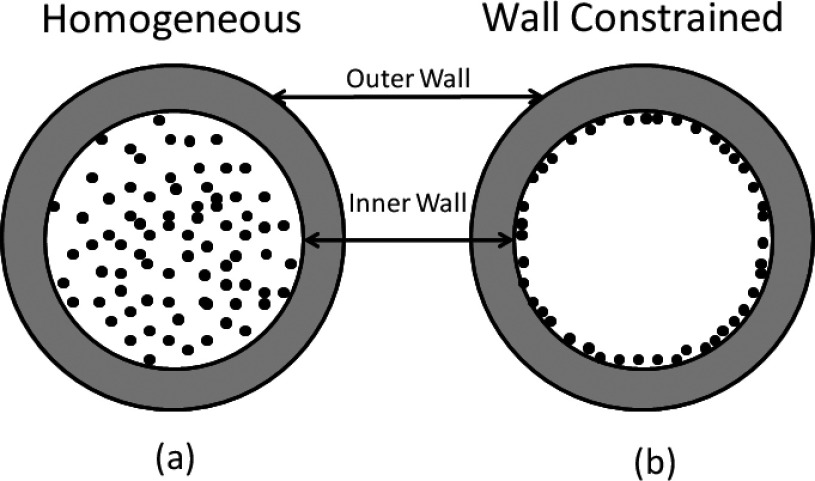
The smallest blood vessels in the human body are capillaries, which have an inner diameter of approximately 8 μm to allow the transportation of oxygen by a single red blood cell. Our vascular structure was modeled as a vessel composed of a single layer of epithelial cells with a minimum inner diameter of 8 μm (Ref. 31) and a maximum of 20 μm. The vasculature wall thickness is 2 μm,31,32 the size of a single endothelial layer. GNPs were homogeneously distributed in the vessel, as shown in Fig. 3(a). As a comparison to work previously published by other groups,23–26 we also evaluated the geometry with GNPs constrained within 20 nm distance to the inner vessel wall of the lumen, as shown in Fig. 3(b). The number of GNPs placed in the vessel is calculated using the following example. For an 8 μm blood vessel, the volume for a 1 μm slice is 50 μm3. A blood concentration of 5 Au-mg/g GNPs in this volume equals 2.5 × 10⁻⁴ ng of gold content. For 10 nm GNPs, 2.5 × 10⁻⁴ ng of gold corresponds to 2.5 × 10⁴ individual GNPs.
FIG. 3.
Two GNP vascular distributions are used in the study. (a) GNPs homogeneously distributed in the lumen of vessel. (b) GNPs constrained to the inner vessel wall of the vessel.
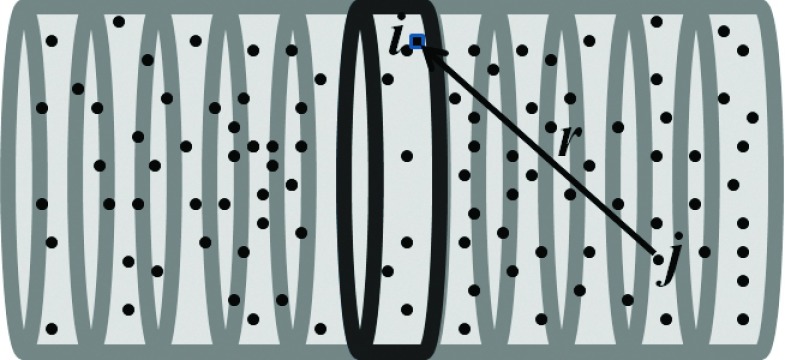
The GNP induced vasculature damage is calculated from the dose deposited by GNPs in the blood vessel to the 2 μm epithelial layer. The calculation voxel size is 10 × 10 × 10 nm3 in a 3D Cartesian grid. The inner vessel wall is defined as the first 10 nm layer of vascular encircling the lumen, where 10 nm is approximately the size of a lipid bilayer cell membrane. The outer vessel wall is defined as the 10 nm layer encircling the whole vessel as shown in Fig. 3. Figure 4 illustrates how the dose from a single GNP to a voxel of the epithelial layer can be defined as di,j(r), where the index i refers to the voxel in the vessel slice, j refers to the jth GNP from the set of GNP in the vessel, and r is the distance from the voxel where the jth GNP is located to the voxel i. The GNP dose distribution di,j(r) is obtained from the MC simulations as described in Sec. 2.A. A slice width of 10 nm is used in the calculation. The spatial dose distribution from GNPs falls off rapidly; the dose from a GNP at 10 μm distance is at least 106 times less than that from a GNP at 10 nm distance (see Fig. 2). We therefore consider the doses from GNPs further than 20 μm away to be negligible. The total dose to the ith position on the vasculature ring can then be calculated as , for r ≤ 20 μm.
FIG. 4.
Illustration of using the radial dose distribution as an input to calculate the integrated dose of a 10 nm thick vessel slice from the contribution of all of the GNPs contained within the vessel.
The total dose to the 10 nm ring of the vessel wall is then the sum of the homogeneous prescribed dose and dose from GNP (Di). In this work, the total GNP dose is calculated by adding the dose contribution from the whole lumen volume. The length of blood vessels is significantly longer than 40 μm, so the dose to this 10 nm thick vessel can represent the dose to the vessel.
For a 5 Au-mg/g GNP blood concentration, a 1 μm long blood vessel with an 8 μm diameter contains 2.5 × 10⁴ individual GNPs; however, not all of them will interact with the particles in the radiation field. The number of GNPs that contribute to the additional radial dose deposition is calculated by multiplying the number of GNPs, the prescribed dose, and the interaction probability per gray for each particle sources.30
Several scenarios were investigated in this study. The dose deposited to the vessel wall from GNPs was calculated for 30 Gy prescribed dose. For protons, 30 Gy is used for all three treatment depths (SOBP1, SOBP2, and SOBP3). For kV photons, the 30 Gy is delivered to 1 mm depth. For 6 MV photons, 30 Gy is delivered to the depths where the particle spectrum was obtained, which are PDD100, PDD80, and PDD50. A single radiation dose of 30 Gy is not commonly used in clinical setting except for stereotactic radiation treatment or palliative treatment. However, a single fraction of high dose is very commonly used for in vivo study to investigate the GNP enhanced radiation treatment. For instance, Hainfeld et al. gave a single dose of x-ray radiation range from 30 to 42 Gy;1–3,11 Kim et al. gave a single dose of proton radiation range from 10 to 46 Gy;6 Joh et al. gave a single dose of 20 Gy.5 The GNP IV injection concentrations based on body weight which have been used in the literature range from 0.2 to 15 Au-mg/g.1–6,11,33 If 5% blood weight per animal is assumed, we can approximate the GNP blood concentration from 4 to 300 Au-mg/g, and we chose 20 Au-mg/g GNP blood concentration in this study. Three vessel sizes were investigated, 8, 14, and 20 μm, all with a 2 μm wall thickness.
3. RESULTS
3.A. GNP induced dose to the vascular wall for three treatment modalities
Figures 5–10 show the additional dose received by the vessel wall for the three radiation modalities for a GNP blood concentration of 20 Au-mg/g in the vessel and a homogeneous 30 Gy dose delivered to the vessel. The diameter of the vessel is 8 μm.
FIG. 5.
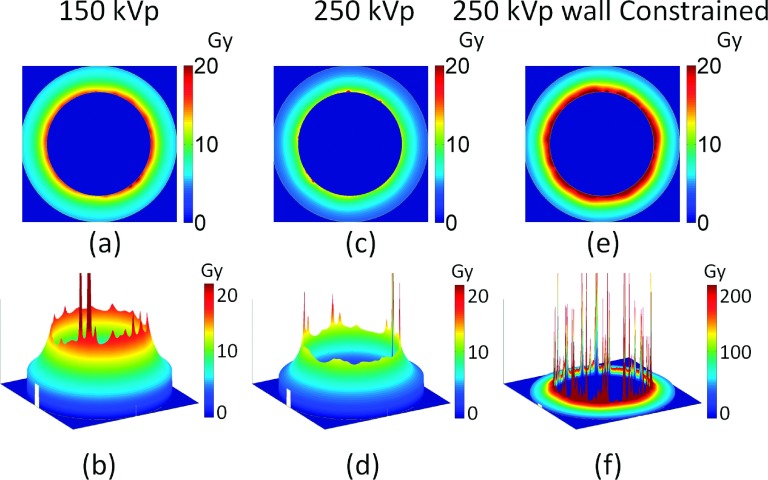
Image of additional dose deposited to the vascular wall for homogeneously distributed GNPs for 150 kVp (a) and (b), and 250 kVp (c) and (d), and for 250 kVp with GNPs constrained to the inner vascular wall of the lumen. The GNP blood concentration is 20 Au-mg/g and the prescribed dose is 30 Gy. The diameter of the vessel is 8 μm.
FIG. 6.
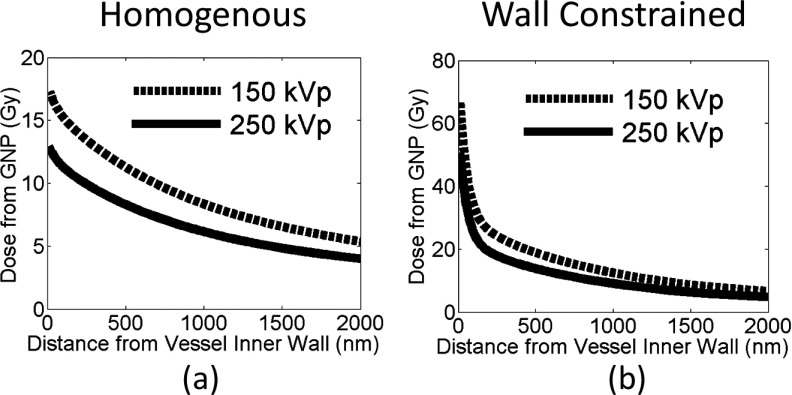
Additional dose deposited to the vascular wall for 30 Gy prescribed dose for 150 and 250 kVp photon beams. The dose is plotted as a function of distance from the inner vessel wall for two GNP distributions: (a) GNPs are homogeneously distributed in the vessel and (b) GNPs constrained to the inner vascular wall of the lumen.
FIG. 7.
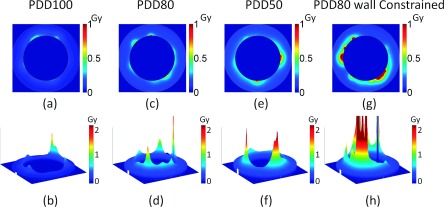
Image of additional dose deposited to the vascular wall for three treatment depths for 6 MV photons, PDD100 (a) and (b), PDD80 (c) and (d), and PDD50 (e) and (f). Two GNP distributions are shown: (a)–(f) GNPs are homogeneously distributed in the vessel and (g) and (h) GNPs constrained to the inner vascular wall of the lumen. The GNP blood concentration is 20 Au-mg/g and the prescribed dose is 30 Gy. The diameter of the vessel is 8 μm.
FIG. 8.
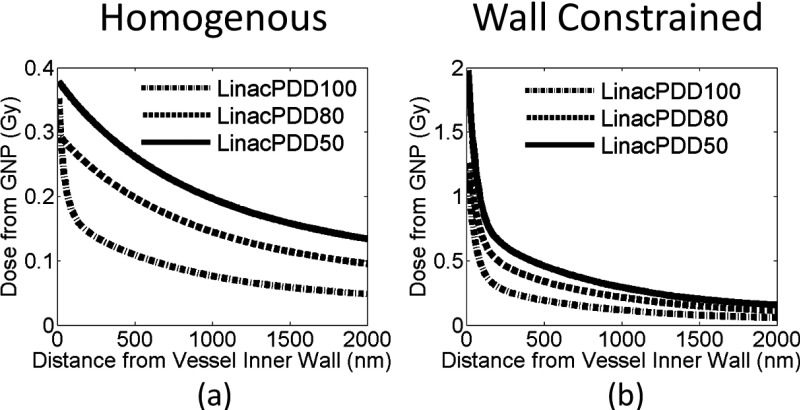
Additional dose deposited to the vessel wall for 30 Gy prescribed dose for a 6 MV photon beam at three depths. The dose is plotted as a function of distance from the inner vascular wall for two GNP distributions, (a) GNPs are homogeneously distributed in the vessel and (b) GNPs constrained to the vascular wall of the lumen.
FIG. 9.
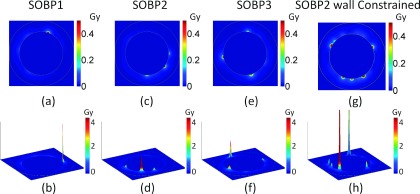
Image of additional dose deposited to the vessel wall for three treatment depths for proton beams, SOBP1 (a) and (b), SOBP2 (c) and (d), and SOBP3 (e) and (f). Two GNP distributions are shown: (a)–(f) GNPs are homogeneously distributed in the vessel and (g) and (h) GNPs constrained to the inner vascular wall of the lumen. The GNP blood concentration is 20 Au-mg/g and the prescribed dose is 30 Gy. The diameter of the vessel is 8 μm.
FIG. 10.
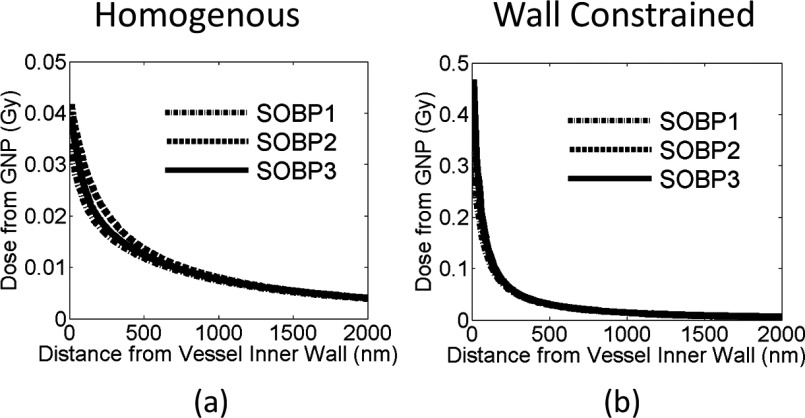
Additional dose deposited to the vessel wall for 30 Gy prescribed dose for the proton SOBP at three depths. The dose is plotted as a function of distance from the inner vessel wall for two GNP distributions, (a) GNPs are homogeneously distributed in the vessel and (b) GNPs constrained to the inner vascular wall of the lumen.
3.A.1. For kV photons
The results for 150 and 250 kVp photon beams are shown in Figs. 5 and 6. The dose from GNPs deposited in the vasculature wall is highly heterogeneous as shown in Fig. 5. There are very high dose spikes near the inner vascular wall caused by GNPs located within several nanometers from the walls. The electron showers that result from GNP interactions with photon beams give rise to very high doses on the nanometer scale. As the distance of the GNPs from the inner vascular wall increases, the dose decreases rapidly due to the limited range of electrons from GNPs.
As shown in Figs. 5 and 6, the GNP induced vasculature damage is more effective for 150 kVp photons than for 250 kVp photons. For GNPs distributed homogeneously in the vessel, the average doses to the inner vessel wall due to the addition of GNPs are 17.4 ± 0.3 Gy and 12.9 ± 0.7 Gy for 150 and 250 kVp, respectively. The dose to the outer vascular wall reduces to 5.4 ± 0.0 Gy and 4.0 ± 0.1 Gy for 150 and 250 kVp, respectively.
If the GNPs are constrained to the wall, as shown in Figs. 5(e), 5(f), and 6(b), the average dose to the inner vascular wall increases to 67.2 ± 1.1 Gy and 50.7 ± 0.3 Gy for 150 and 250 kVp, respectively.
3.A.2. For MV photons
The results for 6 MV photon beams at three depths are shown in Figs. 7 and 8. To compare the enhancement at different depths, water phantom doses were scaled to have 30 Gy delivered at each depth. Figures 7(a)–7(f) and 8(a) show that for homogeneously distributed GNPs, the induced vasculature damage is more effective at deeper depths. The average doses to the vascular due to the addition of GNPs are 0.09, 0.16, and 0.21 Gy for PDD100, PDD80, and PDD50. Figure 8(a) shows that the GNP dose from PDD100 decreases more rapidly in the vessel than the dose from PDD80 and PDD50. The doses to the inner vascular wall due to the addition of GNPs are 0.35 ± 0.03 Gy, 0.30 ± 0.03 Gy, and 0.38 ± 0.04 Gy at inner vascular wall and reduce to 0.05, 0.09, and 0.13 Gy at outer vascular wall for PDD100, PDD80, and PDD50, respectively. The dose to the inner vascular wall is slight higher for PDD100 than PDD80 due to a higher percentage of electron ionization contribution at PDD100. Overall, the increasing effect at deeper depths is due to the higher interaction probability of GNPs with 6 MV photon beams at deeper depths as shown in Table I. This is the result of the increasing portion of photons with kV energy due to Compton scattering.29 These kV photons contribute significantly to the GNP dose because of their higher interaction probability with gold. The GNP dose from the kV photon component also has a longer range than the contribution from the electron component. The vasculature dose induced by the GNP to the outer wall deceased to 15% of the dose to the inner wall for PDD100, and the dose decreased to 33% and 35% for PDD80 and PDD50, respectively.
If the GNPs are constrained to the wall, the average dose to the inner vascular wall increases to 1.26 ± 0.9 Gy, 1.28 ± 0.4 Gy, and 1.98 ± 0.5 Gy for PDD100, PDD80, and PDD50, respectively.
3.A.3. For protons
The results for GNP induced vasculature damage due to the proton field at three depths are shown in Figs. 9 and 10. Similar to the results from photon interaction, the dose from GNPs deposited in the vasculature wall is much higher for the inner vascular wall than the outer vascular wall. There are also high dose spikes near the inner vascular wall caused by GNPs located within several nanometers from the inner walls. There are many fewer high spikes than for kVp photon beams due to the lower interaction probability as shown in Table I. Compared to both kVp and MV photons, the dose decrease from inner wall to outer wall is more rapid for protons due to the short range of secondary electrons from proton interactions in the GNP.
As shown in Figs. 9(a)–9(f) and 10(a), the GNP induced vasculature damage is independent of depths. This is due to the similar interaction probability of GNPs with protons at various depths as shown in Table I. The doses to the inner vascular wall for homogeneously distributed GNPs are only 0.038 ± 0.02 Gy, 0.032 ± 0.02 Gy, and 0.041 ± 0.02 Gy for SOBP1, SOBP2, and SOBP3. The difference for the three depths is negligible compared to the standard deviation. The dose reduces significantly to less than 0.01 Gy at the outer vascular wall for all depths due to the rapid dose fall off for proton beams as shown in Fig. 4(a).
The dose to the inner vascular wall is significantly higher if the GNPs are constrained to the wall as compare to a homogenous GNP distribution in the vascular lumen as shown in Figs. 9(g), 9(h), and 10(b). The dose spikes to the inner vascular wall increase because all GNPs are within 10 nm of the wall. As a result, the doses to the inner wall are 0.51 ± 0.09 Gy, 0.49 ± 0.11 Gy, and 0.48 ± 0.09 Gy for SOBP1, SOBP2, and SOBP3. The dose to the outer vascular wall reduces to below 0.01 Gy, which is very similar to the homogeneous GNP distribution.
3.B. Characteristic of GNP induced dose to the vascular wall
Figures 5, 7, and 9 show that the GNP dose to the vessel is characterized by very high dose spikes near the inner vascular wall caused by GNPs located within several nanometers from the inner walls. In this section, we quantify the probability and number of high dose spikes to the blood vessel.
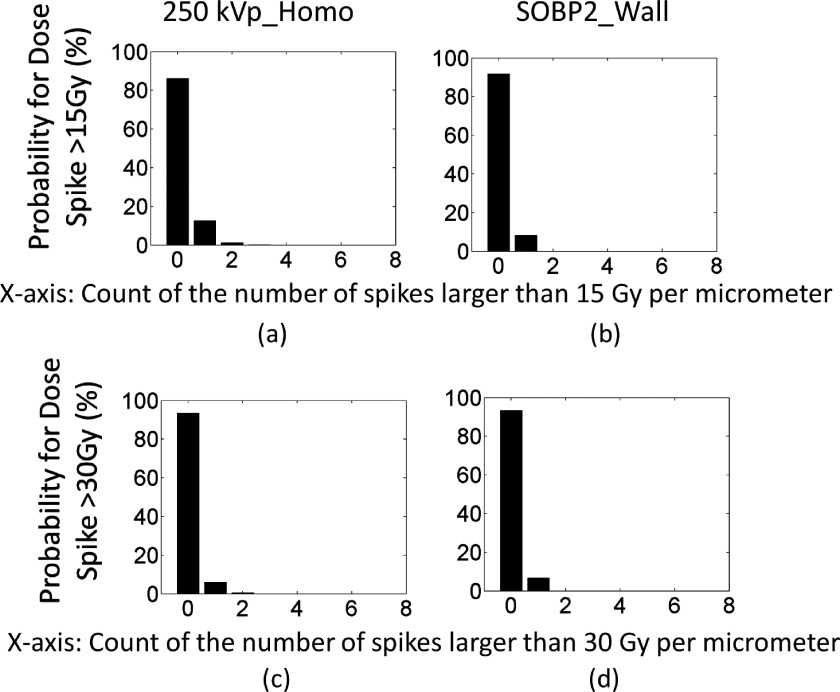
Due to the random distribution of the GNPs, the number and location of the high spikes vary across blood vessels; however, the frequency of the high spikes can be estimated. The GNP dose calculation to a 10 nm thick slice of vasculature for 30 Gy prescribed dose and a GNP blood concentration of 20 Au-mg/g were repeated 2000 times for random GNP distributions to yield a spike count result within 2% error. The chance of having dose spikes higher than 15 and 30 Gy was determined by the number of peaks above these thresholds per micrometer counted for these 2000 simulations. The probabilities of having spikes that are higher than 15 and 30 Gy are shown in Fig. 11. The cause of these high spikes is due to the high dose in close proximity of GNPs, and the strongest spike can be as high as hundreds of gray as shown in Fig. 2. The diameter of these spikes ranges from 10 to 70 nm, sufficient to cause damage to the cell membranes (10 nm thick membrane bilayer)32 and DNA (2 nm diameter of DNA double helix).34
FIG. 11.
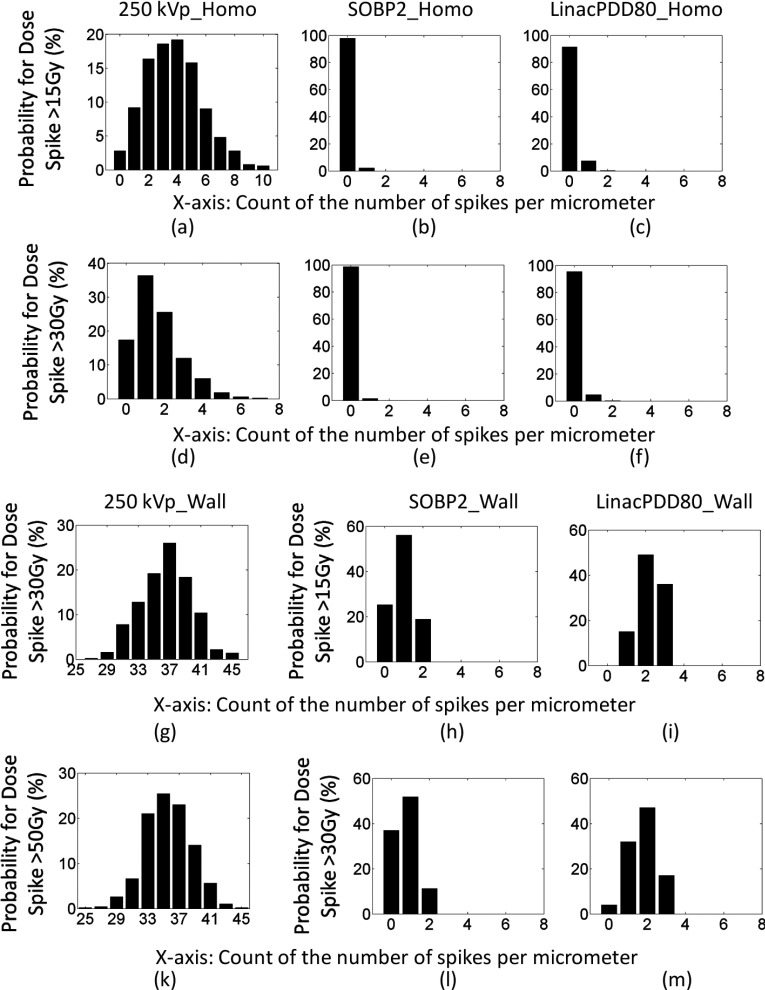
The probability of having high dose spikes for 30 Gy prescribed dose. The x-axis is the number of dose spikes. The y-axis is the probability in percentage. For instance, (a) shows that the chance of having 5 spikes per slice of 1 μm vessel that are higher than 15 Gy is about 16% and the chance of having 10 spikes per slice of 1 μm vessel that are higher than 15 Gy is about 1%. (a)–(f) show the probability for high dose spikes for GNPs homogeneously distributed in the vessel. (g)–(m) show the probability for high dose spikes for GNPs constrained to the inner vascular wall of the lumen.
For kV photons, high spikes are very frequent even for homogeneously distributed GNPs in blood vessels. For instance, the probability of having 10 spikes that are higher than 15 Gy for a given slice of 1 μm vessel is about 1%, and the chance of having at least 5 spikes is about 34%, as shown in Fig. 11(a). The chance that no high dose spike can be found is only 3%. For dose spike higher than 30 Gy, the chance of having at least 5 spikes per slice of 1 μm vessel is about 4% and the chance of having at least one spike is 85%, as shown in Fig. 11(d). In other words, this means that for a slice of 1 mm vessel, the total number of spikes with doses above 15 Gy is approximately 3000. Each spike can potentially cause lethal damage to endothelial cells due to the dense dose deposition pattern similar to high linear energy transfer radiation.35,36 The probability improves further when the GNPs are attached to the inner vessel wall as shown in Figs. 11(g) and 11(k), where high dose spikes higher than 30 and 50 Gy are plotted.
For protons, the probability is calculated for SOBP2. When the GNPs are evenly distributed in the vessel, the chance of having 1 spike that is higher than 15 and 30 Gy is 2% and 1%, respectively, as shown in Figs. 11(b) and 11(e). The probability significantly improves when the GNPs are attached to the inner vessel wall. For instance, the chance of having at least 1 spike that is higher than 15 and 30 Gy increases to 75% and 63%, respectively, as shown in Figs. 11(h) and 11(l).
For MV photons, the probability is calculated for PDD80. When the GNPs are evenly distributed in the vessel, the chance of having at least 1 spike that is higher than 15 and 30 Gy is 9% and 5%, respectively, as shown in Figs. 11(c) and 11(f). The probability significantly increases when the GNPs are attached to the inner vessel wall. For instance, the chance of having at least 1 spike that is higher than 15 and 30 Gy increases to 100% and 96% and the chance of having 3 spikes that are higher than 15 and 30 Gy is 15% and 32%, as shown in Figs. 11(i) and 11(m).
Some of the simulations were repeated for 2 Gy dose and the results are shown in Fig. 12. Although reduced, there is still chance of having a high spike larger than 15 or 30 Gy with a 2 Gy fractionation scheme. For instance, the probability of having at least one spike that is higher than 15 or 30 Gy for 250 kVp photon irradiation is about 14% and 7%, respectively. For proton irradiation, if the GNPs are attached to the inner vascular wall, the probability of having at least one spike that is higher than 15 or 30 Gy is about 8% and 6%, respectively. Even though the high dose spikes persist at 2 Gy fraction dose, their frequency is reduced significantly compared to the 30 Gy fraction.
FIG. 12.
The probability of having high dose spikes for 2 Gy prescribed dose. The x-axis is the number of dose spikes higher than 15 or 30 Gy. The y-axis is the probability in percentage. (a) and (b) show the probability for spikes higher than 15 Gy. (c) and (d) show the probability for spikes higher than 30 Gy.
3.C. GNP induced dose to the vascular wall for various GNP sizes
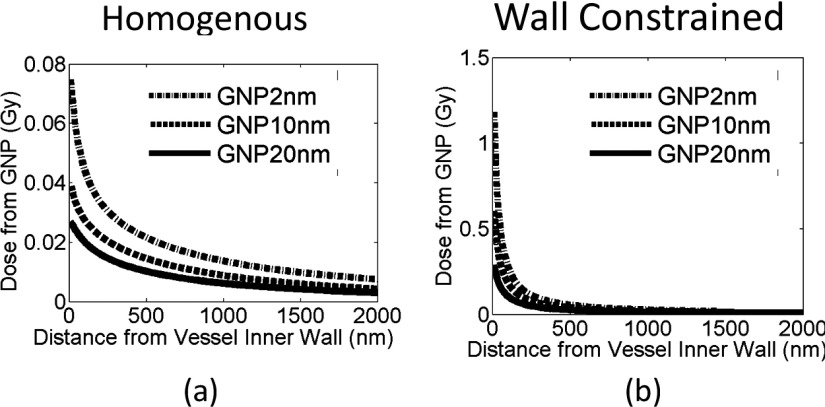
Figure 13 shows the results for GNP induced dose to the vascular wall for three GNP sizes at the same weight concentration of 20 Au-mg/g. The vessel dose is calculated for proton irradiation at the center of the SOBP (SOBP2) for the two GNP distributions in the blood vessel discussed before. As shown in Fig. 12, smaller GNPs cause a much higher endothelial dose and thus potentially more damage to the blood vessel. For instance, when the GNPs are homogeneously distributed in the blood vessel, the dose to the inner vascular wall is 0.06 ± 0.04 Gy, 0.03 ± 0.02 Gy, and 0.02 ± 0.01 Gy for a 2, 10, and 20 nm GNP sizes, respectively. Similarly, the dose to the inner vascular wall is 0.95 ± 0.27 Gy, 0.49 ± 0.11 Gy, and 0.23 ± 0.06 Gy for a 2, 10, and 20 nm GNP if the GNPs are constrained to the inner wall of blood vessel.
FIG. 13.
Additional dose deposited to the vessel wall for 30 Gy prescribed dose. Three different GNP sizes are investigated for a proton SOBP at SOBP2 as indicated in the figure for (a) homogenous GNP distribution in the vessel and (b) GNPs constrained to inner vascular wall.
3.D. GNP induced dose to the vascular wall for various vessel sizes
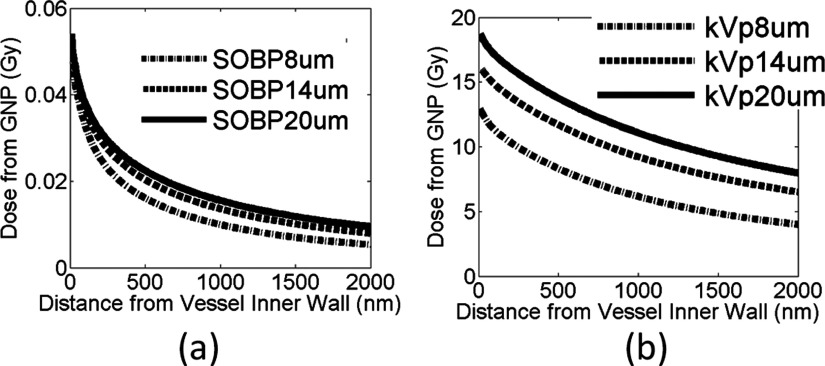
Figure 14 shows the results for both the proton SOBP at SOBP2 and the 250 kVp photon beam. The GNP dose to the vascular wall increases as the vessel size increases. For instance, for the 250 kVp photon beam, the dose to the inner vessel wall is 12.9 ± 0.30 Gy, 16.1 ± 0.18 Gy, and 18.7 ± 0.11 Gy for a 8, 14, and 20 μm vessel size, respectively. For protons at SOBP2, the dose to the inner vascular wall is 0.04 ± 0.01 Gy irrespective of the vessel size. For the same GNP blood concentration, larger blood vessels contain more GNPs that can contribute to the endothelial dose, in particular for kV photons due to the longer range of the secondary electrons. The results show that GNP induced vasculature damage can affect blood vessels of various sizes.
FIG. 14.
Additional dose deposited to the vessel wall for 30 Gy prescribed dose. Three different blood vessel sizes as indicated in the figure are investigated for (a) the proton SOBP at SOBP2 and (b) the 250 kVp photon beam.
4. DISCUSSION
The tumor vascular microenvironment is essential to maintain tumor growth by providing sufficient oxygen and nutrients. Targeting tumor vasculature is an important strategy for tumor control by disrupting the blood supply to downstream tumor cells causing necrosis. Hainfeld et al. irradiated tumors only 2–5 min after the injection of 1.9 nm GNPs in order to take advantage of a high GNP concentration of gold in the blood and observed the tumor becoming hemorrhagic before shrinking.1 In this paper, we investigated the potential vasculature damage from GNPs based on Monte Carlo simulations. Three clinically relevant radiation sources were studied and compared.
For the modalities studied, kV photon beams show the strongest endothelial dose enhancement. This is due to the combination of high interaction probability and long ranged secondary photoelectrons. For 10 nm GNPs, the interaction probability is 1.8 × 10⁻⁴ per gray for 250 kVp photons. For 20 Au-mg/g GNP blood concentration in 8 μm diameter vessels, there are 1.16 × 10⁵ GNPs/μm of the vessel, resulting in approximately 660 ionizations/μm length of the vessel assuming 30 Gy irradiation. For MV photons, the interaction probability is 7.9 × 10⁻⁶ per gray for the depth at PDD80, and thus, there are only about 30 ionizations/μm length of the vessel. Similarly for proton irradiation, there are only about 22 ionizations/μm length of the vessel. For MV photons and protons, there are only a few GNPs in the blood stream that will have interactions with the incident beam and contribute to dose enhancement. However, if GNPs can be actively targeted to the endothelial cells, the GNPs that interacted with the incident beam give rise to high dose spikes that can be higher than 15 Gy. These high spikes are caused by the high dose in close proximity of the GNPs as shown in Fig. 2.
The mechanism of endothelial damage as a result of a single high dose treatment differs from fractionated low dose exposure.17 Endothelial cell damage at low dose fractionated exposure is mainly due to the apoptotic signal initiated from DNA damage, which is shown not to enhance downstream tumor cell death due to the concomitant activation of tumor cell HIF-1. The HIF-1 signal in turn activates the generation of VEGF and other proangiogenic signals to attenuate the radiation induced endothelial apoptosis.19,20 On the other hand, for single high dose radiation (>10 Gy), induced endothelial apoptosis contributes to the downstream cell death significantly. Single high dose radiation initiates the endothelial membrane alterative signal pathway, turning on the transmembrane signaling of apoptosis. This mechanism is mainly caused by radiation damage to the cell membrane.21,22 Our study suggests that the GNP induced endothelial dose is heterogeneously distributed in the endothelial vessel wall and there is a small portion of the inner vessel wall that can receive a dose larger than 10 Gy for kVp and MV photon as well as proton radiation regardless of the prescription dose. Such high dose to the endothelial cell membrane should be sufficient to initiate the apoptotic signal without significantly increasing the dose to the endothelial cell nucleus.
In this study, we reported the GNP dose enhancement on the inner and outer vascular walls. The damage to the endothelial cell nucleus is between these two values. Our estimation of GNP distribution is conservative, and we do not consider any internalization of GNPs into endothelial cells. The GNP dose to the inner vascular wall indicates the radiation damage to the endothelial cell membrane.
A single fraction dose of 30 Gy is used in our study, consistent with most of the in vivo studies of GNP enhanced radiation therapy. Most conventional fractionated radiation therapy follows a 1.5 to 3 Gy per fraction schedule. In such cases, the GNP dose enhancement ratio will not change, but the frequency of high dose spikes will be significantly reduced per fraction. In addition, using untargeted GNPs for fractionated treatments requires the daily injection of GNPs over a couple of weeks, which may not be practical. For hypofractionated treatments, patients can potentially benefit from the addition of GNP to cause enhanced vasculature damage to the tumor, especially through the well known effect of enhanced permeability and retention (EPR), where GNPs can be accumulated through leaky tumor vasculature and retained near the extraluminal surface of the endothelial cells. Further improvement can be achieved using actively targeted GNPs that can attach to or be taken up by endothelial cells for several days.
We showed in this work that the addition of GNPs can cause high doses to small regions of the vasculature. In the recent review by Park et al. on radiation induced vascular changes in humans, it has been shown that radiation dose higher than 10 Gy/fraction induces considerable vascular damage as observed in SRS/SBRT treatment.37 The local dose induced by GNPs can be higher than 15 Gy even for 2 Gy/fraction treatments as shown in Fig. 12. This can be a potential advantage of using GNP as a vasculature targeting agent to cause damage to tumor vessels for conventional fractionated treatments.
Figures 5, 7, and 9 are representative of high dose spikes, however, the actual locations of these spikes can be different as we show in Fig. 11. The highest spikes should happen when an ionization occurs at a GNP that is in immediate proximity of the inner vessel wall. In this case, the spike can reach several hundred of grays as shown in Fig. 2. The size of these spikes ranges from 10 to 70 nm, sufficient to cause damage to the cell membranes and DNA.
The average endothelium dose enhancement calculated from our model appears to be lower than that in previous studies.23–25 There are several potential causes for these differences. First, the secondary electrons used in our study are scored at the surface of a GNP, only taking into account electrons that can escape the GNP and deposit energy outside of the GNP. Even though a large amount of Auger electrons are generated from ionizing events inside the GNP, most of these low energy electrons are stopped inside the GNP.28 Second, we evaluated the GNP enhancement for a homogeneous GNP distribution in the lumen of the vessel. This geometry simulates GNPs spread out evenly in the blood stream as is the case several minutes after IV injection. The endothelial dose calculation with these assumptions results in a lower value compared to GNPs constrained to inner vascular wall, mainly due to the short range of GNP induced dose enhancement.
Kim et al. have shown with in vivo experiments that GNPs as well as iron nanoparticles can be used to enhance proton treatment.6 The 1 yr survival of mice bearing subcutaneous tumor was 58%–100% combining proton and metal nanoparticles versus 11%–13% using proton alone. There are several reasons for the positive results. First, the GNPs are ligand-coated to increase the uptake. In fact, the gold content in tumor to normal tissue ratio was found to be 170, 24 h post injection of the GNPs. As we have shown in our simulation, high concentration of gold accumulated at the extraluminal surface of endothelial cells is critical for causing vasculature damage. Second, in addition to the physical dose enhancement caused by GNPs, other biological component also contributes to the radiosensitization effect of GNPs. Kim et al. showed increased levels of reactive oxygen species (ROS) in the presence of GNPs.6 Jain et al. showed that the GNP radiosensitization effect diminishes in near anoxic conditions.38 These findings suggest that other biological mechanism play a significant role in the magnitude of experimentally observed GNP-induced radiosensitization.
5. CONCLUSIONS
In summary, we found that kV photons cause the largest GNP dose enhancement to the endothelial cells. For MV photon and proton therapy, the average endothelial dose enhancement is below 1%. However, the dose from GNPs can increase the local dose in the proximity of the GNP to the inner membrane of the blood vessel cells by more than 15 Gy even for 2 Gy fractions. We conclude that GNPs have the potential to significantly increase vasculature damage through these high dose spikes from the addition of GNPs.
ACKNOWLEDGMENTS
We thank the Medical Physics Residency Program at Harvard Medical School for generous support to Yuting Lin. We thank Dr. Kathryn Held for providing valuable discussion for this project. This work was partially supported by NIH/NCI Grant No. R01CA187003. We thank Jonathan Jackson and Tao Song of the Enterprise Research Infrastructure and Services (ERIS) group at Partners Healthcare for their in-depth support and smooth computing cluster operations, upgrades, and fixes. S.J.M. is currently supported by a Marie Curie International Outgoing Fellowship from the European Community’s Seventh Framework Programme FP7-PEOPLE-2013-IOF (Project No. 623630).
REFERENCES
- 1.Hainfeld J. F., Slatkin D. N., and Smilowitz H. M., “The use of gold nanoparticles to enhance radiotherapy in mice,” Phys. Med. Biol. 49, N309–N315 (2004). 10.1088/0031-9155/49/18/N03 [DOI] [PubMed] [Google Scholar]
- 2.Hainfeld J. F., Dilmanian F. A., Slatkin D. N., and Smilowitz H. M., “Radiotherapy enhancement with gold nanoparticles,” J. Pharm. Pharmacol. 60, 977–985 (2008). 10.1211/jpp.60.8.0005 [DOI] [PubMed] [Google Scholar]
- 3.Hainfeld J. F., Smilowitz H. M., O’Connor M. J., Dilmanian F. A., and Slatkin D. N., “Gold nanoparticle imaging and radiotherapy of brain tumors in mice,” Nanomedicine 8, 1601–1609 (2013). 10.2217/nnm.12.165 [DOI] [PMC free article] [PubMed] [Google Scholar]
- 4.Chattopadhyay N., Cai Z., Kwon Y., Lechtman E., Pignol J.-P., and Reilly R., “Molecularly targeted gold nanoparticles enhance the radiation response of breast cancer cells and tumor xenografts to X-radiation,” Breast Cancer Res. Treat. 137, 81–91 (2013). 10.1007/s10549-012-2338-4 [DOI] [PubMed] [Google Scholar]
- 5.Joh D. Y., Sun L., Stangl M., Al Zaki A., Murty S., Santoiemma P. P., Davis J. J., Baumann B. C., Alonso-Basanta M., Bhang D., Kao G. D., Tsourkas A., and Dorsey J. F., “Selective targeting of brain tumors with gold nanoparticle-induced radiosensitization,” PLoS One 8, e62425 (2013). 10.1371/journal.pone.0062425 [DOI] [PMC free article] [PubMed] [Google Scholar]
- 6.Kim J.-K., Seo S.-J., Kim H.-T., Kim K.-H., Chung M.-H., Kim K.-R., and Ye S.-J., “Enhanced proton treatment in mouse tumors through proton irradiated nanoradiator effects on metallic nanoparticles,” Phys. Med. Biol. 57, 8309–8323 (2012). 10.1088/0031-9155/57/24/8309 [DOI] [PubMed] [Google Scholar]
- 7.Jain S., Coulter J. A., Hounsell A. R., Butterworth K. T., McMahon S. J., Hyland W. B., Muir M. F., Dickson G. R., Prise K. M., Currell F. J., O’Sullivan J. M., and Hirst D. G., “Cell-specific radiosensitization by gold nanoparticles at megavoltage radiation energies,” Int. J. Radiat. Oncol., Biol., Phys. 79, 531–539 (2011). 10.1016/j.ijrobp.2010.08.044 [DOI] [PMC free article] [PubMed] [Google Scholar]
- 8.Berbeco R. I., Korideck H., Ngwa W., Kumar R., Patel J., Sridhar S., Johnson S., Price B. D., Kimmelman A., and Makrigiorgos G. M., “DNA damage enhancement from gold nanoparticles for clinical MV photon beams,” Radiat. Res. 178, 604–608 (2012). 10.1667/RR3001.1 [DOI] [PMC free article] [PubMed] [Google Scholar]
- 9.Liu C.-J., Wang C.-H., Chen S.-T., Chen H.-H., Leng W.-H., Chien C.-C., Wang C.-L., Kempson I. M., Hwu Y., and Lai T.-C., “Enhancement of cell radiation sensitivity by pegylated gold nanoparticles,” Phys. Med. Biol. 55, 931–946 (2010). 10.1088/0031-9155/55/4/002 [DOI] [PubMed] [Google Scholar]
- 10.Chithrani D. B., Jelveh S., Jalali F., van Prooijen M., Allen C., Bristow R. G., Hill R. P., and Jaffray D. A., “Gold nanoparticles as radiation sensitizers in cancer therapy,” Radiat. Res. 173, 719–728 (2010). 10.1667/RR1984.1 [DOI] [PubMed] [Google Scholar]
- 11.Hainfeld J. M., Dilmanian F. A., Zhong Z., Slatkin D. N., Kalef-Ezra J. A., and Smilowitz H. M., “Gold nanoparticles enhance the radiation therapy of a murine squamous cell carcinoma,” Phys. Med. Biol. 55, 3045–3059 (2010). 10.1088/0031-9155/55/11/004 [DOI] [PubMed] [Google Scholar]
- 12.Garcia-Barros M., Paris F., Cordon-Cardo C., and Lyden D., “Tumor response to radiotherapy regulated by endothelial cell apoptosis,” Science 300, 1155–1159 (2003). 10.1126/science.1082504 [DOI] [PubMed] [Google Scholar]
- 13.Hollebecque A., Massard C., and Soria J.-C., “Vascular disrupting agents: A delicate balance between efficacy and side effects,” Curr. Opin. Oncol. 24, 305–315 (2012). 10.1097/CCO.0b013e32835249de [DOI] [PubMed] [Google Scholar]
- 14.Thorpe P. E., “Vascular targeting agents as cancer therapeutics,” Clin. Cancer Res. 10, 415–427 (2004). 10.1158/1078-0432.CCR-0642-03 [DOI] [PubMed] [Google Scholar]
- 15.Siemann D. W., Bibby M. C., Dark G. G., Dicker A. P., Eskens F. A., Horsman M. R., Marmé D., and LoRusso P. M., “Differentiation and definition of vascular-targeted therapies,” Clin. Cancer Res. 11, 416–420 (2005). [PubMed] [Google Scholar]
- 16.Siemann D. W., Chaplin D. J., and Horsman M. R., “Vascular-targeting therapies for treatment of malignant disease,” Cancer 100, 2491–2499 (2004). 10.1002/cncr.20299 [DOI] [PubMed] [Google Scholar]
- 17.Fuks Z. and Kolesnick R., “Engaging the vascular component of the tumor response,” Cancer Cell 8, 89–91 (2005). 10.1016/j.ccr.2005.07.014 [DOI] [PubMed] [Google Scholar]
- 18.Fens M. and Storm G., “Tumor vasculature as target for therapeutic intervention,” Expert Opin. Invest. Drugs 19, 1321–1388 (2010). 10.1517/13543784.2010.524204 [DOI] [PubMed] [Google Scholar]
- 19.Moeller B. J., Cao Y., Li C. Y., and Dewhirst M. W., “Radiation activates HIF-1 to regulate vascular radiosensitivity in tumors: Role of reoxygenation, free radicals, and stress granules,” Cancer Cell 5, 429–441 (2004). 10.1016/S1535-6108(04)00115-1 [DOI] [PubMed] [Google Scholar]
- 20.Moeller B. J., Dreher M. R., Rabbani Z. N., and Schroeder T., “Pleiotropic effects of HIF-1 blockade on tumor radiosensitivity,” Cancer Cell 8, 99–110 (2005). 10.1016/j.ccr.2005.06.016 [DOI] [PubMed] [Google Scholar]
- 21.Paris F., Fuks Z., Kang A., Capodieci P., and Juan G., “Endothelial apoptosis as the primary lesion initiating intestinal radiation damage in mice,” Science 293, 293–297 (2001). 10.1126/science.1060191 [DOI] [PubMed] [Google Scholar]
- 22.Kolesnick R. and Fuks Z., “Radiation and ceramide-induced apoptosis,” Oncogene 22, 5897–5906 (2003). 10.1038/sj.onc.1206702 [DOI] [PubMed] [Google Scholar]
- 23.Ngwa W., Makrigiorgos G. M., and Berbeco R. I., “Applying gold nanoparticles as tumor-vascular disrupting agents during brachytherapy: Estimation of endothelial dose enhancement,” Phys. Med. Biol. 55, 6533–6548 (2010). 10.1088/0031-9155/55/21/013 [DOI] [PubMed] [Google Scholar]
- 24.Berbeco R. I., Ngwa W., and Makrigiorgos G. M., “Localized dose enhancement to tumor blood vessel endothelial cells via megavoltage x-rays and targeted gold nanoparticles: New potential for external beam radiotherapy,” Int. J. Radiat. Oncol., Biol., Phys. 81, 270–276 (2011). 10.1016/j.ijrobp.2010.10.022 [DOI] [PubMed] [Google Scholar]
- 25.Ngwa W., Makrigiorgos G. M., and Berbeco R. I., “Gold nanoparticle-aided brachytherapy with vascular dose painting: Estimation of dose enhancement to the tumor endothelial cell nucleus,” Med. Phys. 39, 392–398 (2011). 10.1118/1.3671905 [DOI] [PubMed] [Google Scholar]
- 26.Huang C. Y., Oborn B. M., Guatelli S., and Allen B. J., “Monte Carlo calculation of the maximum therapeutic gain of tumor antivascular alpha therapy,” Med. Phys. 39, 1282–1288 (2012). 10.1118/1.3681010 [DOI] [PubMed] [Google Scholar]
- 27.Incerti S., Baldacchino G., Bernal M., Capra R., Champion C., Francis Z., GuÈYe P., Mantero A., Mascialino B., and Moretto P., “The Geant4-DNA project,” Int. J. Model., Simul., Sci. Comput. 1, 157–178 (2010). 10.1142/S1793962310000122 [DOI] [Google Scholar]
- 28.Perl J., Shin J., Schümann J., Faddegon B., and Paganetti H., “TOPAS: An innovative proton Monte Carlo platform for research and clinical applications,” Med. Phys. 39, 6818–6837 (2012). 10.1118/1.4758060 [DOI] [PMC free article] [PubMed] [Google Scholar]
- 29.Lin Y., McMahon S. J., Scarpelli M., Paganetti H., and Schuemann J., “Comparing gold nano-particle enhanced radiotherapy with protons, megavoltage photons and kilovoltage photons: A Monte Carlo simulation,” Phys. Med. Biol. 59, 7675–7689 (2014). 10.1088/0031-9155/59/24/7675 [DOI] [PubMed] [Google Scholar]
- 30.Lin Y., McMahon S. J., Paganetti H., and Schuemann J., “Biological modeling of gold nanoparticle enhanced radiotherapy for proton therapy,” Phys. Med. Biol. 60, 4149–4168 (2015). 10.1088/0031-9155/60/10/4149 [DOI] [PubMed] [Google Scholar]
- 31.Freitas R. A., Nanomedicine, Volume I: Basic Capabilities (Landes Bioscience, Austin, TX, 1999). [Google Scholar]
- 32.Alberts J., Johnson A., Lewis J., Raff M., Roberts A., and Walter P., Molecular Biology of the Cell, 4th ed. (Garland Science, New York, NY, 2002). [Google Scholar]
- 33.Mousavie Anijdan S. H., Mahdavi S. R., Shirazi A., Zarrinfard M. A., and Hajati J., “Megavoltage X-ray dose enhancement with gold nanoparticles in tumor bearing mice,” Int. J. Mol. Cell. Med. 2, 118–124 (2013). [PMC free article] [PubMed] [Google Scholar]
- 34.Hall E. J. and Giaccia A. J., Radiobiology for the Radiologist (Lippincott Williams & Wilkins, Philadelphia, PA, 2012). [Google Scholar]
- 35.Elsässer T. and Scholz M., “Cluster effects within the local effect model,” Radiat. Res. 167, 319–329 (2007). 10.1667/RR0467.1 [DOI] [PubMed] [Google Scholar]
- 36.Scholz M. and Kraft G., “Track structure and the calculation of biological effects of heavy charged particles,” Adv. Space Res. 18, 5–14 (1996). 10.1016/0273-1177(95)00784-C [DOI] [PubMed] [Google Scholar]
- 37.Park H. J., Griffin R. J., Hui S., Levitt S. H., and Song C. W., “Radiation-induced vascular damage in tumors: Implications of vascular damage in ablative hypofractionated radiotherapy (SBRT and SRS),” Radiat. Res. 177, 311–327 (2012). 10.1667/RR2773.1 [DOI] [PubMed] [Google Scholar]
- 38.Jain S., Coulter J. A., Butterworth K. T., Hounsell A. R., McMahon S. J., Hyland W. B., Muir M. F., Dickson G. R., Prise K. M., Currell F. J., Hirst D. G., and O’Sullivan J. M., “Gold nanoparticle cellular uptake, toxicity and radiosensitisation in hypoxic conditions,” Radiother. Oncol. 110, 342–347 (2014). 10.1016/j.radonc.2013.12.013 [DOI] [PubMed] [Google Scholar]


