Abstract
Purpose:
Wall thickness (WT) is an airway feature of great interest for the assessment of morphological changes in the lung parenchyma. Multidetector computed tomography (MDCT) has recently been used to evaluate airway WT, but the potential risk of radiation-induced carcinogenesis—particularly in younger patients—might limit a wider use of this imaging method in clinical practice. The recent commercial implementation of the statistical model-based iterative reconstruction (MBIR) algorithm, instead of the conventional filtered back projection (FBP) algorithm, has enabled considerable radiation dose reduction in many other clinical applications of MDCT. The purpose of this work was to study the impact of radiation dose and MBIR in the MDCT assessment of airway WT.
Methods:
An airway phantom was scanned using a clinical MDCT system (Discovery CT750 HD, GE Healthcare) at 4 kV levels and 5 mAs levels. Both FBP and a commercial implementation of MBIR (VeoTM, GE Healthcare) were used to reconstruct CT images of the airways. For each kV–mAs combination and each reconstruction algorithm, the contrast-to-noise ratio (CNR) of the airways was measured, and the WT of each airway was measured and compared with the nominal value; the relative bias and the angular standard deviation in the measured WT were calculated. For each airway and reconstruction algorithm, the overall performance of WT quantification across all of the 20 kV–mAs combinations was quantified by the sum of squares (SSQs) of the difference between the measured and nominal WT values. Finally, the particular kV–mAs combination and reconstruction algorithm that minimized radiation dose while still achieving a reference WT quantification accuracy level was chosen as the optimal acquisition and reconstruction settings.
Results:
The wall thicknesses of seven airways of different sizes were analyzed in the study. Compared with FBP, MBIR improved the CNR of the airways, particularly at low radiation dose levels. For FBP, the relative bias and the angular standard deviation of the measured WT increased steeply with decreasing radiation dose. Except for the smallest airway, MBIR enabled significant reduction in both the relative bias and angular standard deviation of the WT, particularly at low radiation dose levels; the SSQ was reduced by 50%–96% by using MBIR. The optimal reconstruction algorithm was found to be MBIR for the seven airways being assessed, and the combined use of MBIR and optimal kV–mAs selection resulted in a radiation dose reduction of 37%–83% compared with a reference scan protocol with a dose level of 1 mGy.
Conclusions:
The quantification accuracy of airway WT is strongly influenced by radiation dose and reconstruction algorithm. The MBIR algorithm potentially allows the desired WT quantification accuracy to be achieved with reduced radiation dose, which may enable a wider clinical use of MDCT for the assessment of airway WT, particularly for younger patients who may be more sensitive to exposures with ionizing radiation.
Keywords: CT, MDCT, quantitative imaging, radiation dose, lung morphology, cystic fibrosis, airway
1. INTRODUCTION
Cystic fibrosis (CF) is a life-shortening hereditary disease that affects approximately 70 000–100 000 individuals throughout the world.1 Patients with CF have very thick, tenacious airway mucus that impairs the normal mucociliary clearance of the pulmonary airways. This allows bacteria to flourish in the airways, causing recurrent infections. This in turn leads to airway damage, specifically increased wall thickness (WT) and increased diameter (bronchiectasis). Ultimately, this process results in progressive decrease in lung function and ultimately death.1–3 However, due to advances in the early detection and treatment of this disease, the median life expectancy has risen from early childhood to approximately 40 yr.4 Other diseases that may also cause morphological changes in lung parenchyma include chronic obstructive pulmonary disease (COPD) and asthma.5,6
Wall thickness measured from multidetector computed tomography (MDCT) has shown promise as an imaging biomarker for lung diseases such as CF, COPD, asthma, and as a predictor of pulmonary exacerbation.7–13 Automated and semiautomated methods of WT quantification from MDCT images offer the promise of improved accuracy and efficiency over existing expert reader scoring systems, particularly for mild disease.9,14–19 However, MDCT uses ionizing radiation that might increase the risk of carcinogenesis later in life,20,21 and pediatric patients may be at two to three times greater risk than adults for a given amount of exposure.20,22 Furthermore, as patients’ life expectancy rises, the risk of radiation-induced carcinogenesis might also increase. To promote a wider clinical use of MDCT for the assessment of airway WT, it is highly desirable to reduce radiation dose in MDCT exams.
Recently, the statistical model-based iterative reconstruction (MBIR) algorithms have been introduced to commercial MDCT systems. It has been shown that MBIR can significantly reduce stochastic noise and structured noise streaks caused by photon starvation, leading to a more accurate representation of the subject being scanned.22–25 The purpose of this work is to address the following two questions: First, how does the accuracy of MDCT-based WT quantification change with radiation dose levels when a state-of-the-art MBIR algorithm is used? Second, to achieve a desired performance in the quantification of WT with the minimal radiation dose, what should be the optimal MDCT scan parameters and reconstruction algorithm?
2. METHODS AND MATERIALS
2.A. Airway phantom
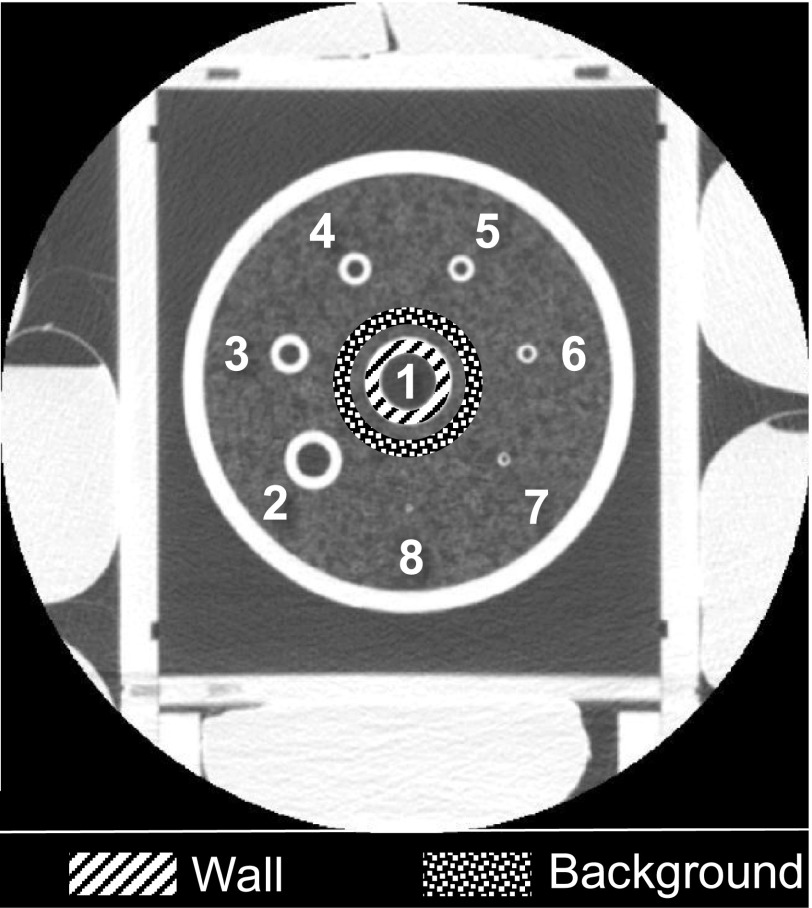
This study used a physical phantom designed to simulate airways of different sizes in children and adolescents (7–18 yr) with cystic fibrosis.26 It consists of eight acrylic tubes with inner diameters ranging from 1 to 16 mm and wall thicknesses ranging from 0.4 to 4.5 mm, respectively (Fig. 1). These tubes were used as the surrogates for airways of different types,26 which are listed in Table I. The tubes are enclosed in a PMMA cylinder with an outer diameter of 13 cm and length of 7.5 cm. The empty space between the tubes and the cylinder is filled with puffed-rice cereal. The overall x-ray attenuation of the phantom is too small to represent even a pediatric patient. To simulate the additional x-ray attenuation from the bony structure and other tissues in the chest, seven saline bags were placed around the airway phantom (Fig. 1). The mean and standard deviation of the CT numbers measured in the cereal in the phantom are −860 and 60 HU, which are similar to the values measured in the lung tissue of a clinical human subject (−850 and 55 HU) under similar scan conditions.
FIG. 1.
A CT image with a relatively large display field of view of 24 cm shows the saline bags surrounding the airway phantom. The index of the eight airways is labeled in the image. ROIs used for measuring the contrast-to-noise ratio of Airway 1 are illustrated in the image.
TABLE I.
Classification of airways in the phantom based on their nominal dimensions.
| Airway type | Tracheal | Mainstem bronchi | Lobar bronchi | Segmental bronchi | Subsegmental bronchi | |||
|---|---|---|---|---|---|---|---|---|
| Airway index | 1 | 2 | 3 | 4 | 5 | 6 | 7 | 8 |
| Inner diameter (mm) | 16 | 10 | 6 | 5 | 4 | 3 | 2 | 1 |
| Wall thickness (mm) | 4.5 | 3.5 | 2.7 | 2.3 | 1.8 | 1.3 | 0.8 | 0.4 |
2.B. CT acquisition and reconstruction methods
The airway phantom was scanned using a 64-slice MDCT system (Discovery CT750HD, GE Healthcare, Waukesha, WI) equipped with both filtered back projection (FBP) and MBIR (V eoTM, GE Healthcare, Waukesha, WI) reconstruction engines. Except for the tube potential (kV) and tube current-rotation time product (mAs), all other scan parameters were selected from a routine chest protocol used at our institution. The scans were performed in helical mode with a pitch of 1.375, the detector configuration was 40 × 0.625 mm, the gantry rotation time was 0.4 s, and the scan field of view was medium body. Four different kV levels [80, 100, 120, 140 kV] and five different mA levels [40, 80, 160, 320, 640 mA] were used. The corresponding radiation exposure levels quantified by the CTDIvol are listed in Table II for all of the 20 kV–mAs combinations.
TABLE II.
CTDIvol (mGy) at each kV–mAs combination.
| kV | ||||
|---|---|---|---|---|
| mAs | 80 | 100 | 120 | 140 |
| 16 | 0.07 | 0.08 | 0.25 | 0.36 |
| 32 | 0.17 | 0.32 | 0.5 | 0.71 |
| 64 | 0.34 | 0.63 | 1.00 | 1.43 |
| 128 | 0.67 | 1.26 | 2.00 | 2.85 |
| 256 | 1.33 | 2.53 | 3.95 | 5.67 |
Images of the airway phantom were reconstructed using both FBP with the standard kernel and MBIR. Note that the particular implementation of MBIR used at our institution does not offer any kernel selection like FBP does. Both the reconstruction slice thickness and slice interval were 0.625 mm. To increase the discrete sampling rate and reduce aliasing, zoom-in reconstruction with a relatively small display field of view of 10 cm was used for WT measurements.
2.C. Assessment of contrast-to-noise ratio (CNR)
The CNR of each airway in the axial CT images was measured using the following formula:
| (1) |
where Meanwall is the mean CT number from the pixels inside an annular region of interest (ROI) located within the wall of each airway, Meanbkg and STDbkg are the mean and standard deviation values of the CT number in a background annular ROI surrounding the airway. A demonstration of the ROIs used for measuring the CNR of Airway 1 is shown in Fig. 1.
2.D. Assessment of wall thickness
The quantification of the airway wall thickness was performed using the matlab software (The MathWorks, Inc., Natick, MA). The center of each airway was determined from the axial images using the following method: the image was divided into several subimages, each containing a single airway. Each subimage was converted to a binary image by a threshold-based segmentation in order to separate the airway structure from the lung background; then, the centroid of each of the segmented subimages was calculated and used as the center of each airway. Next, a total of 360 radial profiles (with 1° interval) intersecting the center of each airway were extracted, and the full width at half maximum (FWHM) of each of the radial profiles was measured (Fig. 2). To assess the repeatability of the WT measurement, these three steps were repeated at five interleaved slice positions separated by 1 cm along the long axis of the phantom. Since the wall-to-lumen and wall-to-lung tissue interfaces were relatively similar in the phantom, no correction to the radial profile was performed as has been done in some human subject studies.17 The smallest airway (Airway 8) was excluded from our analysis since the spatial resolution of the MDCT system was not fine enough to resolve such a small feature. The accuracy of the measured WT values was quantified by the following metrics.
FIG. 2.

Work flow for the WT measurement. (a) The image of the phantom was divided into several subimages, each containing one airway. (b) Radial profiles of the airway were measured along different angular directions. (c) The FWHM values of each radial profile were measured and used for analysis.
2.D.1. Relative bias
For each airway, the relative bias of WT measurements, WTb, was defined as follows:
| (2) |
where WTn is the nominal wall thickness of each airway reported by the manufacturer of the phantom and is the mean FWHM value of each airway averaged across all the 360 radial directions, namely,
| (3) |
Positive and negative WTb values represent overestimation and underestimation of the WT, respectively.
2.D.2. Angular standard deviation
For each airway, the variability of the measured WT across different angular directions was quantified by the standard deviation of WT along the angular direction, σWT, using the following formula:
| (4) |
Larger σWT represents greater variation in the measured WT values along the angular direction.
2.D.3. Sum of squares (SSQs)
To determine the overall accuracy of the WT measurements across all of the 20 kV–mAs combinations, the SSQs of the difference between the measured WT and the nominal WT was calculated for each airway using
| (5) |
where Ni and Nj are the total number of kV and mAs levels used in this study (Ni = 4, Nj = 5). A smaller SSQ means better global accuracy in the measured WT values across all of the 20 kV–mAs combinations.
3. RESULTS
3.A. Contrast-to-noise ratio of airways
The CNR values of Airway 4 at 100 kV and Airway 5 at 80 kV were plotted as a function of mAs in Fig. 3. For FBP reconstructions, the CNR of the airways always decreased with decreasing mAs, whereas the CNR of the airways measured from MBIR images remained relatively constant across the five mAs levels. Representative CT images of the two airways are shown in Fig. 4. The similar behavior in CNR was observed at other kV levels and in other airways. The relaxed dependence of CNR on mAs in MBIR is a result of the relaxed dependence of noise magnitude on radiation exposure level in this algorithm.24
FIG. 3.
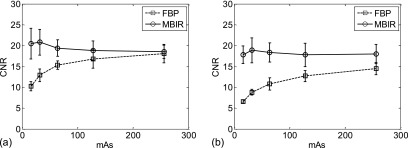
(a) CNR of Airway 4 acquired at 100 kV and five different mAs levels; (b) CNR of Airway 5 acquired at 80 kV and five different mAs levels. The error bar indicates one standard deviation of results obtained from five repeated measurements.
FIG. 4.

(a) FBP and MBIR images of Airway 4 acquired at 100 kV and two different mAs levels. (b) FBP and MBIR images of Airway 5 at 80 kV and two different mAs levels.
3.B. Relative bias of wall thickness
The surface plots in Fig. 5 summarize the relative bias in the measured WT for Airways 1–7 across all of the kV–mAs combinations. The relative biases used in these surface plots are the mean values of five independent measurements from five interleaved slices. FBP underestimated the WT for the two largest airways (negative WT bias) and overestimated the WT for the other five airways (positive WT bias). The magnitude of the relative bias increased with decreasing radiation dose. MBIR significantly reduced the relative bias of WT for all of the seven airways, particularly at the reduced radiation dose levels. The relative WT bias of MBIR was positive most of the time, suggesting that MBIR tended to overestimate the WT. At a given dose level, however, the amount of overestimation in MBIR was significantly less than that in FBP. The magnitude of relative bias in MBIR had much smaller dependence on radiation dose.
FIG. 5.
Surface plots of the relative bias in the measured WT as a function of kV and mAs. (a)–(g) are for Airways 1–7, respectively.
3.C. Angular standard deviation of wall thickness
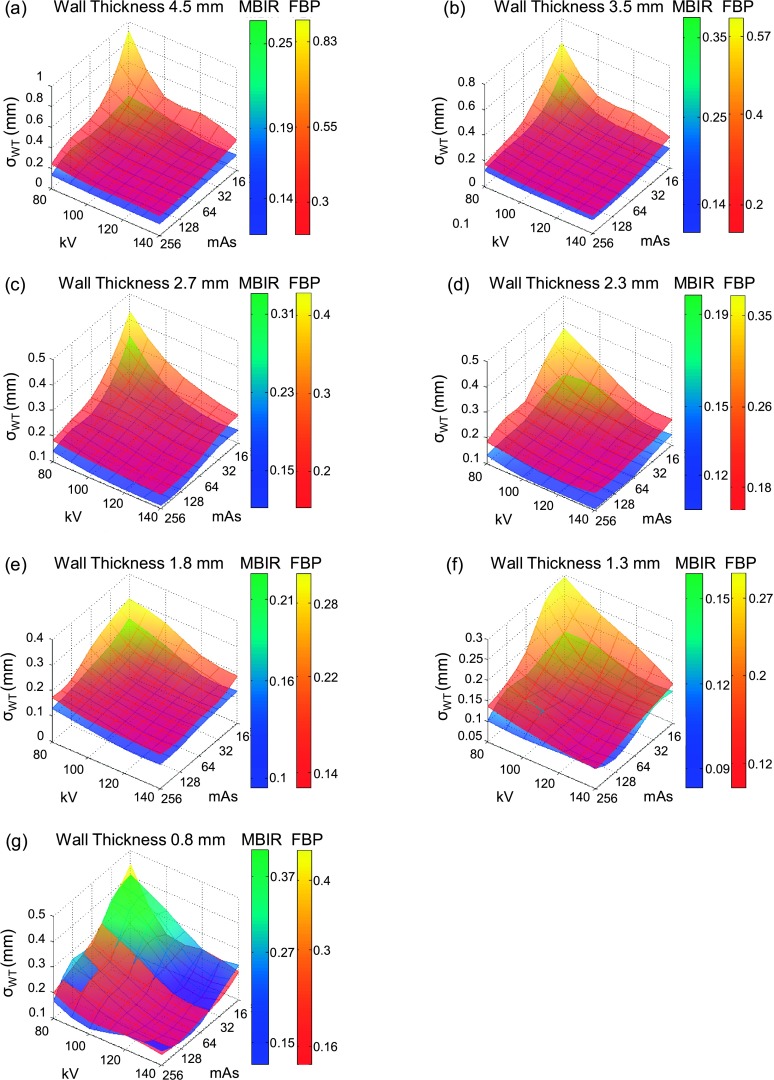
The surface plots in Fig. 6 summarize the angular standard deviation of WT for Airways 1–7 across all of the kV–mAs combinations. These angular standard deviations are the mean values of five independent measurements from five interleaved slices. For FBP, the angular standard deviation increases with decreasing kV or mAs levels, indicating a strong negative correlation between the angular variability of WT and radiation exposure level. For MBIR, the angular standard deviation increased much slower with decreasing kV or mAs. Except for the smallest airway (Airway 7), MBIR resulted in smaller angular variability in the measured WT across all of the kV–mAs combinations. For Airway 7, MBIR resulted in smaller angular variability in WT at kV > 80 and mAs > 32, while FBP led to smaller angular variability at kV = 80 and mAs ≤ 32.
FIG. 6.
Surface plots of the angular standard deviation of the measured WT as a function of kV and mAs. (a)–(g) are for Airways 1–7, respectively.
In addition to the surface plots provided for the WT relative bias and the angular standard deviation of WT, 1D plots of WTb and σWT as a function of CTDIvol are shown in Figs. 7 and 8, respectively. These figures, as a function of dose, allow to generalize the observations from Figs. 5 and 6 to a wider variety of MDCT systems.
FIG. 7.
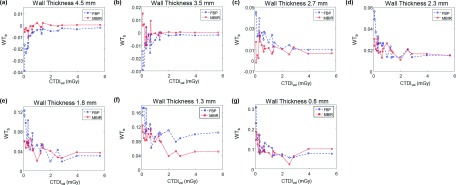
1D plots of the relative bias in the measured WT as a function of CTDIvol. (a)–(g) are for Airways 1–7, respectively.
FIG. 8.
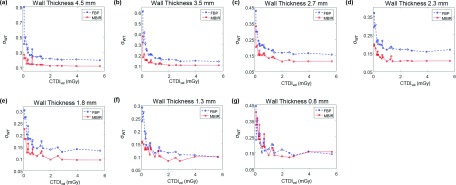
1D plots of the angular standard deviation of the measured WT as a function of CTDIvol. (a)–(g) are for Airways 1–7, respectively.
To optimize scan parameters (kV and mAs) and reconstruction algorithm, a reference protocol was used. The goal of the optimization was to match or surpass the WT quantification accuracy of the reference protocol with the minimal radiation dose. The reference acquisition protocol used 120 kV and 64 mAs, which corresponded to a dose level of 1.0 mGy; the reference reconstruction algorithm was FBP. The relative WT bias and angular standard deviation values of each airway obtained using this reference protocol are listed in Table III. Results of the optimal kV, mAs, and reconstruction algorithms for the seven airways are listed in Table IV, and the corresponding relative WT bias and angular standard deviation are also included in this table. The optimal reconstruction algorithm for all of the airways was MBIR. For Airway 7, MBIR did not lead to any dose reduction, but it resulted in a 27% reduction in relative WT bias and 18% reduction in angular standard deviation; for the other six airways, MBIR resulted in both radiation dose reduction (ranging from 37% to 83%) and quantification accuracy improvement: the relative WT bias was reduced by 7%–53%, and the angular standard deviation was reduced by 4%–29%.
TABLE III.
Quantification accuracy for each airway obtained with the reference protocol of 120 kV, 64 mAs, 1 mGy (CTDIvol), and FBP reconstruction. The value after the ± sign denotes one standard deviation obtained from the data of five interleaved slices.
| Airway index | Nominal WT (mm) | Relative bias | Angular standard (mm) |
|---|---|---|---|
| 1 | 4.5 | −0.004 ± 0.003 | 0.24 ± 0.04 |
| 2 | 3.5 | −0.006 ± 0.008 | 0.17 ± 0.02 |
| 3 | 2.7 | 0.017 ± 0.006 | 0.19 ± 0.02 |
| 4 | 2.3 | 0.014 ± 0.007 | 0.17 ± 0.02 |
| 5 | 1.8 | 0.05 ± 0.01 | 0.14 ± 0.01 |
| 6 | 1.3 | 0.09 ± 0.03 | 0.12 ± 0.01 |
| 7 | 0.8 | 0.11 ± 0.05 | 0.17 ± 0.05 |
TABLE IV.
Optimal kV, mAs, and reconstruction algorithms that achieved or surpassed the WT quantification accuracy of a reference protocol with minimal radiation dose. The reference acquisition protocol is 120 kV, 64 mAs, 1 mGy (CTDIvol), and the reference reconstruction algorithm is FBP. The value after the ± sign denotes one standard deviation obtained from the data of five interleaved slices.
| Airway index | Nominal WT (mm) | Optimal algorithm | Optimal kV | Optimal mAs | Dose (mGy) | Relative bias | Angular standard (mm) |
|---|---|---|---|---|---|---|---|
| 1 | 4.5 | MBIR | 80 | 32 | 0.17 | −0.003 ± 0.004 | 0.23 ± 0.02 |
| 2 | 3.5 | MBIR | 100 | 32 | 0.32 | 0.004 ± 0.008 | 0.15 ± 0.01 |
| 3 | 2.7 | MBIR | 100 | 64 | 0.63 | 0.008 ± 0.006 | 0.16 ± 0.03 |
| 4 | 2.3 | MBIR | 100 | 64 | 0.63 | 0.013 ± 0.008 | 0.12 ± 0.01 |
| 5 | 1.8 | MBIR | 100 | 64 | 0.63 | 0.05 ± 0.02 | 0.13 ± 0.01 |
| 6 | 1.3 | MBIR | 100 | 64 | 0.63 | 0.09 ± 0.03 | 0.11 ± 0.01 |
| 7 | 0.8 | MBIR | 120 | 64 | 1.00 | 0.08 ± 0.02 | 0.14 ± 0.02 |
3.D. Sum of squares
Table V summarizes the SSQ results. For Airways 1–6, MBIR had better global accuracy of the measured WT values, which is consistent with the surface plots of relative WT bias shown in Fig. 5. Results of specific paired t-tests indicate that the differences in the SSQ values between FBP and MBIR for Airways 1–5 are statistically significant. For Airways 6 and 7, the SSQ values of FBP and MBIR were similar; the differences in their SSQ values were statistically nonsignificant.
TABLE V.
Mean ± one standard deviation of the measured SSQ for each airway. The standard deviation was calculated based on data from five interleaved slices. The p value was given by a paired t-test between the SSQ values of FBP and MBIR.
| Airway index | Nominal WT (mm) | SSQ of FBP (mm2) | SSQ of MBIR (mm2) | p value |
|---|---|---|---|---|
| 1 | 4.5 | 1.8 ± 0.4 | 0.12 ± 0.01 | 0.001 |
| 2 | 3.5 | 0.9 ± 0.2 | 0.04 ± 0.01 | 0.002 |
| 3 | 2.7 | 0.24 ± 0.04 | 0.12 ± 0.05 | 0.01 |
| 4 | 2.3 | 0.19 ± 0.02 | 0.09 ± 0.04 | 0.001 |
| 5 | 1.8 | 0.35 ± 0.05 | 0.17 ± 0.07 | 0.004 |
| 6 | 1.3 | 0.6 ± 0.3 | 0.26 ± 0.09 | 0.07 |
| 7 | 0.8 | 0.4 ± 0.2 | 0.47 ± 0.06 | 0.3 |
4. DISCUSSION
This work studied the impact of both radiation dose and reconstruction algorithm on the MDCT assessment of airway WT. Results of the study show that the quantification accuracy of the wall thickness deteriorates with decreasing radiation dose: at reduced radiation dose level, increased image noise makes the profile of the airway highly nonuniform and highly anisotropic along both the radial and angular directions, which increases both the bias and the angular standard deviation of the measured WT. In order to achieve the desired accuracy in the quantification of WT, the radiation dose should be maintained above certain minimal level. By using the MBIR algorithm, the reference radiation dose can be reduced by 37%–83% except for the smallest airway (Airway 7): for this airway, MBIR can be used with the same reference dose to provide a better WT quantification accuracy. The improvement of WT quantification accuracy in MBIR is due to significant noise reduction, particularly at reduced dose levels.
This study has several limitations. First, even though the FWHM method used to measure wall thickness is efficient and practical, it may also be sensitive to image noise and artifacts, particularly for the assessment of small airways and images acquired with very low dose levels. Other techniques such as zero crossing or phase congruency27 can be potentially used in future studies to further improve the measurement accuracy. Moreover, even though the wall thickness is a relevant biomarker for the morphological changes of airways in the lung, it would be interesting to analyze other biomarkers such as the lumen area.14
Although repeated scans of the phantom were not performed in this study, all measurements were repeated at five interleaved slices with enough spatial separation. Since the airways were aligned properly during the CT scan and their structure is uniform across their long axis, this approach should be a decent approximation of repeated scans, but this is subject to future experimental validations.
Another limitation of the study is that the effect of different reconstruction kernels used in FBP was not assessed. High spatial resolution kernels such as edge, bone, lung, and bone plus are known for improving the fidelity of high frequency signals such as the edge of the airway, but they also tend to increase the noise in the final image.28 There are also other iterative reconstruction algorithms such as ASiRTM that could help to reduce such noise when using high frequency kernels; their behavior could be further explored in future studies. Finally, only a single version of MBIR (V eoTM) was used; the study did not assess the impact of the latest version of V eoTM on wall thickness quantification. New tools such as adjustable reconstruction slice thickness, anatomical focus-based reconstruction, and adjustable noise/sharpness settings offered by the latest version of Veo may change certain conclusions drawn from this study.
5. CONCLUSION
In conclusion, the MDCT-based assessment of airway wall thickness was found to have strong dependence on radiation dose and reconstruction algorithm. The performance of wall thickness quantification degrades with decreasing radiation dose; therefore, a minimal amount of radiation dose is needed to achieve the desired quantification accuracy. Compared with FBP, MBIR potentially enables significant reduction in the minimal dose level required to achieve the desired wall thickness quantification accuracy.
ACKNOWLEDGMENTS
This work is partially supported by the following NIH Grant Nos. R01CA169331, UL1TR000427, and KL2TR000428.
REFERENCES
- 1.Cystic Fibrosis World Wide (CFWW), About Cystic Fibrosis, 2015.
- 2.National Heart Lung and Blood Institute (NHLBI), Cystic Fibrosis, 2015.
- 3.World Health Organization (WHO), Genomics: Cystic Fibrosis, 2015.
- 4.Cystic Fibrosis Foundation (CFF), Life expectancy for people with CF, 2015.
- 5.National Heart Lung and Blood Institute (NHLBI), COPD, 2015.
- 6.National Heart Lung and Blood Institute (NHLBI), Asthma, 2015.
- 7.Brody A., Kosorok M., Li Z., Broderick L., Foster J., and Laxova A., “Reproducibility of a scoring system for computed tomography scanning in cystic fibrosis,” J. Thorac. Imaging 21, 14–21 (2006). 10.1097/01.rti.0000203937.82276.ce [DOI] [PubMed] [Google Scholar]
- 8.Sanders D., Li Z., and Brody A., “Chest CT predicts the frequency of pulmonary exacerbations in children with cystic fibrosis,” Ann. Am. Thorac. Soc. 12, 64–69 (2014). 10.1513/AnnalsATS.201407-338OC [DOI] [PMC free article] [PubMed] [Google Scholar]
- 9.DeBoer E., Swiercz W., and Heltshe S., “Automated CT scan scores of bronchiectasis and air trapping in cystic fibrosis,” Chest 145, 593–603 (2014). 10.1378/chest.13-0588 [DOI] [PMC free article] [PubMed] [Google Scholar]
- 10.Calder A., Bush A., Brody A., and Owens C., “Scoring of chest CT in children with cystic fibrosis: State of the art,” Pediatr. Radiol. 44, 1496–1506 (2014). 10.1007/s00247-013-2867-y [DOI] [PubMed] [Google Scholar]
- 11.Kosciuch J., Krenke R., Gorska K., Zukowska M., M M.-W., and Chazan R., “Relationship between airway wall thickness assessed by high-resolution computed tomography and lung function in patients with asthma and chronic obstructive pulmonary disease,” J. Physiol. Pharmacol. 60, 71–76 (2009). [PubMed] [Google Scholar]
- 12.Hartley R., Barker B., Pakkal M., Newby C., Siddiqui S., Brightling C., and Gupta S., “Can quantitative computed tomography (QCT) differentiate between asthma & COPD in patients with similar degrees of airflow limitation?,” Eur. Respir. J. 44, 4971–4974 (2014). [Google Scholar]
- 13.Oguma T., Hirai T., Fukui M., Tanabe N., Marumo S., Nakamura H., Ito H., Sato S., Niimi A., Matsumoto H., Muro S., and Mishima M., “Longitudinal shape irregularity of airway lumen assessed by CT in patients with bronchial asthma and COPD,” Thorax 70, 1–6 (2015). 10.1136/thoraxjnl-2014-206651 [DOI] [PubMed] [Google Scholar]
- 14.Wielpütz M., Eichinger M., Weinheimer O., Ley S., and Mall M., “Automatic airway analysis on multidetector computed tomography in cystic fibrosis: Correlation with pulmonary function testing,” J. Thorac. Imaging 28, 104–113 (2013). 10.1097/RTI.0b013e3182765785 [DOI] [PubMed] [Google Scholar]
- 15.Goris M., Zhu H., Blankenberg F., Chan F., and Robinson T., “An automated approach to quantitative air trapping measurements in mild cystic fibrosis,” Chest 123, 1655–1663 (2003). 10.1378/chest.123.5.1655 [DOI] [PubMed] [Google Scholar]
- 16.Odry B., Kiraly A., and Godoy M., “Automated CT scoring of airway diseases: Preliminary results,” Acad. Radiol. 17, 1136–1145 (2010). 10.1016/j.acra.2010.04.019 [DOI] [PubMed] [Google Scholar]
- 17.Venkatraman R., Raman R., Raman B., Moss R., Rubin G., Mathers L., and Robinson T., “Fully automated system for three-dimension bronchial morphology analysis using volumetric multidector computed tomography of the chest,” J. Digit. Imaging 19, 132–139 (2006). 10.1007/s10278-005-9240-0 [DOI] [PMC free article] [PubMed] [Google Scholar]
- 18.Lassen B., Van Rikxoort E., Schmidt M., Kerkstra S., Van Ginneken B., and Kuhnigk J., “Automatic segmentation of the pulmonary lobes from chest CT scans based on fissures, vessels, and bronchi,” IEEE Trans. Med. Imaging 32, 210–222 (2013). 10.1109/TMI.2012.2219881 [DOI] [PubMed] [Google Scholar]
- 19.Hoffman E., BA S., and G M., “A structural and functional assessment of the lung via multidetector-row computed tomography: Phenotyping chronic obstructive pulmonary disease,” Proc. Am. Thorac. Soc. 3, 519–532 (2006). 10.1513/pats.200603-086MS [DOI] [PMC free article] [PubMed] [Google Scholar]
- 20.National Research Council, “Health risks from exposure to low levels of ionizing radiation: BEIR VII – Phase 2. Committee to Assess Health Risks from Exposure to Low Levels of Ionizing Radiation,'' Washington, DC (National Academies Press, 2006). [PubMed]
- 21.National Council on Radiation Protection and Measurements, “Ionizing radiation exposure of the population of the United States,'' NCRP Report No. 160, Bethesda, MD (National Council on Radiation Protection and Measurements, 2009).
- 22.Yu L., Liu X., and Leng S., “Radiation dose reduction in computed tomography: Techniques and future perspective,” Imaging Med. 1, 65–84 (2009). 10.2217/iim.09.5 [DOI] [PMC free article] [PubMed] [Google Scholar]
- 23.Thibault J., Sauer K., Bouman C., and Hsieh J., “A three-dimensional statistical approach to improved image quality for multislice helical CT,” Med. Phys. 34, 4526–4544 (2007). 10.1118/1.2789499 [DOI] [PubMed] [Google Scholar]
- 24.Li K., Jie T., and Chen G.-H., “Statistical model based iterative reconstruction (MBIR) in clinical CT systems: Experimental assessment of noise performance,” Med. Phys. 41, 041906 (15pp.) (2014). 10.1118/1.4867863 [DOI] [PMC free article] [PubMed] [Google Scholar]
- 25.Healthcare G., “Veo: A new breakthrough is re-writing the rules of low-dose CT imaging,” CT Clarity magazine 32–37 (2011). [Google Scholar]
- 26.Robinson T., Long F., Raman P., Saha P., Emond M., Reinhardt J., Raman R., and Brody A., “An airway phantom to standardize CT acquisition in multicenter clinical trials,” Acad. Radiol. 16, 1134–1141 (2009). 10.1016/j.acra.2009.02.018 [DOI] [PubMed] [Google Scholar]
- 27.Estepar S., Washko G., Silverman E., Reilly J., Kikinis R., and Westin C., “Accurate airway wall estimation using phase congruency,” in Medical Image Computing and Computer-Assisted Intervention (Springer-Verlag, Berlin-Heidelberg, 2006), Vol. 4191, pp. 125–134. [DOI] [PubMed] [Google Scholar]
- 28.Rodriguez A., Ranallo F., Judy P., Gierada D., and Fain S., “CT reconstruction techniques for improved accuracy of lung CT airway measurement,” Med. Phys. 41, 111911 (8pp.) (2014). 10.1118/1.4898098 [DOI] [PMC free article] [PubMed] [Google Scholar]


