

Abstract
Background
In men, the long-term consequences of low serum levels of sex steroids, vitamin D metabolites, and insulin-like growth factor 1 (IGF-1) on the evolution of muscle mass, muscle strength, or physical performance are unclear. Moreover, there are no data about the relationship between these hormones and incident sarcopenia defined as low muscle mass and function. The aim of this study was to determine whether the baseline levels of sex hormones, vitamin D metabolites, and IGF-1 predict changes in muscle mass, muscle strength, physical performance, and incident sarcopenia.
Methods
In 518 men aged 40–79 years, recruited for participation in the European Male Ageing Study, total, free, and bioavailable testosterone (T), oestradiol (E), sex hormone-binding globulin, IGF-1, 25-hydroxyvitamin D (25OHD), 1,25-dihydroxyvitamin D (1,25(OH)2D), and parathyroid hormone were assessed at baseline. Appendicular lean mass (aLM), gait speed, and grip strength were measured at baseline and after a mean follow-up of 4.3 years. Sarcopenia was defined by the definition of Baumgartner (relative aLM ≤7.26 kg/m2), the International Working Group on Sarcopenia (IWGS), and the European Working Group on Sarcopenia in Older People (EWGSOP).
Results
aLM significantly decreased from age 50 years, while gait speed and grip strength significantly decreased from age 70 years. The incidence of sarcopenia by the definitions of Baumgartner, IWGS, and EWGSOP was 8.1%, 3.0%, and 1.6%, respectively. After adjustment for age, centre, body mass index, smoking, and number of comorbidities at baseline, baseline levels of T and vitamin D metabolites were not associated with change in aLM, gait speed, and/or grip strength, while a high baseline level of total E2 was associated with a greater decrease in aLM. In men aged ≥70 years, low IGF-1 was associated with a greater decrease in gait speed. Baseline endocrine variables were not independently associated with an increased risk of incident sarcopenia by any definition.
Conclusions
Low levels of T and 25OHD do not predict loss of muscle mass, gait speed, or grip strength in middle-aged and elderly community-dwelling European men. Low IGF-1 predicts change in gait speed in men aged ≥70 years.
Keywords: Muscle mass, Muscle strength, Physical performance, Sarcopenia, Prospective, Men
Introduction
Loss of muscle mass and strength is a key feature of the ageing process that predisposes to disability, limited mobility, falls, fractures, and death.1 In 1989, Rosenberg introduced the term sarcopenia to describe the age-related loss of muscle mass.2 A consensus on the concept of sarcopenia is however still lacking. Currently, some expert groups use the term sarcopenia to indicate the age-related loss of muscle mass and strength, while other authors suggest to confine sarcopenia to its original meaning of loss of muscle mass and have introduced the term dynapenia to describe the age-related loss of muscle strength.3 Accordingly, the operational definition of sarcopenia varies from low relative appendicular skeletal muscle mass (RASM)4 to definitions that add muscle strength and/or physical performance.1,5–8 Recently, the Foundation for the National Institutes of Health Sarcopenia Project proposed operational criteria for sarcopenia with evidence-based cutpoints for low muscle mass, weakness, and slowness.8
Several techniques exist to measure muscle mass, muscle strength, and physical performance. Computed tomography (CT) and magnetic resonance imaging are gold standards to measure muscle mass, but their use is restricted to research purposes because of high cost, limited availability, and in the case of CT, radiation exposure.1 Dual-energy X-ray absorptiometry (DXA) is one of the alternative methods to assess muscle mass in research and clinical settings, although its availability and use in clinical practice are still not very broad.1,9 Several longitudinal studies have reported age-related changes in muscle mass using DXA, but mainly in the elderly.10,11 We are aware of only one study that has described the 6-year change in muscle mass in middle-aged Japanese men and women.12 Similarly, most longitudinal studies that have examined the age-related decline in muscle strength include elderly individuals,13 with few data in middle-aged persons separately (<60 years).14
Low serum levels of sex steroids, in particular testosterone (T), as well as 25-hydroxyvitamin D (25OHD) and insulin-like growth factor 1 (IGF-1) have been considered to be potential risk factors for sarcopenia since these hormones are involved in the proliferation and myogenic differentiation of satellite cells and promote muscle protein synthesis.15 1,25-dihydroxyvitamin D (1,25(OH)2D), the active metabolite of 25OHD, also regulates the synthesis of proteins that influence calcium transport and muscle contractility, and vitamin D status also affects inflammation as well as insulin secretion and sensitivity, all factors that have been linked to sarcopenia.15,16 However, longitudinal studies about the association between these anabolic hormones and changes in either muscle mass, muscle strength, or physical performance are scanty and conflicting. In most male or mixed cohorts, low serum levels of total, free, and/or bioavailable T were associated with loss of muscle mass17,18 but not muscle strength17,19–21 over a 2 to 10-year follow-up. The association between T and change in physical performance was less consistent, with no association with total T unless in men who experienced weight loss17,19,20 and inconsistent results for free T.19,20 Less is known about the longitudinal associations between oestradiol (E2) or sex hormone-binding globulin (SHBG) and change in muscle mass, strength, or physical performance,17,19,21 and prospective studies exploring the relationship with vitamin D metabolites have reported inconsistent results for 25OHD and are lacking for 1,25(OH)2D. In some cohorts, low baseline 25OHD was associated with loss of muscle strength and/or decline in physical performance,22–24 but in others, this association was not observed.25,26 Low 25OHD was not associated with a significant change in muscle mass, but this has been scantily investigated.22,24 There are to date, to our knowledge, no prospective data looking at the association between these hormones and sarcopenia defined by low muscle mass and low muscle function. The Longitudinal Ageing Study Amsterdam (LASA) is the only prospective study that has investigated the association between low 25OHD and a threshold level of loss of muscle mass or strength, thus incident sarcopenia.22 Other, cross-sectional, studies that have examined the association between 25OHD and prevalent sarcopenia found significantly lower 25OHD in subjects with low muscle mass27,28 although in one of these not in men.28
The aim of our study was to determine in a prospective cohort of middle-aged and elderly men (i) changes in muscle mass, muscle strength, and physical performance; (ii) whether any change can be predicted by baseline levels of sex hormones, vitamin D metabolites, and IGF-1; and (iii) whether baseline levels of these hormones predict incident sarcopenia defined by low muscle mass alone as well as by low muscle mass and function.
Materials and methods
Subjects
Men aged 40–79 years were recruited from population registers in Manchester, UK, and Leuven, Belgium, for participation in the European Male Ageing Study (EMAS). Details concerning the study design and recruitment have been described previously.29 Briefly, in 2003–05, community-dwelling men were invited to attend by a letter of invitation which included a postal questionnaire. Those who agreed to participate attended a local clinic for an interviewer-assisted questionnaire and clinical and biological assessments. In 2007–09, participants were invited to take part in a repeat survey. Ethical approval for the study was obtained in accordance with local institutional requirements. All subjects provided written informed consent.
Study questionnaires and clinical assessments
The postal questionnaire gathered information on smoking and medical conditions, including heart diseases, high blood pressure, pituitary disease, testicular disease, chronic bronchitis, asthma, peptic ulcer, epilepsy, diabetes, liver conditions, kidney conditions, prostate disease, adrenal disease, and thyroid disease. The interviewer-assisted questionnaire asked about current drugs. Height was measured to the nearest 1 mm using a stadiometer (Leicester Height Measure, SECA Ltd, UK) and body weight to the nearest 0.1 kg using an electronic scale (SECA, model no. 8801321009, SECA Ltd, UK). Physical performance was measured with a component of the Reuben's physical performance test [seconds taken to walk 50 ft (15.24 m)],30 with gait speed expressed as metres per second. Follow-up investigations were performed using similar assessments after a median interval of 4.3 years [standard deviation (SD) = 0.6].
Hormonal measurements
A fasting morning venous blood sample was taken at baseline in all subjects. Measurement of T and E2 was carried out by gas chromatography–tandem mass spectrometry, and SHBG was measured by the Modular E170 platform electrochemiluminescence immunoassay. Free and bioavailable T and E2 were derived from total hormone, SHBG, and albumin using previously described mass action equations and association constants.31 Serum was assayed for PTH and IGF-1 by chemiluminescence immunoassay. 25OHD was measured using radioimmunoassay and 1,25(OH)2D3 by liquid chromatography–tandem mass spectrometry by an in Leuven developed and validated method.32
Measurement of muscle mass and muscle strength
At baseline and follow-up, subjects had whole-body DXA scans performed on QDR 4500A Discovery scanners (Hologic Inc, Bedford, MA, USA), with measurement of appendicular lean mass (aLM). Scans were analysed using Hologic APEX 4.0 software. DXA-measured aLM is assumed to be a good indicator of skeletal muscle mass.33 The precision error was 0.57% in Leuven (n = 20) and 0.56% in Manchester (n = 31). Devices were cross-calibrated with the European Spine Phantom. Muscle strength was evaluated by measuring grip strength with the Jamar 1 hand-held dynamometer (TEC Inc., Clifton, NJ, USA). Maximal grip strength was recorded as the highest of three measurements at both sides.34 Low grip strength is related to poor physical performance, mobility limitations, and disability35,36 and is used as a surrogate endpoint for functional performance in several recent operational definitions of sarcopenia.1,5–8
Definition of sarcopenia
Sarcopenia was defined using three approaches. The first definition was that of Baumgartner et al. who defined sarcopenia in men as RASM (aLM/height2) ≤ 7.26 kg/m2.4 The second was that of the International Working Group on Sarcopenia (IWGS), by which men with RASM ≤ 7.23 kg/m2 and gait speed < 1.0 m/s are sarcopenic.5 The third was based on the definition of the European Working Group on Sarcopenia in Older People (EWGSOP), by which a person with low muscle mass has pre-sarcopenia, a person with also low physical performance or low muscle strength has sarcopenia, and a person with all three criteria has severe sarcopenia.1 Since EWGSOP suggests several cut-offs for these three criteria, we defined low muscle mass as RASM ≤ 7.26 kg/m2, low physical performance as gait speed < 0.8 m/s, and low muscle strength as grip strength < 30 kg, as recently published.37
Statistical analysis
Descriptive statistics were used to summarize subject baseline characteristics, including age, body mass index (BMI), smoking, number of comorbidities, sex steroids (total, free, and bioavailable T and E2 and SHBG), IGF-1, 25OHD, 1,25(OH)2D, and parathyroid hormone (PTH), as well as aLM, RASM, gait speed, and grip strength. We categorized the number of comorbidities into 0, 1, and ≥2 comorbidities since few subjects (4.1%) have ≥3 comorbidities. Differences in aLM, gait speed, and grip strength between baseline and follow-up were determined using the paired t-test. Prevalent sarcopenia by the definition of Baumgartner, IWGS, and EWGSOP was calculated at baseline and follow-up. Incident sarcopenia was defined as the prevalence of sarcopenia at follow-up though not at baseline. Analyses with incident sarcopenia by EWGSOP also included men with severe sarcopenia. aLM, gait speed, and grip strength at baseline and follow-up as well as percentage (%) change per year in these variables were calculated in men aged 40–79 years and in four 10-year age bands, both in the whole cohort and in the two centres separately. Annual % change was calculated as [(follow-up-baseline)/baseline]*100/time between baseline and follow-up. The annual % change in aLM, gait speed, and grip strength per 10-year age band was visually assessed using bar plots. Linear regression was used to determine the strength of the association between baseline hormones as continuous variables and either annual % change in aLM, gait speed, and grip strength in the whole cohort as well as in men aged 60–79 years and 70–79 years, separately. The analyses were adjusted for age, centre, BMI, smoking, and number of comorbidities at baseline by including these variables in the multivariable models. The analyses with total T, total E2, and IGF-1 were also adjusted for SHBG and the analyses with SHBG for total T or E2. Results were expressed as β-coefficients and 95% confidence intervals (CI). For ease of interpretation and comparison, we standardized the independent variables into z-scores. The hormones were also categorized into quintiles and 25OHD in <10, 10–20, and ≥20 ng/mL. We also categorized individuals as normal or hypogonadal (total T < 8 or < 11 nmol/L or free T < 220 pmol/L38). When a significant difference had been observed in change in aLM, gait speed, or grip strength between Leuven and Manchester, analyses were repeated in the centres separately. We used logistic regression to determine the associations between baseline hormones and the risk of incident sarcopenia by the three definitions, with results expressed as odds ratios (OR) and 95%CI. These analyses were performed in the whole cohort and in men aged 60–79 years. Results were adjusted for potential confounders. Statistics were performed using stata 11.2.
Results
Subjects
Of the 716 men who participated in the baseline and follow-up survey, 198 men were excluded because of missing aLM or RASM data or because they were taking musculoskeletal active therapies (calcium, vitamin D, bisphosphonates, or glucocorticoids), leaving 518 subjects in the main analysis, of whom 255 were ≥60 years. Twelve persons with missing gait speed and 73 persons with missing grip strength were also excluded, leaving 506 men in the analysis with gait speed and the IWGS definition of sarcopenia and 433 men in the analysis with grip strength and the EWGSOP definition of sarcopenia, respectively. Mean age of the 518 subjects was 60.0 (SD = 10.3) years and BMI 27.2 (SD = 3.7) kg/m2 (Table 1).
Table 1.
Subject characteristics at baseline
| Variables | Mean (SD) | n (%) |
|---|---|---|
| n = 518 | ||
| Age (years) | 60.0 (10.3) | |
| Weight (kg) | 83.1 (12.9) | |
| Height (cm) | 176.0 (28.9) | |
| BMI (kg/m2) | 27.2 (3.7) | |
| Total T (nmol/L) | 18.1 (6.0) | |
| Free T (pmol/L) | 320.1 (88.7) | |
| Total E2 (pmol/L) | 77.2 (25.0) | |
| Free E2 (pmol/L) | 1.3 (0.4) | |
| SHBG (nmol/L) | 42.4 (19.1) | |
| IGF-1 (ng/mL) | 137.1 (39.1) | |
| 25OHD (ng/mL) | 30.1 (13.2) | |
| 1.25(OH)2D (pg/mL) | 60.5 (15.5) | |
| PTH (pg/mL) | 28.9 (11.2) | |
| Ever smoked (yes vs. no) | 306 (59.8) | |
| Number of comorbidities | ||
| 0 | 305 (59.6) | |
| 1 | 122 (23.8) | |
| ≥2 | 85 (16.6) | |
| aLM (kg) | 24.8 (3.5) | |
| RASM (kg/m2) | 8.07 (0.93) | |
| aBaumgartner sarcopenia | 81 (15.6) | |
| n = 506 | ||
| Gait speed (m/s) | 1.2 (0.2) | |
| bIWGS sarcopenia | 12 (2.4) | |
| n = 433 | ||
| Grip strength (kg) | 44.3 (8.9) | |
| cEWGSOP sarcopenia | 6 (1.3) | |
| cEWGSOP severe sarcopenia | 1 (0.2) | |
Results expressed as mean (SD) and percentage.
aLM, appendicular lean mass; BMI, body mass index; E, oestradiol; EWGSOP, European Working Group on Sarcopenia in Older People; IGF-1, insulin-like growth factor-1; IWGS, International Working Group on Sarcopenia; PTH, parathyroid hormone; RASM, relative appendicular skeletal muscle mass; SD, standard deviation; SHBG, sex hormone-binding globulin; T, testosterone; 1.25(OH)2D, 1,25-dihydroxyvitamin D; 25OHD, 25-hydroxyvitamin D.
Baumgartner sarcopenia = RASM ≤ 7.26 kg/m2.4
IWGS sarcopenia = RASM ≤ 7.23 kg/m2 + gait speed < 1.0 m/s.5
EWGSOP sarcopenia = RASM ≤7.26 kg/m2 + gait speed <0.8 m/s or grip strength <30 kg; severe sarcopenia = RASM ≤7.26 kg/m2 + gait speed <0.8 m/s + grip strength <30 kg.1
Incidence of sarcopenia
Based on the Baumgartner definition of sarcopenia, 76.3% (n = 395) had no prevalent sarcopenia at baseline and follow-up, while 8.1% (n = 42) without sarcopenia at baseline developed sarcopenia at follow-up (‘incident’ sarcopenia) (Table 2). Of the 506 men in the analysis that defined sarcopenia by IWGS, 3.0% (n = 15) without prevalent sarcopenia at baseline became sarcopenic at follow-up. By EWGSOP, 1.4% (n = 6) developed sarcopenia and 0.2% (n = 1) developed severe sarcopenia.
Table 2.
Number of subjects with sarcopenia at baseline and follow-up
| FOLLOW UP, N (%) |
||
|---|---|---|
| No sarcopenia | Sarcopenia | |
| aBaumgartner sarcopenia (N = 518) | ||
| BASELINE, N (%) | ||
| No sarcopenia | 395 (76.3) | 42 (8.1) |
| Sarcopenia | 16 (3.1) | 65 (12.5) |
| bIWGS sarcopenia (N = 506) | ||
| BASELINE, N (%) | ||
| No sarcopenia | 479 (94.7) | 15 (3.0) |
| Sarcopenia | 4 (0.8) | 8 (1.6) |
| FOLLOW UP, N (%) |
||||
|---|---|---|---|---|
| No sarcopenia | Pre-sarcopenia | Sarcopenia | Severe sarcopenia | |
| cEWGSOP sarcopenia (N = 433) | ||||
| BASELINE, N (%) | ||||
| No sarcopenia | 334 (77.1) | 30 (6.9) | 5 (1.2) | 0 (0) |
| Pre-sarcopenia | 13 (3.0) | 42 (9.7) | 1 (0.2) | 1 (0.2) |
| Sarcopenia | 1 (0.2) | 1 (0.2) | 4 (0.9) | 0 (0) |
| Severe sarcopenia | 0 (0) | 0 (0) | 0 (0) | 1 (0.2) |
EWGSOP, European Working Group on Sarcopenia in Older People; IWGS, International Working Group on Sarcopenia; RASM, relative appendicular skeletal muscle mass.
Baumgartner sarcopenia = RASM ≤ 7.26 kg/m2.4
IWGS sarcopenia = RASM ≤ 7.23 kg/m2 + gait speed < 1.0 m/s.5
EWGSOP pre-sarcopenia = RASM ≤ 7.26 kg/m2; sarcopenia = RASM ≤ 7.26 kg/m2 + gait speed < 0.8 m/s or grip strength < 30 kg; severe sarcopenia = RASM ≤ 7.26 kg/m2 + gait speed < 0.8 m/s + grip strength < 30 kg1.
Percentages of subjects with incident sarcopenia or severe sarcopenia are marked in bold.
Change in appendicular lean mass, gait speed, and grip strength
Across all age bands, men had a significant mean annual loss of 0.36% (SD = 1.09) of aLM and 0.15% (SD = 3.20) of gait speed, while grip strength was not significantly different (Table 3). Mean annual % loss of aLM was higher in Leuven than in Manchester [−0.46% (SD = 1.11) vs. −0.22% (SD = 1.03), P = 0.011; not shown], but annual % change in gait speed and grip strength were not statistically different between the centres. Looking at changes per 10-year age bands, aLM started to decrease in men aged 40–49 years, but the loss was only significant from age 50 years. Mean annual % loss of aLM was significantly greater in persons aged 60–69 and 70–79 years as compared with 40–49 years (Figure 1). Men aged ≥60 years lost gait speed and grip strength, but this was only significant in the oldest age band (Table 3). Compared with men aged 40–49 years, who had a stable gait speed and a significant increase in grip strength, annual % loss of gait speed was significantly greater in men aged 70–79 years and annual % loss of grip strength significantly greater in men from age 60 years (Figure1).
Table 3.
Appendicular lean mass (aLM), gait speed, and grip strength at baseline (B) and follow-up (FU) and % change per year
| Baseline | Follow-up | % change/yeara | |
|---|---|---|---|
| aLM | kg | %/year | |
| 40–49 | 26.6 (3.7) | 26.5 (3.7) | −0.03 (0.94) |
| 50–59 | 25.3 (3.3) | 25.0 (3.3)*** | −0.29 (0.99) |
| 60–69 | 24.3 (3.2) | 23.6 (3.2)*** | −0.57 (1.12) |
| 70–79 | 22.9 (2.6) | 22.4 (2.6)*** | −0.53 (1.20) |
| 40–79 | 24.8 (3.5) | 24.4 (3.5)*** | −0.36 (1.09) |
| Gait speed | m/s | %/year | |
|---|---|---|---|
| 40–49 | 1.26 (0.15) | 1.27 (0.15) | 0.36 (2.88) |
| 50–59 | 1.18 (0.16) | 1.18 (0.18) | 0.23 (3.22) |
| 60–69 | 1.14 (0.17) | 1.12 (0.17) | −0.09 (3.07) |
| 70–79 | 1.10 (0.18) | 1.04 (0.18)*** | −1.24 (3.35) |
| 40–79 | 1.17 (0.17) | 1.16 (0.19)* | −0.15 (3.20) |
| Grip strength | kg | %/year | |
|---|---|---|---|
| 40–49 | 48.2 (8.0) | 49.9 (8.5)** | 0.92 (2.93) |
| 50–59 | 46.4 (8.9) | 47.1 (8.8) | 0.70 (3.73) |
| 60–69 | 43.8 (7.6) | 42.9 (8.3) | −0.34 (3.23) |
| 70–79 | 38.2 (7.6) | 36.1 (8.1)*** | −1.18 (3.15) |
| 40–79 | 44.3 (8.9) | 44.2 (9.8) | 0.06 (3.41) |
Results expressed as mean [standard deviation (SD)].
P-value for the difference between B and FU calculated using t-test.
% change per year = ([FU–B]/B)*100/time between B and FU.
P < 0.05.
P < 0.01.
P < 0.001.
Figure 1.
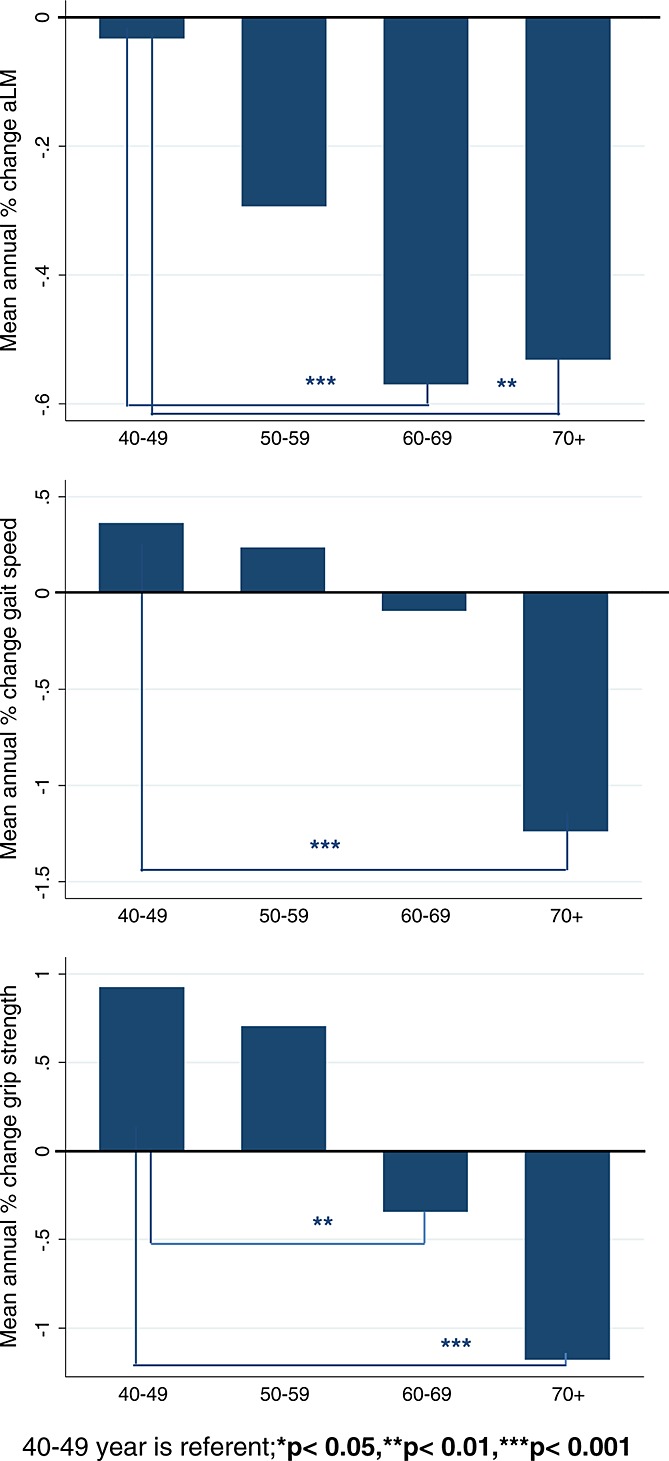
Annual % change in appendicular lean mass, gait speed, and grip strength by 10-year age band.
Baseline hormones and change in appendicular lean mass, gait speed, and grip strength
Total T was not associated with annual % change in aLM, gait speed, or grip strength (Table 4). Neither of the two threshold levels of total T for hypogonadism was associated with higher loss of aLM, gait speed, or grip strength (shown for cut-off at 8 nmol/L). Free T was positively associated with annual % change in grip strength, and men with free T below the threshold for hypogonadism had a greater decrease in gait speed and grip strength as compared with persons with free T above this threshold, however these results became non-significant after adjustment for age, centre, BMI, smoking, and number of comorbidities. Total E2 was negatively associated with change in aLM, with an annual 0.104% greater decrease in aLM per SD increase in total E2, and this association remained significant after adjustment for age, centre, BMI, smoking and number of comorbidities, and also after further adjustment for SHBG. Free E2 was negatively associated with change in aLM, but only after adjustment for confounders. Results for bioavailable T and E2 were comparable with those for free T and E2 (not shown). Each SD increase in SHBG was associated with a greater decrease in aLM, but not after adjustment for confounders. No significant associations were observed between T, E2, and SHBG and change in aLM, gait speed, or grip strength in men aged 60–79 or 70–79 years separately (not shown). In men ≥70 years, IGF-1 was positively associated with change in gait speed, with an annual 0.773% greater decrease in gait speed per SD decrease in IGF-1 after adjustment for age, centre, BMI, smoking, and number of comorbidities. This association remained significant after further adjustment for SHBG. In men aged 40–79 years, a positive association was also observed between IGF-1 and aLM, but after adjustment, this association only remained significant in subjects from Leuven, where mean annual % aLM loss was significantly greater than in Manchester (β = 0.146; 95%CI 0.023,0.269; P = 0.020).
Table 4.
Association between baseline hormones and annual % change in appendicular lean mass, gait speed, and grip strength
| Annual % change aLM |
Annual % change gait speed |
Annual % change grip strength |
||||
|---|---|---|---|---|---|---|
|
β-coefficient (95%CI) |
β-coefficient (95%CI) |
β-coefficient (95%CI) |
||||
| Unadjusted | Adjusteda | Unadjusted | Adjusteda | Unadjusted | Adjusteda | |
| Total T (per SD) | −0.051 (−0.145, 0.044) | −0.091 (−0.193, 0.011) | 0.041 (−0.240, 0.322) | −0.033 (−0.342, 0.276) | 0.206 (−0.120, 0.532) | 0.100 (−0.257, 0.456) |
| Total T (nmol/L) | ||||||
| ≥8 | referent | referent | referent | referent | referent | referent |
| <8 | −0.234 (−0.953, 0.485) | −0.107 (−0.852, 0.638) | −1.378 (−3.618, 0.861) | −1.380 (−3.759, 0.998) | 0.310 (−2.255, 2.874) | 0.992 (−1.528, 3.511) |
| Free T (per SD) | 0.049 (−0.045, 0.143) | −0.070 (−0.177, 0.037) | 0.187 (−0.093, 0.467) | −0.082 (−0.405, 0.242) | 0.368 (0.043, 0.692)* | −0.116 (−0.489, 0.257) |
| Free T (pmol/L) | ||||||
| ≥220 | referent | referent | referent | referent | referent | referent |
| <220 | −0.025 (−0.304, 0.253) | 0.183 (−0.106, 0.472) | −1.076 (−1.912, −0.239)* | −0.636 (−1.523, 0.250) | −1.057 (−2.031, −0.083)* | −0.294 (−1.309, 0.722) |
| Total E2 (per SD) | −0.104 (−0.198, −0.010)* | −0.132 (−0.228, −0.036)** | 0.004 (−0.277, 0.285) | −0.010 (−0.302, 0.282) | 0.050 (−0.272, 0.372) | 0.024 (−0.308, 0.356) |
| Free E2 (per SD) | −0.054 (−0.149, 0.040) | −0.108 (−0.204, −0.011)* | 0.047 (−0.234, 0.328) | −0.026 (−0.318, 0.267) | 0.093 (−0.228, 0.413) | −0.058 (−0.390, 0.273) |
| SHBG (per SD) | −0.127 (−0.221, −0.034)** | −0.076 (−0.185, 0.033) | −0.190 (−0.468, 0.088) | −0.031 (−0.360, 0.297) | −0.178 (−0.495, 0.139) | 0.157 (−0.213, 0.528) |
| IGF-1 (per SD) | ||||||
| 40–79 years | 0.125 (0.030, 0.221)* | 0.081 (−0.017, 0.180) | 0.113 (−0.174, 0.399) | −0.078 (−0.375, 0.220) | 0.193 (−0.137, 0.522) | −0.013 (−0.349, 0.323) |
| ≥70 years | 0.114 (−0.112, 0.340) | 0.127 (−0.117, 0.371) | 0.707 (0.085, 1.329)* | 0.773 (0.126, 1.419)* | 0.046 (−0.602, 0.694) | 0.080 (−0.608, 0.767) |
| 25OHD (per SD) | −0.079 (−0.175, 0.017) | −0.069 (−0.165, 0.027) | −0.033 (−0.326, 0.260) | −0.003 (−0.300, 0.293) | −0.227 (−0.560, 0.106) | −0.203 (−0.539, 0.133) |
| 25OHD (ng/mL) | ||||||
| <10 | 0.453 (−0.166, 1.073) | 0.290 (−0.322, 0.902) | −0.407 (−2.276, 1.461) | −0.822 (−2.692, 1.048) | 2.203 (0.143, 4.263)* | 1.770 (−0.273, 3.813) |
| 10–20 | 0.196 (−0.037, 0.430) | 0.144 (−0.088, 0.376) | 0.470 (−0.242, 1.183) | 0.315 (−0.400, 1.031) | 0.288 (−0.503, 1.078) | 0.267 (−0.524, 1.058) |
| ≥20 | referent | referent | referent | referent | referent | referent |
| 1.25(OH)2D (per SD) | −0.028 (−0.146, 0.090) | −0.000 (−0.126, 0.125) | 0.051 (−0.282, 0.384) | 0.127 (−0.229, 0.483) | −0.492 (−0.895, −0.090)* | −0.400 (−0.831, 0.031) |
| 1.25(OH)2D (pg/mL) | ||||||
| ≤47.1 | referent | referent | referent | referent | referent | referent |
| 47.2–54.7 | 0.042 (−0.330, 0.413) | 0.031 (−0.343, 0.406) | 0.341 (−0.700, 1.382) | 0.575 (−0.475, 1.624) | −0.553 (−1.862, 0.755) | −0.442 (−1.776, 0.892) |
| 55.0–61.7 | −0.065 (−0.434, 0.304) | −0.055 (−0.425, 0.315) | 0.280 (−0.761, 1.321) | 0.414 (−0.638, 1.467) | −0.604 (−1.925, 0.716) | −0.289 (−1.647, 1.068) |
| 62.0–73.6 | 0.009 (−0.358, 0.375) | 0.062 (−0.312, 0.436) | −0.019 (−1.040, 1.002) | 0.160 (−0.890, 1.209) | −0.437 (−1.713, 0.840) | −0.258 (−1.586, 1.070) |
| ≥73.7 | −0.042 (−0.413, 0.330) | 0.051 (−0.341, 0.443) | 0.198 (−0.835, 1.231) | 0.473 (−0.622, 1.569) | −1.679 (−2.961, −0.398)* | −1.335 (−2.707, 0.038) |
| PTH (per SD) | 0.020 (−0.074, 0.114) | 0.063 (−0.033, 0.160) | 0.177 (−0.101, 0.455) | 0.266 (−0.024, 0.555) | 0.035 (−0.284, 0.355) | 0.061 (−0.268, 0.391) |
β-coefficient is the mean difference in annual % change.
aLM, appendicular lean mass; BMI, body mass index; CI, confidence interval; E, oestradiol; IGF-1, insulin-like growth factor-1; PTH, parathyroid hormone; SHBG, sex hormone-binding globulin; SD, standard deviation; T, testosterone; 25OHD, 25-hydroxyvitamin D.
P < 0.05.
P < 0.01.
***P < 0.001.
Adjusted for age, centre, BMI, smoking, and number of comorbidities.
25-hydroxyvitamin D and PTH were not associated with change in aLM, gait speed, or grip strength, nor as continuous variables (Table 4) nor in quintiles (not shown). When 25OHD was categorized in <10, 10–20, and ≥20 ng/mL, men with 25OHD < 10 ng/mL had a greater increase in grip strength as compared with men with ≥20 ng/mL, but this result became not significant after adjustment for age, centre, BMI, smoking, and number of comorbidities. When 1,25(OH)2D was categorized into quintiles, men with 1,25(OH)2D in the highest quintile had an annual 1.679% greater decrease in grip strength than men with 1,25(OH)2D in the lowest quintile, but also this association became not significant after adjustment for confounders. No significant associations were observed between 25OHD, 1,25(OH)2D, and PTH and change in aLM, gait speed, or grip strength in men aged 60–79 or 70–79 years, separately (not shown).
Prediction of incident sarcopenia
Logistic regression was used to determine the association between baseline hormones and incident sarcopenia by the three definitions. With the outcome defined as sarcopenia by Baumgartner (RASM ≤ 7.26 kg/m2), no associations were observed (not shown). With IWGS sarcopenia as the outcome (RASM ≤ 7.23 kg/m2 and gait speed < 1.0 m/s), higher baseline levels of SHBG and 25OHD increased the odds of sarcopenia by 78% and 80%, respectively, but these results became non-significant after adjustment for age, centre, BMI, smoking, and number of comorbidities (Table 5). The odds of sarcopenia by EWGSOP (RASM ≤ 7.26 kg/m2, gait speed < 0.8 m/s, and/or grip strength < 30kg) increased with higher baseline levels of 25OHD and decreased with higher baseline levels of free T and IGF-1, but also these results became non-significant after adjustment for confounders. Results were comparable in men aged 60–79 years separately (not shown).
Table 5.
Association between baseline hormones and incident sarcopenia
| Incident sarcopenia by IWGS |
Incident sarcopenia by EWGSOP |
|||
|---|---|---|---|---|
| OR (95%CI) |
||||
| Unadjusted | Adjusteda | Unadjusted | Adjusteda | |
| Total T (per SD) | 1.54 (0.97, 2.44) | 1.41 (0.80, 2.47) | 0.75 (0.34, 1.68) | 0.78 (0.31, 1.95) |
| Free T(per SD) | 0.82 (0.48, 1.37) | 1.19 (0.58, 2.45) | 0.46 (0.22, 0.96)* | 0.69 (0.24, 1.97) |
| Total E2 (per SD) | 0.86 (0.50, 1.49) | 0.98 (0.53, 1.80) | 1.06 (0.52, 2.18) | 1.11 (0.47, 2.64) |
| Free E2 (per SD) | 0.58 (0.31, 1.08) | 0.83 (0.43, 1.62) | 0.86 (0.40, 1.88) | 1.06 (0.46, 2.47) |
| SHBG (per SD) | 1.78 (1.28, 2.48)** | 1.62 (1.00, 2.64) | 1.50 (0.97, 2.34) | 1.25 (0.61, 2.56) |
| IGF-1 (per SD) | 0.78 (0.44, 1.38) | 0.89 (0.49, 1.63) | 0.26 (0.09, 0.76)* | 0.29 (0.07, 1.18) |
| 25OHD (per SD) | 1.80 (1.11, 2.92)* | 1.60 (0.95, 2.72) | 2.08 (1.12, 3.84)* | 1.91 (0.91, 4.01) |
| 1.25(OH)2D (per SD) | 0.98 (0.50, 1.92) | 0.62 (0.25, 1.53) | 1.69 (0.62, 4.62) | 1.75 (0.50, 6.06) |
| PTH (per SD) | 0.76 (0.42, 1.35) | 0.80 (0.40, 1.60) | 0.79 (0.35, 1.81) | 0.98 (0.40, 2.38) |
BMI, body mass index; CI, confidence interval; E, oestradiol; EWGSOP, European Working Group on Sarcopenia in Older People; IGF-1, insulin-like growth factor-1; IWGS, International Working Group on Sarcopenia; OR, odds ratio; PTH, parathyroid hormone; SD, standard deviation; SHBG, sex hormone-binding globulin; T, testosterone; 1.25(OH)2D, 1,25-dihydroxyvitamin D; 25OHD, 25-hydroxyvitamin D.
P < 0.05.
P < 0.01.
***P < 0.001.
Adjusted for age, centre, BMI, smoking, and number of comorbidities.
Discussion
In this prospective study, aLM significantly decreased in European men from age 50 years, while gait speed and grip strength significantly decreased after the seventh decade. The incidence of sarcopenia by the definitions of Baumgartner, IWGS, and EWGSOP was 8.1%, 3.0%, and 1.6%, respectively, over a follow-up of 4.3 years. After adjustment for age, centre, BMI, smoking, and number of comorbidities at baseline, baseline levels of T and vitamin D metabolites were not associated with change in aLM, gait speed, and/or grip strength. A high baseline level of total E2 was associated with a greater decrease in aLM, while low baseline IGF-1 correlated with a greater decrease in gait speed in men aged ≥70 years and a greater decrease in aLM in men aged 40–79 years from Leuven. Baseline endocrine variables were not independently associated with an increased risk of incident sarcopenia by any definition.
In men aged 40–79 years, we observed a significant mean annual loss of 0.36% of aLM and 0.15% of gait speed, and a non-significant mean annual gain of 0.06% of grip strength over a 4.3-year follow-up. Men aged 70–79 years lost on average 0.53% of aLM per year. Changes in body composition with DXA in elderly men have been reported previously, with, over 2 years, aLM losses from 0.8% to 2.77% in men aged ≥70 years.10,11 In middle-aged men changes in body composition have been less well investigated. We observed a significant decrease in aLM from age 50 years and older, with an annual 0.29% decrease in men aged 50–59 years. This is comparable with a prospective study in 40- to-79-year-old Japanese men, in whom a significant decrease of leg LM (−1.3% over 6 years) was observed in men in their 50s.12 Notwithstanding, in this and our study, the decrease in LM was more marked in the elderly. We are not aware of other studies that have reported longitudinal changes in body composition measured with DXA in middle-aged (and elderly) European men.
Grip strength significantly increased up to age 40–49 years and then remained stable. A decline did not start until the seventh decade and the loss only became significant in men aged 70–79 years. In another longitudinal study that examined the change in grip strength in middle-aged and elderly men, grip strength increased up to age 40 years and immediately started to decrease thereafter, although 30% of the subjects aged 40–59 years and 15% of the subjects aged ≥60 years did not lose grip strength.14 Thus, we conclude from this and our study that, after an increase until the age of 40–49 years, grip strength remains stable in at least a part of middle-aged persons before it starts to decrease. At age 70 years, when the annual % decline of grip strength became significant in our study, this loss was higher than that of aLM. Longitudinal changes in muscle strength have indeed been reported to be greater than changes in muscle mass, probably due to concomitant declines in neuromuscular control.11 In the Health ABC study, for example, the annual leg strength decline was three times greater than the rate of decline of leg LM.11 The annual 1.18% decrease in grip strength we observed in men ≥70 years old is smaller than in men with a mean age of 74.9 years from LASA (−13.2%/3 years) and slightly smaller than in men with a mean age of 73.7 years from Health ABC (−5.8%/3 years).20 As in EMAS, participants in Health ABC are well-functioning elderly men, while LASA includes frail elderly, which may account for the greater decline in grip strength.
Similarly to grip strength, gait speed started to decrease in men of ≥60 years, and the loss was significant in the oldest age band. Gait speed < 1 and < 0.8 m/s has been reported to predict mortality and adverse outcomes, respectively.39 In our study, however, even in the oldest men, mean gait speed at follow-up was ≥1.0 m/s.
Total, free, and bioavailable T were not associated with change in aLM, gait speed, or grip strength. The lack of association between low T and loss of grip strength is in agreement with other prospective studies,17,19–21 and the failure to show an association between low T and a greater decline in physical performance is consistent with findings in some but not in all cohorts.17,20 In MINOS and MrOS, low levels of T were associated with more loss of muscle mass.17,18 How can we explain the lack of association between T and change in muscle parameters in our cohort? The mean age of our study participants was 60.0 years, while this ranged from 68.0 to 74.9 years in other male cohorts.17,18,20 As mentioned earlier, a significant decrease in gait speed and grip strength occurred after the seventh decade and the greatest decrease in aLM also occurred in men ≥60 years. Moreover, most participants had T levels within the normal range, as the prevalence of hypogonadism, defined by total T < 8 nmol/L, total T < 11 nmol/L, or free T < 220 pmol/L,38 was 1.8%, 10.3%, and 13.2%, respectively (not shown). Thus, the relatively young age, low prevalence of hypogonadism, and the small power for subanalyses in elderly individuals might explain why we did not find an association between T and change in muscle mass, gait speed, or grip strength.
There are few published data about the role of E2 in the preservation of muscle mass and function. Androgens might convert into oestrogens through aromatization and activate the oestrogen receptors or oestrogens might have an independent effect. However, T alone and not its aromatization into E2 seems responsible for the anabolic effect of T on muscle mass in men since T replacement therapy was equally efficacious when co-administered with an aromatase-inhibitor, which inhibits the conversion into E2.40 We found a negative association between total E2 and change in aLM, which persisted after adjustment, meaning that a higher baseline level of E2 was associated with a greater decrease in aLM. No other significant associations were observed between total, free, or bioavailable E2 and change in gait speed or grip strength. The longitudinal association between E2 and change in muscle parameters has been scantily investigated, with only two prospective studies including a follow-up period from 2 to 4.5 years.17,21 In these studies, neither total nor bioavailable E2 was associated with change in muscle mass, muscle strength, or physical performance, which is in contrast with our observation of a negative association between E2 and change in aLM. Most cross-sectional studies found no or a positive association between E2 and muscle mass and/or muscle strength,41 although we are aware of two cross-sectional studies that showed a negative association between E2 and muscle strength.42,43 A negative effect of E2 on muscle is hard to explain. Factors which have not been adjusted for may account for this association. SHBG was not associated with change in muscle mass, strength, or physical performance, which is in agreement with other prospective studies.19 In MrOS, however, higher SHBG was associated with less loss of muscle mass and strength, although not independently of sex hormones.17 Ageing is also associated with a progressive decline of IGF-1 and a decreased response of cells to IGF-1. We found that in persons ≥70 years, low baseline IGF-1 was positively associated with a higher decrease in gait speed, which is in agreement with cross-sectional studies.44 Since IGF-1 might influence SHBG, this result was adjusted for SBHG, but it remained significant, suggesting an independent effect of IGF-1.
We did not find a significant association between 25OHD and change in aLM, gait speed, or grip strength. Some studies have however shown an association between low 25OHD and loss of muscle strength22,24 or a decline in physical performance.23 In other studies no association with muscle mass,22,24 muscle strength,25 or physical performance was observed.25,26 A reason why we may not have been able to show these associations is the relatively high mean level of 25OHD in our cohort (30.1 ng/mL). There currently is no consensus about which level of 25OHD defines the threshold for optimal (extra) skeletal health, but since mean 25OHD in our cohort exceeds the levels suggested by the Institute of Medicine (20 mg/dL) and the Endocrine Society Task Force (30 ng/mL),45 this might explain the lack of association between 25OHD and muscle function. However, even in men with 25OHD in the lowest quintile (<18.7 ng/mL) or <10 ng/mL, no significant association with muscle parameters was observed. As it is possible that 25OHD not accurately reflects the action of 1,25(OH)2D, we also examined the association with 1,25(OH)2D and found no association with change in aLM, gait speed, or grip strength after adjustment for age, centre, BMI, smoking, and number of comorbidities. This is in accordance with some,46 but not all cross-sectional studies,47,48 where positive associations were reported between 1,25(OH)2D and muscle mass, strength, or physcial performance. Finally, the effect of PTH was investigated as it has been suggested that hyperparathyroidism, secondary to low vitamin D, mediates the effect of 25OHD and may also have a direct negative effect on muscle.22 However, PTH, even the highest quintile, was not associated with changes in aLM, gait speed, or grip strength. Others found that high PTH was associated with a greater decline in muscle mass or grip strength18,22 or with a non-significantly faster decline in grip strength and walking speed.49
Over a mean follow-up of 4.3 years, 8.1% developed sarcopenia by the definition of Baumgartner. With the more stringent definitions of IWGS and EWGSOP, this number decreased to 3.0% and 1.6%, respectively. Most people did not transition from their original state of aLM, gait speed, and grip strength, and only few people developed sarcopenia, suggesting that 4.3 years may not have been long enough for aLM, gait speed, and/or grip strength to decrease below their respective sarcopenia threshold. However, in a prospective cohort of almost 3000 initially well-functioning elderly aged between 70 and 79 years, only 7% transitioned from pre-sarcopenia to sarcopenia, while no one transitioned from normal to sarcopenia, and this over a 9-year follow-up.50 Hormones were poor predictors of incident sarcopenia, even in men aged 60–79 years. While none of these predicted the risk of RASM ≤ 7.26 kg/m2 only, the risk of IWGS sarcopenia, defined as low RASM and low gait speed, was predicted by high baseline SHBG or 25OHD, but not after adjustment. After adjustment for age, centre, BMI, smoking, and number of comorbidities, the risk of EWGSOP sarcopenia, defined as low RASM plus low gait speed and/or low grip strength, was not predicted by baseline levels of T, E2, SHBG, IGF-1, 25OHD, 1,25(OH)2D, or PTH, though the number of men with sarcopenia was small (n = 7).
Our study used standard methods with repeat measurements over 4.3 years. However, some limitations need to be taken into account. Firstly, the follow-up rate was 84.5%. It is possible that those who did not attend for the follow-up survey may have been more (or less) likely to have developed sarcopenia than those who attended, and so some caution is required in interpreting the incidence data. However, any factors influencing non-participation are unlikely to have influenced the associations between baseline hormones and outcome, as these were based on an internal comparison of participants. Secondly, our analysis was based on a baseline assessment of hormones and cannot exclude any effect of change in hormone levels on change in muscle mass, gait speed, or grip strength, for which repeat measurements are required. Finally, due to the young age of our cohort and short time of follow-up, the incidence of sarcopenia was low. This would limit the power to detect true biological associations between hormones and incident sarcopenia.
In conclusion, in middle-aged and elderly European men, aLM significantly decreased from age 50 years, while gait speed and grip strength significantly decreased after the seventh decade. No consistent associations were observed between baseline endocrine variables, especially T and 25OHD, and change in muscle mass, gait speed, or grip strength. In men aged ≥70 years, low baseline IGF-1 was associated with a greater decrease in gait speed. Randomized trials remain necessary to prove definitively whether T, vitamin D, or IGF-1 replacement is useful to promote maintenance of muscle mass and function and prevention of sarcopenia in ageing men.
Acknowledgments
This work is dedicated to the memory of Prof. Dr Steven Boonen.
The authors certify that they comply with the ethical guidelines for authorship and publishing of the Journal of Cachexia, Sarcopenia and Muscle (von Haehling S, Morley JE, Coats AJS, Anker SD. Ethical guidelines for authorship and publishing in the Journal of Cachexia, Sarcopenia, and Muscle. J Cachexia Sarcopenia Muscle. 2010;1:7–8).
Funding
EMAS was funded by the Commission of the European Communities Fifth Framework Programme “Quality of Life and Management of Living Resources” grant QLK6-CT-2001-00258. This work was also supported by grant G.0488.08 from FWO-Vlaanderen to S. Boonen, research grants OT-05-53, OT-09-035, and OT-11-081 from KU Leuven to D. Vanderschueren and research funding from Arthritis Research UK and Endocrine and Metabolic Bone Disease Research Endowment Account held in Central Manchester University Hospitals NHS Foundation Trust. D. Vanderschueren is a senior clinical investigator of the Leuven University Hospital Clinical Research Fund. M. Laurent is a fellow of the Research Foundation Flanders. K. Ward is funded by the UK Medical Research Council, programme number U105960371.
Conflict of interest
None declared.
References
- 1.Cruz-Jentoft AJ, Baeyens JP, Bauer JM, Boirie Y, Cederholm T, Landi F, et al. Sarcopenia: European consensus on definition and diagnosis: Report of the European Working Group on Sarcopenia in Older People. Age Ageing. 2010;39:412–423. doi: 10.1093/ageing/afq034. [DOI] [PMC free article] [PubMed] [Google Scholar]
- 2.Rosenberg IH. Summary comments. Am J Clin Nutr. 1989;50:3. [Google Scholar]
- 3.Manini TM, Clark BC. Dynapenia and aging: an update. J Gerontol A Biol Sci Med Sci. 2012;67:28–40. doi: 10.1093/gerona/glr010. [DOI] [PMC free article] [PubMed] [Google Scholar]
- 4.Baumgartner RN, Koehler KM, Gallagher D, Romero L, Heymsfield SB, Ross RR, et al. Epidemiology of sarcopenia among the elderly in New Mexico. Am J Epidemiol. 1998;147:755–763. doi: 10.1093/oxfordjournals.aje.a009520. [DOI] [PubMed] [Google Scholar]
- 5.Fielding RA, Vellas B, Evans WJ, Bhasin S, Morley JE, Newman AB, et al. Sarcopenia: an undiagnosed condition in older adults. Current consensus definition: prevalence, etiology, and consequences. International working group on sarcopenia. J Am Med Dir Assoc. 2011;12:249–256. doi: 10.1016/j.jamda.2011.01.003. [DOI] [PMC free article] [PubMed] [Google Scholar]
- 6.Morley JE, Abbatecola AM, Argiles JM, Baracos V, Bauer J, Bhasin S, et al. Sarcopenia with limited mobility: an international consensus. J Am Med Dir Assoc. 2011;12:403–409. doi: 10.1016/j.jamda.2011.04.014. [DOI] [PMC free article] [PubMed] [Google Scholar]
- 7.Muscaritoli M, Anker SD, Argiles J, Aversa Z, Bauer JM, Biolo G, et al. Consensus definition of sarcopenia, cachexia and pre-cachexia: joint document elaborated by Special Interest Groups (SIG) “cachexia-anorexia in chronic wasting diseases” and “nutrition in geriatrics”. Clin Nutr. 2010;29:154–159. doi: 10.1016/j.clnu.2009.12.004. [DOI] [PubMed] [Google Scholar]
- 8.Studenski SA, Peters KW, Alley DE, Cawthon PM, McLean RR, Harris TB, et al. The FNIH sarcopenia project: rationale, study description, conference recommendations, and final estimates. J Gerontol A Biol Sci Med Sci. 2014;69:547–558. doi: 10.1093/gerona/glu010. [DOI] [PMC free article] [PubMed] [Google Scholar]
- 9.Trevino-Aguirre E, Lopez-Teros T, Gutierrez-Robledo L, Vandewoude M, Perez-Zepeda M. Availability and use of dual energy X-ray absorptiometry (DXA) and bio-impedance analysis (BIA) for the evaluation of sarcopenia by Belgian and Latin American geriatricians. J Cachexia Sarcopenia Muscle. 2014;5:79–81. doi: 10.1007/s13539-013-0126-6. [DOI] [PMC free article] [PubMed] [Google Scholar]
- 10.Zamboni M, Zoico E, Scartezzini T, Mazzali G, Tosoni P, Zivelonghi A, et al. Body composition changes in stable-weight elderly subjects: the effect of sex. Aging Clin Exp Res. 2003;15:321–327. doi: 10.1007/BF03324517. [DOI] [PubMed] [Google Scholar]
- 11.Goodpaster BH, Park SW, Harris TB, Kritchevsky SB, Nevitt M, Schwartz AV, et al. The loss of skeletal muscle strength, mass, and quality in older adults: the health, aging and body composition study. J Gerontol A Biol Sci Med Sci. 2006;61:1059–1064. doi: 10.1093/gerona/61.10.1059. [DOI] [PubMed] [Google Scholar]
- 12.Kitamura I, Koda M, Otsuka R, Ando F, Shimokata H. Six-year longitudinal changes in body composition of middle-aged and elderly Japanese: age and sex differences in appendicular skeletal muscle mass. Geriatr Gerontol Int. 2014;14:354–361. doi: 10.1111/ggi.12109. [DOI] [PubMed] [Google Scholar]
- 13.Doherty TJ. Invited review: aging and sarcopenia. J Appl Physiol. 2003;95:1717–1727. doi: 10.1152/japplphysiol.00347.2003. [DOI] [PubMed] [Google Scholar]
- 14.Kallman DA, Plato CC, Tobin JD. The role of muscle loss in the age-related decline of grip strength: cross-sectional and longitudinal perspectives. J Gerontol. 1990;45:M82–M88. doi: 10.1093/geronj/45.3.m82. [DOI] [PubMed] [Google Scholar]
- 15.Ceglia L, Harris SS. Vitamin D and its role in skeletal muscle. Calcif Tissue Int. 2013;92:151–162. doi: 10.1007/s00223-012-9645-y. [DOI] [PubMed] [Google Scholar]
- 16.Pilz S, Kienreich K, Rutters F, de Jongh R, van Ballegooijen AJ, Grubler M, et al. Role of vitamin D in the development of insulin resistance and type 2 diabetes. Curr Diab Rep. 2013;13:261–270. doi: 10.1007/s11892-012-0358-4. [DOI] [PubMed] [Google Scholar]
- 17.LeBlanc ES, Wang PY, Lee CG, Barrett-Connor E, Cauley JA, Hoffman AR, et al. Higher testosterone levels are associated with less loss of lean body mass in older men. J Clin Endocrinol Metab. 2011;96:3855–3863. doi: 10.1210/jc.2011-0312. [DOI] [PMC free article] [PubMed] [Google Scholar]
- 18.Renoud A, Ecochard R, Marchand F, Chapurlat R, Szulc P. Predictive parameters of accelerated muscle loss in men-MINOS study. Am J Med. 2014;127:554–561. doi: 10.1016/j.amjmed.2014.02.004. [DOI] [PubMed] [Google Scholar]
- 19.Krasnoff JB, Basaria S, Pencina MJ, Jasuja GK, Vasan RS, Ulloor J, et al. Free testosterone levels are associated with mobility limitation and physical performance in community-dwelling men: the Framingham Offspring Study. J Clin Endocrinol Metab. 2010;95:2790–2799. doi: 10.1210/jc.2009-2680. [DOI] [PMC free article] [PubMed] [Google Scholar]
- 20.Schaap LA, Pluijm SM, Deeg DJ, Penninx BW, Nicklas BJ, Lips P, et al. Low testosterone levels and decline in physical performance and muscle strength in older men: findings from two prospective cohort studies. Clin Endocrinol (Oxf) 2008;68:42–50. doi: 10.1111/j.1365-2265.2007.02997.x. [DOI] [PubMed] [Google Scholar]
- 21.Hsu B, Cumming RG, Naganathan V, Blyth FM, Le Couteur DG, Seibel MJ, et al. Longitudinal relationships of circulating reproductive hormone with functional disability, muscle mass and strength in community-dwelling older men: the Concord Health and Ageing in Men project. J Clin Endocrinol Metab. 2014;99:3310–8. doi: 10.1210/jc.2014-1124. [DOI] [PubMed] [Google Scholar]
- 22.Visser M, Deeg DJ, Lips P. Longitudinal Aging Study A. Low vitamin D and high parathyroid hormone levels as determinants of loss of muscle strength and muscle mass (sarcopenia): the Longitudinal Aging Study Amsterdam. J Clin Endocrinol Metab. 2003;88:5766–5772. doi: 10.1210/jc.2003-030604. [DOI] [PubMed] [Google Scholar]
- 23.Wicherts IS, van Schoor NM, Boeke AJ, Visser M, Deeg DJ, Smit J, et al. Vitamin D status predicts physical performance and its decline in older persons. J Clin Endocrinol Metab. 2007;92:2058–2065. doi: 10.1210/jc.2006-1525. [DOI] [PubMed] [Google Scholar]
- 24.Scott D, Blizzard L, Fell J, Ding C, Winzenberg T, Jones G. A prospective study of the associations between 25-hydroxy-vitamin D, sarcopenia progression and physical activity in older adults. Clin Endocrinol (Oxf) 2010;73:581–587. doi: 10.1111/j.1365-2265.2010.03858.x. [DOI] [PubMed] [Google Scholar]
- 25.Houston DK, Tooze JA, Neiberg RH, Hausman DB, Johnson MA, Cauley JA, et al. 25-hydroxyvitamin D status and change in physical performance and strength in older adults: the health, aging, and body composition study. Am J Epidemiol. 2012;176:1025–1034. doi: 10.1093/aje/kws147. [DOI] [PMC free article] [PubMed] [Google Scholar]
- 26.Bartali B, Frongillo EA, Guralnik JM, Stipanuk MH, Allore HG, Cherubini A, et al. Serum micronutrient concentrations and decline in physical function among older persons. JAMA. 2008;299:308–315. doi: 10.1001/jama.299.3.308. [DOI] [PMC free article] [PubMed] [Google Scholar]
- 27.Kim MK, Baek KH, Song KH, Il Kang M, Park CY, Lee WY, et al. Vitamin D deficiency is associated with sarcopenia in older Koreans, regardless of obesity: the Fourth Korea National Health and Nutrition Examination Surveys (KNHANES IV) 2009. J Clin Endocrinol Metab. 2011;96:3250–3256. doi: 10.1210/jc.2011-1602. [DOI] [PubMed] [Google Scholar]
- 28.Park S, Ham JO, Lee BK. A positive association of vitamin D deficiency and sarcopenia in 50 year old women, but not men. Clin Nutr. 2014;33:900–905. doi: 10.1016/j.clnu.2013.09.016. [DOI] [PubMed] [Google Scholar]
- 29.Lee DM, Pye SR, Tajar A, O'Neill TW, Finn JD, Boonen S, et al. Cohort profile: the European Male Ageing Study. Int J Epidemiol. 2013;42:391–401. doi: 10.1093/ije/dyr234. [DOI] [PubMed] [Google Scholar]
- 30.Reuben DB, Siu AL. An objective measure of physical function of elderly outpatients. The physical performance test. J Am Geriatr Soc. 1990;38:1105–1112. doi: 10.1111/j.1532-5415.1990.tb01373.x. [DOI] [PubMed] [Google Scholar]
- 31.Vermeulen A, Verdonck L, Kaufman JM. A critical evaluation of simple methods for the estimation of free testosterone in serum. J Clin Endocrinol Metab. 1999;84:3666–3672. doi: 10.1210/jcem.84.10.6079. [DOI] [PubMed] [Google Scholar]
- 32.Vanderschueren D, Pye SR, O'Neill TW, Lee DM, Jans I, Billen J, et al. Active vitamin D (1,25-dihydroxyvitamin D) and bone health in middle-aged and elderly men: the European Male Aging Study (EMAS) J Clin Endocrinol Metab. 2013;98:995–1005. doi: 10.1210/jc.2012-2772. [DOI] [PubMed] [Google Scholar]
- 33.Wang W, Wang Z, Faith MS, Kotler D, Shih R, Heymsfield SB. Regional skeletal muscle measurement: evaluation of new dual-energy X-ray absorptiometry model. J Appl Physiol. 1999;87:1163–1171. doi: 10.1152/jappl.1999.87.3.1163. [DOI] [PubMed] [Google Scholar]
- 34.Verschueren S, Gielen E, O'Neill TW, Pye SR, Adams JE, Ward KA, et al. Sarcopenia and its relationship with bone mineral density in middle-aged and elderly European men. Osteoporos Int. 2013;24:87–98. doi: 10.1007/s00198-012-2057-z. [DOI] [PubMed] [Google Scholar]
- 35.Taekema DG, Gussekloo J, Maier AB, Westendorp RG, de Craen AJ. Handgrip strength as a predictor of functional, psychological and social health. A prospective population-based study among the oldest old. Age Ageing. 2010;39:331–337. doi: 10.1093/ageing/afq022. [DOI] [PubMed] [Google Scholar]
- 36.Hicks GE, Shardell M, Alley DE, Miller RR, Bandinelli S, Guralnik J, et al. Absolute strength and loss of strength as predictors of mobility decline in older adults: the InCHIANTI study. J Gerontol A Biol Sci Med Sci. 2012;67:66–73. doi: 10.1093/gerona/glr055. [DOI] [PMC free article] [PubMed] [Google Scholar]
- 37.Patil R, Uusi-Rasi K, Pasanen M, Kannus P, Karinkanta S, Sievanen H. Sarcopenia and osteopenia among 70–80-year-old home-dwelling Finnish women: prevalence and association with functional performance. Osteoporos Int. 2013;24:787–796. doi: 10.1007/s00198-012-2046-2. [DOI] [PubMed] [Google Scholar]
- 38.Wu FC, Tajar A, Beynon JM, Pye SR, Silman AJ, Finn JD, et al. Identification of late-onset hypogonadism in middle-aged and elderly men. N Engl J Med. 2010;363:123–135. doi: 10.1056/NEJMoa0911101. [DOI] [PubMed] [Google Scholar]
- 39.Abellan van Kan G, Rolland Y, Andrieu S, Bauer J, Beauchet O, Bonnefoy M, et al. Gait speed at usual pace as a predictor of adverse outcomes in community-dwelling older people an International Academy on Nutrition and Aging (IANA) task force. J Nutr Health Aging. 2009;13:881–889. doi: 10.1007/s12603-009-0246-z. [DOI] [PubMed] [Google Scholar]
- 40.Finkelstein JS, Lee H, Burnett-Bowie SA, Pallais JC, Yu EW, Borges LF, et al. Gonadal steroids and body composition, strength, and sexual function in men. N Engl J Med. 2013;369:1011–1022. doi: 10.1056/NEJMoa1206168. [DOI] [PMC free article] [PubMed] [Google Scholar]
- 41.Gates MA, Mekary RA, Chiu GR, Ding EL, Wittert GA, Araujo AB. Sex steroid hormone levels and body composition in men. J Clin Endocrinol Metab. 2013;98:2442–2450. doi: 10.1210/jc.2012-2582. [DOI] [PMC free article] [PubMed] [Google Scholar]
- 42.Schaap LA, Pluijm SM, Smit JH, van Schoor NM, Visser M, Gooren LJ, et al. The association of sex hormone levels with poor mobility, low muscle strength and incidence of falls among older men and women. Clin Endocrinol (Oxf) 2005;63:152–160. doi: 10.1111/j.1365-2265.2005.02315.x. [DOI] [PubMed] [Google Scholar]
- 43.Auyeung TW, Lee JS, Kwok T, Leung J, Ohlsson C, Vandenput L, et al. Testosterone but not oestradiol level is positively related to muscle strength and physical performance independent of muscle mass: a cross-sectional study in 1489 older men. Eur J Endocrinol. 2011;164:811–817. doi: 10.1530/EJE-10-0952. [DOI] [PubMed] [Google Scholar]
- 44.Cappola AR, Bandeen-Roche K, Wand GS, Volpato S, Fried LP. Association of IGF-I levels with muscle strength and mobility in older women. J Clin Endocrinol Metab. 2001;86:4139–4146. doi: 10.1210/jcem.86.9.7868. [DOI] [PubMed] [Google Scholar]
- 45.Bouillon R, Van Schoor NM, Gielen E, Boonen S, Mathieu C, Vanderschueren D, et al. Optimal vitamin D status: a critical analysis on the basis of evidence-based medicine. J Clin Endocrinol Metab. 2013;98:E1283–E1304. doi: 10.1210/jc.2013-1195. [DOI] [PubMed] [Google Scholar]
- 46.Boonen S, Lysens R, Verbeke G, Joosten E, Dejaeger E, Pelemans W, et al. Relationship between age-associated endocrine deficiencies and muscle function in elderly women: a cross-sectional study. Age Ageing. 1998;27:449–454. doi: 10.1093/ageing/27.4.449. [DOI] [PubMed] [Google Scholar]
- 47.Marantes I, Achenbach SJ, Atkinson EJ, Khosla S, Melton LJ, 3rd, Amin S. Is vitamin D a determinant of muscle mass and strength? J Bone Miner Res. 2011;26:2860–2871. doi: 10.1002/jbmr.510. [DOI] [PMC free article] [PubMed] [Google Scholar]
- 48.Dukas L, Staehelin HB, Schacht E, Bischoff HA. Better functional mobility in community-dwelling elderly is related to D-hormone serum levels and to daily calcium intake. J Nutr Health Aging. 2005;9:347–351. [PubMed] [Google Scholar]
- 49.Verreault R, Semba RD, Volpato S, Ferrucci L, Fried LP, Guralnik JM. Low serum vitamin D does not predict new disability or loss of muscle strength in older women. J Am Geriatr Soc. 2002;50:912–917. doi: 10.1046/j.1532-5415.2002.50219.x. [DOI] [PubMed] [Google Scholar]
- 50.Murphy RA, Ip EH, Zhang Q, Boudreau RM, Cawthon PM, Newman AB, et al. Transition to sarcopenia and determinants of transitions in older adults: a population-based study. J Gerontol A Biol Sci Med Sci. 2014;69:751–758. doi: 10.1093/gerona/glt131. [DOI] [PMC free article] [PubMed] [Google Scholar]