

Abstract
Profound inhibitory control exerted on midbrain dopaminergic neurons by the lateral habenula (LHb), which has mainly excitatory outputs, is mediated by the GABAergic rostromedial tegmental nucleus (RMTg), which strongly innervates dopaminergic neurons in the ventral midbrain. Early reports indicated that the afferent connections of the RMTg, excepting its very strong LHb inputs, do not differ appreciably from those of the ventral tegmental area (VTA). Presumably, however, the RMTg contributes more to behavioral synthesis than to simply invert the valence of the excitatory signal coming from the LHb. So, the present study was done to directly compare the inputs to the RMTg and VTA and, in deference to its substantial involvement with this circuitry, the LHb was also included in the comparison. Data indicated that, while the afferents of the RMTg, VTA and LHb do originate within the same large pool of CNS structures, each also is related to structures that project more strongly to it than to the others. The VTA gets robust input from ventral striatopallidum and extended amygdala, whereas RMTg biased inputs arise in structures with more direct impact on motor function such as deep layers of the contralateral superior colliculus, deep cerebellar and several brainstem nuclei, and, via a relay in the LHb, the entopeduncular nucleus. Input from the ventral pallidal-lateral preoptic-lateral hypothalamus continuum is strong in the RMTg and VTA and dominant in the LHb. Axon collateralization was also investigated, providing additional insights into the organization of the circuitry of this important triad of structures.
Introduction
Ventral mesencephalic dopaminergic (DAergic) neurons in the ventral tegmental area (VTA) and substantia nigra compacta (SNc) are activated by several kinds of stimuli, including novel, rewarding and reward-predicting (White, 1996; Schultz et al., 1997; Rebec et al., 1997a, b; Schultz, 1998, Wise, 2004). Alternatively, such neurons are inhibited by the omission of expected rewards (Schultz et al., 1997; 1998; 2007, 2013; Bromberg-Martin et al., 2010; Cohen et al., 2012; Fiorillo et al., 2013) and mainly inhibited by aversive stimuli although they may be excited by them (Ungless, 2004; Matsumoto and Hikosaka, 2008; Ungless et al., 2010; Lammel et al., 2011; 2012; 2014), particularly in certain subgroups (Matsumoto and Hikosaka, 2009; Cohen et al., 2012). The resulting effects on release of dopamine in striatal and cortical target regions, in turn, affect a broad range of cognitive and behavioral functions, including locomotor and autonomic activation, reward prediction, effort based decision-making, learning, habit formation and movement initiation (Wise, 2004; Berridge, 2007; Salomone and Correa, 2012; Steinberg et al., 2013; Hart et al., 2014; Saddoris et al., 2014).
While long a subject of intense investigation, how stimuli are coupled to the activity of midbrain dopamine neurons remains incompletely understood. Midbrain DAergic neurons fire spontaneously, but their activity is thought to be mainly controlled by abundant afferent projections (Grace, 1988; White, 1996; Marinelli et al., 2006; Grace et al., 2007; Sesack and Grace, 2010; Marinelli and McCutcheon, 2014), which are organized as a complex network converging from widespread parts of the neuroaxis (Phillipson, 1979; Oades and Halliday, 1987; Bentivoglio and Morelli, 2005; Geisler and Zahm, 2005; 2006; Björklund and Dunnett, 2007; Geisler et al., 2007; Ikemoto, 2007; Zahm et al., 2011b; Yetnikoff et al., 2014a). Structures within this afferent network that earlier were reported to be particularly efficacious in regulating midbrain DAergic neuronal activity (e.g., Floresco et al., 2003; Lodge and Grace, 2006a; b) now must also include the lateral habenula (LHb), a tonically active epithalamic structure classically linked to reward, stress, maternal behavior, nociception, circadian rhythmicity and learning (reviewed in Sutherland, 1982; Lecourtier and Kelly, 2007; Geisler and Trimble, 2008). The LHb is increasingly recognized as a potent modulator of midbrain DAergic neuronal activity (Ji and Shepard, 2007; Matsumoto and Hikosaka, 2007; 2009; Shelton et al., 2012; Stamatakis and Stuber, 2012; Stopper and Floresco, 2013; Velasques et al., 2014; Hennigan et al., 2014). LHb projects broadly to mesopontine structures, including the VTA, that give rise to extensive ascending modulatory projections (Herkenham and Nauta, 1979; Araki et al., 1988; Jhou et al., 2009b; Olmelchenko et al., 2009; Lavezzi et al., 2012; Bernard and Veh, 2012). Interestingly, the LHb responds to stimuli in a manner opposite to DAergic neurons. That is, the activity of LHb neurons is inhibited by unexpected rewards and reward-predictive cues, and increased by reward omission and aversive stimuli (Ji and Shepard 2007; Matsumoto and Hikosaka, 2007, 2009; Hong et al., 2011). This suggests, insofar as LHb outputs to the VTA are mainly excitatory (Geisler et al., 2007; Brinschwitz et al., 2010), that the LHb likely regulates VTA activity via an intermediary structure (Ji and Shepard, 2007).
After a seminal paper by Jhou (2005), evidence has continued to accumulate favoring the rostromedial tegmental nucleus (RMTg) as said LHb-VTA intermediary. The predominantly GABAergic RMTg is located just behind the VTA, receives strong glutamatergic input from the LHb and has robust inhibitory projections that contact preferentially DAergic neurons in the VTA, SNc and retrorubral field (Jhou et al., 2009a, b; Kaufling et al., 2009; Kim, 2009; Balcita-Pedicini et al., 2011; Barrot and Thome, 2011; Lavezzi and Zahm, 2011 Matsui and Williams, 2011; Bourdy and Barrot, 2012; Gonçalves et al., 2012; Lecca et al., 2010; 2011; Bourdy et al., 2014; Barrot, 2014). RMTg neurons express the immediate early gene c-fos and its long-lived splice variant, deltaFosB after stimulant drug administration (Scammell et al., 2000; Perrotti et al., 2005; Geisler et al., 2008), and the RMTg is enriched in prepronociceptin mRNA (Morales et al., 2011), somatostatin and the μ-opioid receptor (Jhou et al., 2009b; 2012). Like LHb neurons, RMTg neurons are spontaneously active and their average rates of firing are increased by reward omission and aversive stimuli, decreased by reward and reward-predictive cues, and also influenced, mainly negatively, by fear-eliciting stimuli (Jhou et al., 2009a; Hong et al., 2011; Bourdy and Barrot, 2012; Stamatakis and Stuber, 2012). Electrophysiological stimulation of the LHb activates RMTg neurons (Hong et al., 2011), while lesions of the fasciculus retroflexus, the main habenular output pathway, prevent activation of RMTg neurons by negative stimuli (Brown and Shepard, 2013). In turn, activation of the RMTg results in profound inhibition of midbrain dopamine neurons, an influence thought to underlie behavioral responses to reward omission, aversive stimuli, fear and drugs of abuse (Jhou 2009a, 2013; Hong et al., 2011; Lecca et al., 2010, 2011; Matsui and Williams, 2011; Matsui et al., 2014; Bourdy et al., 2014). Activation of the RMTg also negatively modulates locomotor activation (Lavezzi et al., 2014) and the acquisition and execution of motor skills (Bourdy et al., 2014).
In consequence of these neuroanatomical and neurophysiological relationships, there is some jeopardy that the RMTg might come to be appreciated as a mere relay serving to invert the valence of LHb signaling enroute to midbrain DAergic neurons. Such a scenario would seem unlikely, however, insofar as the RMTg occupies a part of the mesencephalic reticular formation with a very rich complement of afferent and efferent connections (Lavezzi and Zahm, 2011). Indeed, initial reports on the non-habenular afferents of the RMTg (Jhou et al., 2009b; Kaufling et al., 2009) concurred that they are very numerous and so much resemble the very extensive inputs to the VTA (Geisler and Zahm, 2005) as to be virtually indistinguishable from them. But it also seems unlikely that RMTg and VTA afferents should be identical. Accordingly, the present study was done to directly compare their numbers and distributions. In addition, to further establish the RMTg as a unique, albeit interdependent, modulator of DAergic function, the numbers and distributions of RMTg and VTA afferents were also compared directly to those of the LHb. The study was concluded with additional experiments addressing the possibility that subsets of basal forebrain neurons might project by axon collaterals to both the RMTg and LHb or VTA.
Materials and Methods
Animals
All experiments were carried out in accordance with guidelines published in the National Institutes of Health Guide for the care and use of laboratory animals and were approved by the animal care committee of Saint Louis University. Male Sprague Dawley rats (200-290g; Harlan, Indianapolis, IN) were housed under a 12-hour light-dark cycle in groups of 4 – 6 until the time of tracer injections, after which they were housed individually. Food and water were provided ad libitum.
Tracer injections
Rats were given intraperitoneal injections of a mixture of 45% ketamine (100 mg/ml), 35% xylazine (20 mg/ml) and 20% saline at a dose of 0.16 ml/100 g body weight, and several minutes later were placed into a Kopf stereotaxic instrument. Small bore holes were drilled in the skull above targeted structures and 1% Fluorogold (FG, Fluorochrome, Inc, Englewood, CO) in 0.067 cacodylate buffer or 10% β subunit of cholera toxin (Ctβ; List Biological Laboratories Inc., Campbell, CA) in 0.1M Sorenson's phosphate buffer (SPB; pH 7.4) were injected iontophoretically into the brains from 1.0 mm filament-containing borosilicate glass pipettes pulled to outside diameters of 15-18 μm (for FG) or 20-25 μm (for Ctβ). The injections were made over a period of 15 min using positive pulses (7s on/7s off) of 1 μA (for FG) or 3 μA (for Ctβ). Animals were given subcutaneous (s.c.) injections of carprofen (20 mg/kg) immediately after surgery and once daily for the next 3 days. Stereotaxic coordinates were established with the aid of the atlas of Paxinos and Watson (1997).
Initially, groups of rats intended to reveal numbers of neurons projecting to the VTA and RMTg received injections of FG into the VTA and Ctβ into the ipsilateral RMTg or FG into the RMTg and Ctβ into the ipsilateral VTA in order to allow both intra- and between-subject analyses of the patterns of labeled projections from the two injection sites. The intra-subject approach had to be abandoned, however, when it was recognized that significantly fewer neurons are retrogradely labeled by FG than Ctβ, the difference being greatest at sites distant from the injections. Consequently, additional sections were processed to exhibit only Ctβ labeling and between-subject analyses were done comparing a group of rats that received VTA injections with a group that received RMTg injections and, in addition, with a third group that received injections of Ctβ into the LHb.
A second part of this investigation was done to identify basal forebrain neurons that project to the RMTg and VTA or LHb. This part of the study did utilize cases in which the RMTg received injections of FG or Ctβ and the ipsilateral VTA or LHb was injected with the other tracer (i.e., the one not put in the RMTg). This was permissible despite the less efficacious transport of FG because here the numbers of neurons labeled by the two tracers were not directly compared.
Fixation of brains and immunocytochemistry
Three days after the tracer injections, the rats were deeply anesthetized with the ketamine-xylazine cocktail described above and perfused transaortically with 0.01M SPB (pH 7.4) containing 0.9% sodium chloride and 2.5% sucrose followed by 0.1M SPB (pH 7.4) containing 4% paraformaldehyde and 2.5% sucrose. Some rats with tracer deposits in the RMTg received an intraperitoneal injection of D-amphetamine (10 mg/kg) two hours prior to perfusion to enable subsequent verification of the RMTg tracer injection site by immunohistochemical demonstration of psychostimulant-induced Fos expression. Brains were removed from the skull, postfixed in the same fixative for 4 hours, cryoprotected in 30% sucrose overnight and sectioned at 50 μm on a freezing microtome. Five adjacent series of frontal sections were collected such that the entire brain was sampled at 250 μm intervals. Series of sections were stored prior to processing at -20°C in a cryoprotectant comprising 30% sucrose and 33% ethylene glycol in SPB.
Single labeling protocol - anti-Ctβ
A series of sections was thoroughly rinsed in 0.1M SPB and immersed in 1% aqueous sodium borohydride for 15 min followed by thorough rinsing in 0.1M SPB. The sections were then incubated overnight in 0.1M SPB containing 0.1% Triton X-100 (SPB-t) and anti-Ctβ antibody (see Primary Antibodies section below) was used at a dilution of 1:5000. The following day, sections were rinsed thoroughly in SPB-t and placed for one hour in SPB-t containing biotinylated secondary antibody (Jackson Laboratories, West Grove, PA) raised in donkey against goat at a dilution of 1: 200. After thorough rinsing, sections were placed for one hour in SPB-t containing avidin-biotin-peroxidase complex (ABC, Vector Laboratories, Burlingame, CA) used at 1:200, rinsed again in SPB and incubated for 5–10 min in a solution of 0.025M Tris buffer (pH 8.0) containing 0.015% 3,3′-diaminobenzidine (DAB), 0.4% nickel ammonium sulfate, and 0.0003% hydrogen peroxide (NiDAB), which generates an insoluble black reaction product. After further rinsing, the sections were mounted in rostrocaudal sequence on gelled slides and coverslipped under Permount (Fisher, St Louis, MO).
Additional single labeling protocols; outlines of RMTg, VTA/SNc and LPO
In order to define the boundaries of the RMTg in rats where it was targeted for Ctβ injections, separate series of sections were processed with anti-μ-opioid receptor 1A (Mor) antibody (see Primary Antibodies section below) or, if the rat had been injected with amphetamine before being perfused, anti-Fos (see Primary Antibodies section below), both made in rabbit and used at a dilution of 1:5000. The sections were processed further as described above except that a secondary antbody made in donkey against rabbit IgGs (Jackson) was used (at a dilution of 1:200).
To reveal boundaries of the VTA/SNc, a series of sections was immersed in 0.1 M SPB-t containing anti-TH antibody (see Primary Antibodies section below) made in mouse at a dilution of 1:5000. The following day, the sections were rinsed in 0.1 M SPB-t and immersed for one hour in 0.1 M SPB-t containing biotinylated antibody made in donkey against mouse IgGs at a dilution of 1:200. Afterward, the sections were rinsed in 0.1 M SPB-t and then immersed for one hour in 0.1 M SPB-t containing ABC at a dilution of 1:200. After rinsing in 0.1 M SPB-t, the sections were reacted in 0.1 M SPB containing 0.05% DAB and 0.003% hydrogen peroxide, which generates an insoluble brown reaction product, and mounted onto subbed glass slides. The DAB reaction product was intensified by placing the slides sequentially through 0.005 % aqueous OsO4 and aqueous thiocarbohydrazide (0.1 mg/100 ml H2O) followed by a second immersion in the osmium solution, with brief rinses between. The sections were then coverslipped with Permount.
Distinguishing the LPO and surrounding forebrain regions, including the medial preoptic area (MPO), ventral pallidum (VP), sublenticular extended amygdala (SLEA), bed nucleus of the stria terminalis (BST), and nucleus of the horizontal limb of the diagonal band (HDB) was approached with the aid of sections processed to show various immunohistochemical markers, including nitric oxide synthase (Nos), calbindin (CB) and parvalbumin (PV). Series of brain sections were first rinsed in 0.1 M SPB-t and then immersed overnight in 0.1 M SPB-t containing antibodies against PV or Nos at a concentration of 1:5000. The following day, the sections were rinsed in 0.1 M SPB-t and immersed for one hour in 0.1 M SPB-t containing biotinylated antibody made in horse against mouse IgGs at a dilution of 1:200 (Jackson). Afterward, the sections were rinsed in 0.1 M SPB-t and then immersed for one hour in 0.1 M SPB-t containing ABC reagents at a dilution of 1:200. For preparations used to show only PV or Nos immunoreactivity, the sections were rinsed in 0.1 M SPB-t, and reacted in DAB and mounted onto subbed glass slides. The DAB reaction product was then intensified as described above and the sections were coverslipped with Permount. Sections reacted with PV antibodies and intended to undergo further processing to reveal immunoreactivity against CB were instead reacted with NiDAB. The sections were then rinsed in SPB-t and immersed overnight in SPB-t containing polyclonal anti-CB made in goat and used at a dilution of 1:5000. The following day, after having been rinsed again in 0.1 M SPB-t, the sections were immersed for one hour in 0.1 M SPB-t, containing biotinylated antibody made in donkey against goat IgGs at a dilution of 1:200 (Jackson). Afterward, the sections were rinsed in 0.1 M SPB-t and then immersed for one hour in 0.1 M SPB-t containing ABC reagents at a dilution of 1:200. After rinsing in 0.1 M SPB, the sections were reacted in DAB, rinsed in 0.1 M SPB, mounted onto subbed glass slides and coverslipped with Permount.
Double labeling immunofluorescence protocol
One series of sections from cases injected at two separate sites with different tracers was first rinsed in 0.1 M SPB-t and then immersed overnight in 0.1 M SPB-t containing anti-Ctβ at a concentration of 1:4000. The following day, the sections were rinsed in 0.1 M SPB-t and immersed for one hour in 0.1 M SPB-t containing DyLight 488 conjugated to anti-sheep IgG made in donkey (Jackson, catalog No. 713-485-14), which recognizes the anti-Ctβ IgG made in goat, used at a concentration of 1:200. The sections were rinsed in 0.1 M SPB-t and immersed overnight in 0.1 M SPB-t containing rabbit anti-FG at a concentration of 1:5000. The following day, the sections were rinsed in 0.1 M SPB-t and immersed for one hour in 0.1 M SPB-t containing DyLight 594-anti-rabbit conjugate (Jackson) at a concentration of 1:200. The sections were rinsed in 0.1 M SPB-t and mounted onto gelatin-coated slides and coverslipped with ProLong Gold antifade reagent (Invitrogen).
Primary Antibodies
Table 1 gives the antigens, descriptions of immunogens, source information and working concentrations, which were determined directly from working solutions with the aid of NanoDrop 2000 instrumentation and software in IgG mode (Thermo Scientific, USA), of the antibodies used in the study. Additional information about the antibodies is provided below.
Table 1. Table of primary antibodies used.
List of the primary antibodies used in the study with their respective specifications.
| Antigen | Description of immunogen | Source, host species, cat. #, clone or lot #, RRID | Working concentration used (µg/ml) |
|---|---|---|---|
| calbindin | purified bovine kidney CB 28 kD | Sigma Chemical Co., cat. # C9848, RRID: AB_476894 | 8.3 |
| cholera toxin β subunit | Ctβ itself | List Biological Laboratories, cat. #703, RRID: AB_10013220 | 15.3 |
| Fluorogold | FG itself | Millipore, cat. #AB153, RRID: AB_90738 | 30.5 |
| Fos | synthetic peptide corresponding to amino acids 4-17 (SGFNADYEASSSRC) of human c-Fos | Calbiochem, cat. # PC38, RRID: AB_2313765 | 11.5 |
| nitric oxide synthase | amino acids 251-270 of nitric oxide synthase (GDNDRVFNDLWGKDNVPVILC) conjugated to keyhole limpet cyanin | Sigma Chemical Company, cat. #N7155, RRID: AB_260795 | 21.5 |
| μ-opioid receptor | synthetic peptide corresonding to amino acids LENLEAETAPLP at the COOH terminus of the μ-opioid receptor | Gramsch Laboratories, cat. # OR-600, RRID: AB_2314811 | 16.0 |
| parvalbumin | purified carp muscle parvalbumin | Sigma Chemical Co., clone PA-235, cat. # P3088, RRID: AB 477329 | 26.3 |
| tyrosine hydroxylase | tyrosine hydroxylase from PC12 cells | Millipore, cat. # MAB318, RRID: AB_2315522 | 28.8 |
anti-CB
This is a monoclonal antibody (clone CB-955) raised against purified bovine kidney calbindin-D 28 kD and isolated from mouse ascites fluid. The vendor states that [1] the antibody does not react with other members of the EF-hand family such as calbindin-D 9K, calretinin, myosin light chain, parvalbumin, S-100a, S-100b, S100A2 (S100L) and S100A6 (calcyclin); [2] species cross-reactivity was observed with human, bovine, goat, sheep, porcine, rabbit, dog, cat, guinea-pig, rat and mouse; [3] a weaker reactivity was observed with chicken CB.
Anti- Ctβ
The goat polyclonal antibody was raised against Ctβ (choleragenoid) itself.. Ctβ immunostaining was observed only in brains that had received injections of the tracer and only at the injection sites and in retrogradely labeled neurons and anterogradely labeled axons. Immunoprocessed sections from brains lacking Ctβ injections were devoid of reaction product.
Anti-FG
The rabbit polyclonal antibody raised against FG (hydroxystilbamidine) was purchased as antibody-containing serum without preservative.. The vendor states that the antibody also reacts with aminostilbamidine in frozen, 4% PFA-fixed tissues. In the present experiments, FG immunostaining was observed only in brains that had received injections of the tracer and only at the injection sites and in retrogradely labeled neurons. Immunoprocessed sections from brains lacking FG injections were devoid of reaction product.
Anti-Fos
This polyclonal antibody made in rabbit. was raised against a synthetic peptide SGFNADYEASSSRC corresponding to amino acids 4–17 of human c-Fos and is reported by the vendor to recognize the ∼55-kDa c-Fos and ∼62-kDa v-Fos proteins and to not cross-react with the ∼39- kDa Jun protein.
Anti-Mor
This polyclonal antibody made in rabbit was raised against a synthetic peptide corresponding to amino acids LENLEAETAPLP at the COOH terminus of μ-opioid receptor subtype μ-MOR-1A. In the present experiments, the antibody stains rat brain sections in a manner consistent with literature descriptions of the distribution of brain Mor immunoreactivity (see, e.g., Schulz et al., 1998). Preabsorption with the cognate peptide abolished immunohistochemical staining.
anti-Nos
This is a polyclonal antibody raised in rabbit against amino acids 251-270 of nitric oxide synthase (GDNDRVFNDLWGKDNVPVILC) conjugated to keyole limpet cyanin. NOS immunoreactivity was abolished in our hands by preabsorption with the cognate peptide (10 μg/ml).
anti-PV
This is a monoclonal antibody raised against purified carp muscle parvalbumin and isolated from mouse ascites fluid. The vendor states that [1] the antibody is immunospecific for parvalbumin as determined by indirect immunoperoxidase staining and immunoblotting; [2] the antibody reacts specifically with parvalbumin of cultured nerve cells and tissue originating from human, monkey, rat, mouse, chicken and fish; [3] it specifically stains the 45Ca-binding spot of parvalbumin (M.W. 12,000, pl of 4.9) by immunobinding.
anti-TH
This is a mouse monoclonal antibody purified from PC12 cells. The antibody is supplied as ascites fluid with 3% BSA and no preservative. According to the vendor, the antibody recognizes an epitope on the outside of the regulatory N-terminus of TH. In Western blots, the antibody recognizes a protein of approximately 59-63 kDa. It does not react with the following on Western Blots: dopamine-beta-hydroxylase, phenylalanine hydroxylase, tryptophan hydroxylase, dehydropteridine reductase, sepiapterin reductase, or phenethanolamine-N-methyl transferase. In our hands, the anti-TH antibody stains rat brain sections in a manner fully consistent with literature descriptions (e.g., Lindvall and Björkland, 1983; Hökfelt et al., 1984).
Maps and photomicrographs
Retrogradely labeled neurons were plotted with the aid of an Olympus BX51 microscope using 10× and 20× objectives and a dedicated hardware-software platform (Neurolucida, MBF Bioscience, Williston, VT). Images for illustration were captured with a DVC 2000C-00-GE-MBF digital camera and adjusted for contrast and brightness with Adobe Photoshop CS2 software. Maps of plotted sections were prepared for illustration using Adobe Illustrator CS2 software (San Jose, CA). The analyses comprised evaluations of sequences of frontal sections, each carefully selected so as to provide sampling of each brain at precisely the same 30 rostrocaudal levels. That is, every rostrocaudal level, with the same complement of brain structures, was represented in all mapped cases. Data generated in this way were utilized exclusively to compare like sections and groups of like sections with each other.
Quantitation of retrogradely-labeled neurons
Brain structures were outlined on the sides of the brains ipsilateral to injection sites, except where indicated, by reference to the rat brain atlases of Paxinos and Watson (2007) and Paxinos et al. (1999), and our own in-house maps of basal forebrain immunoprocessed to show substance P, CB, PV, Nos, Mor and TH, which, together, served to delineate several striatopallidal, extended amygdala and ventral mesencephalic and mesopontine structures (Zahm et al., 2014). All outlined structures were present in at least two levels, except for the rostral pole of the accumbens (Acb) and lateral preoptic (LPO)-lateral hypothalamus (LH) transition, which were present in one. Plotting was done as described in the preceding section and retrogradely labeled neurons were counted with the aid of NeuroExplorer software (MBF Bioscience, version 4.70.3) in whole sections and individual brain structures. Averages per section and structure for each experimental group - VTA, RMTg and LHb - were computed.
To control for within-group variability in injection size, data were standardized for each injection site (VTA, RMTg and LHb) as mean total labeled (n = 3)/total labeled (each case) × data from each level or structure. Standardized and raw data turned out to be similar, however, and raw data were ultimately used and illustrated in the Results. Numbers of retrogradely labeled cells per level (whole sections) were expressed as means±SEM (n=3 for each of the 3 injection sites), which were compared with a two-way mixed ANOVA (injected structure × section level). Retrogradely labeled neurons in individual brain structures were also expressed as means±SEM and these were compared using one-way ANOVA followed by Tukey's posthoc test. In those instances where only two structures were being compared (e.g., if the third structure had no retrogradely labeled neurons), the Bonferroni Student's t test was used. For all statistical tests, the criterion for significance was set at p<0.05.
Mapping and quantitation of immunofluorescence double-labeling
Visualization of immunofluorescence preparations was accomplished with the aid of the epifluorescence capability of the Olympus BX51 microscope supplemented by a dual-band fluorescence filter set (Chroma Technology Corp, Brattleboro, VT) with excitation bands at 480-505 and 560-590 nm, and emission bands at 505-545 and 600-650 nm, for green (DyLight 488) and red (DyLight 594) fluorescence, respectively. This renders single labeled neurons red and green and double-labeled neurons yellow, all of which were captured in photomicrograph montages spanning the basal forebrain. For illustration, red in the digital images was replaced with magenta with the aid of Adobe Photoshop CS software. The fidelity with which double-labeling is detected by the dual filter was previously validated with the aid of laser scanning confocal microscopy (Reynolds et al., 2005). Mapping of the photographed neurons was done with the aid of Neurolucida software allowing photomicrographs to be ‘sewn’ into manually outlined sections such that photographed structures are precisely in register with their positions in the immunoprocessed sections. With this accomplished, Neurolucida software was utilized to generate plots showing the positions of single and double-labeled neurons in the sections. The plots were superimposed over maps of corresponding sections drawn from series processed with the aid of immunohistochemical markers appropriate to exhibit basal forebrain nuclear organization, as described in the section above entitled ‘Additional single labeling protocols - outlines of RMTg, VTA/SNc, LPO’. Numbers of single- and double-labeled neurons in various basal forebrain structures were counted in order to generate means±SEM for each structure (n=7 for LHb and RMTg and n=3 for VTA and RMTg). The data were tested with a one-way ANOVA followed by Dunnett's multiple comparisons test.
Results
Tracer injections and retrograde labeling
Representative examples of Ctβ tracer deposits into the RMTg, VTA and LHb are illustrated in Figure 1. Tracer deposits into the RMTg (Fig. 1A and B) were centered over mid to caudal levels of that structure as revealed by immunohistochemical preparations showing Mor immunoreactivity (Fig. 1B) or Fos immunoreactivity elicited by D-amphetamine. Deposits into the VTA (Fig. 1C) occupied nearly its entire extent in the mediolateral axis and about one-half of it in the rostrocaudal axis as revealed by TH-immunoreactivity. Tracer injections into the LHb were centered within its middle one-third in the rostrocaudal axis and involved its medial and lateral divisions (Fig. 1D).
Figure 1.
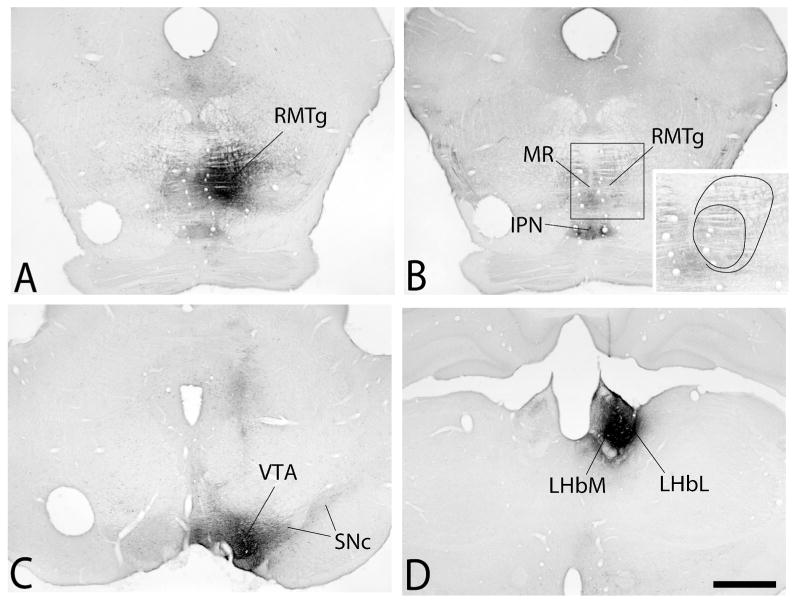
Photomicrographs illustrating representative cholera toxin β subunit (Ctβ) injection sites in the rostromedial tegmental nucleus (RMTg in A and B), ventral tegmental area (VTA in C) and lateral habenula (LHb in D). Outlines shown in the inset in B reflect the dense core and less dense periphery of the injection in relation to immunoreactivity against the μ-opioid receptor. See list for additional abbreviations. Scale bar: 1 mm.
All of the targeted injection sites gave rise to an abundance of retrograde labeling throughout the brain, which consisted of homogeneous and/or punctate accumulations of DAB reaction product in neuronal perikarya and proximal dendrites. The numbers of retrogradely labeled neurons and the patterns in which they were distributed in various brain structures distinguished injections of Ctβ into the RMTg, VTA and LHb (see below).
Mapped retrograde labeling
Patterns of retrograde labeling
The three sites targeted in this study, RMTg, VTA and LHb, gave rise to patterns of retrograde labeling that were distinct along the rostrocaudal axis of the brain and ipsilateral (Fig. 2A) and contralateral (Fig. 2B) to the injections. Of the three, VTA injections produced the most prominent labeling in the ipsilateral forebrain (levels 3-10 in Fig. 2A), whereas few neurons were present in the contralateral forebrain following any of the tracer injections (levels 1-10 in Fig. 2B). Alternatively, injections of tracer into the VTA and RMTg produced relatively numerous labeled neurons in the ipsilateral and contralateral rostral brainstem, albeit with slightly, but significantly fewer contralateral VTA-projecting than contralateral RMTg-projecting neurons (levels 18-24 in Fig. 2A and B). In contradistinction, contralateral LHb-projecting neurons were nearly absent along the entire length of the series of evaluated levels, except at level 11 (Fig. 2B). It was only between the forebrain and brainstem, at diencephalic levels (levels 11-17), that all three of the injection sites were well represented by ipsilateral labeled neurons, ranking, from greatest to least, LHb-, VTA- and RMTg in the rostral half (levels 11-13 in Fig. 2A) and RMTg-, VTA- and LHb in the caudal half (levels 13-15 in Fig. 2A) of the diencephalic stretch. As in the brainstem, the ipsilateral patterns of diencephalic labeling were mirrored on the contralateral side of the brain, but by many fewer labeled neurons (levels 11-15 in Fig. 2B). An additional, moderate bump in the numbers of RMTg-projecting, as compared to VTA- and LHb-projecting, neurons was present in the caudal brainstem both ipsilateral and contralateral to tracer injections (levels 25 and 26 in Figs. 2A and B). Statistical comparisons asserted in this paragraph are reported in Figure 2 and Table 2. The differences in numbers of labeled projections along the rostrocaudal axis encouraged that the analysis of labeling be extended to brain structures, to be described in the following section.
Figure 2.
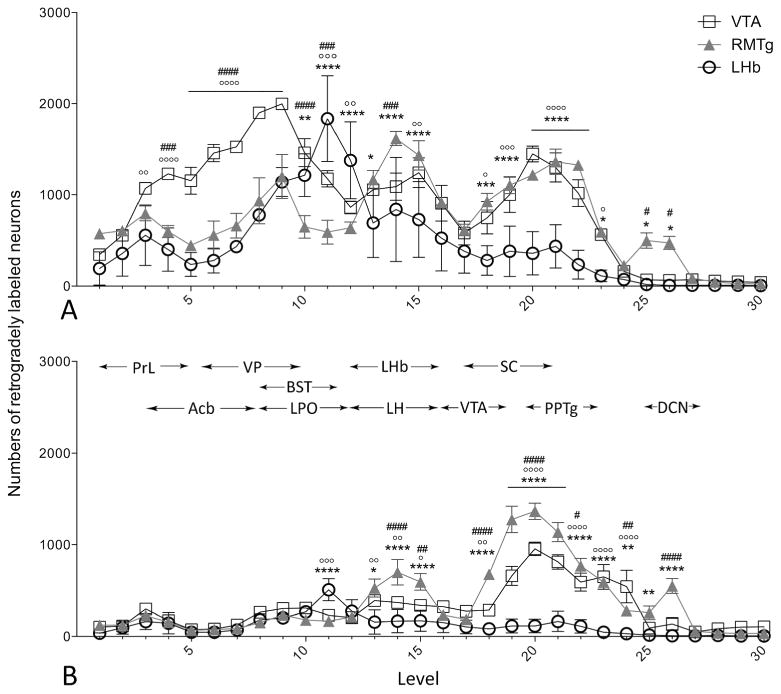
Graphs depicting numbers of VTA-, RMTg-, and LHb-projecting neurons along the rostrocaudal axis of the brain. Shown are means± SEM of numbers of retrogradely labeled neurons per brain section on the ipsilateral (A) and contralateral (B) sides relative to the injection site in rats injected into the VTA (open boxes), RMTg (closed triangles), and LHb (open circles). Approximate rostral and caudal limits of a number of relevant brain structures are indicated by horizontal arrows at the top of panel B. Abbreviations (left to right): PrL: prelimbic cortex (cx); Acb: nucleus accumbens; VP: ventral pallidum; BST: bed nucleus stria terminals; LPO: lateral preoptic area; LHb: lateral habenula; LH: lateral hypothalamus; VTA: ventral tegmental area; SC: superior colliculus; PPTg: pedunculopontine tegmental nucleus; DCN: deep cerebellar nuclei. VTA vs. LHb: °p < 0.05, °°p < 0.01, °°°p < 0.001, °°°°p < 0.0001; VTA vs. RMTg: #p < 0.05, ##p < 0.01, ###p < 0.001, ####p < .0001; RMTg vs. LHb: *p < 0.05, **p < 0.01, *** p < 0.001, **** p < 0.0001. Results of the ANOVAs are given in Table 2.
Table 2. Validations of Statistics in Figure 2*.
| Panel A (ipsilateral) | ||||
| Significant effects | ||||
| region | F (2, 6) = 9.14, p < 0.05 | |||
| level | F (29, 174) = 53.97, p < 0.0001 | |||
| region × level | F (58, 174) = 11.15, p < 0.0001 | |||
| Post hoc tests: | ||||
| Level | VTA vs. LHb | VTA vs. RMTg | RMTg vs. LHb | |
| 3 | t (180) = 3.08 | |||
| 4 | t (180) = 4.97 | t (180) = 3.79 | ||
| 5 | t (180) = 5.50 | t (180) = 4.24 | ||
| 6 | t (180) = 7.07 | t (180) = 5.38 | ||
| 7 | t (180) =6.56 | t (180) = 5.18 | ||
| 8 | t (180) = 6.71 | t (180) = 5.79 | ||
| 9 | t (180) = 5.15 | t (180) = 4.79 | ||
| 10 | t (180) = 4.87 | t (180) = 3.39 | ||
| 11 | t (180) = 3.97 | t (180) = 3.49 | t (180) = 7.46 | |
| 12 | t (180) = 3.09 | t (180) = 4.43 | ||
| 13 | t (180) = 2.84 | |||
| 14 | t (180) = 3.18 | t (180) = 4.67 | ||
| 15 | t (180) = 3.07 | t (180) = 4.22 | ||
| 18 | t (180) = 2.81 | t (180) = 3.87 | ||
| 19 | t (180) = 3.72 | t (180) = 4.35 | ||
| 20 | t (180) = 6.53 | t (180) = 5.15 | ||
| 21 | t (180) = 5.18 | t (180) = 5.56 | ||
| 22 | t (180) = 4.70 | t (180) = 6.55 | ||
| 23 | t (180) = 2.71 | t (180) = 2.90 | ||
| 25 | t (180) = 2.59 | t (180) = 2.90 | ||
| 26 | t (180) = 2.47 | t (180) = 2.80 | ||
| Panel B (contralateral): | ||||
| Significant effects | ||||
| region | F (2, 6) = 17.54, p < 0.01 | |||
| level | F (29, 174) = 59.19, p < 0.0001 | |||
| region × level | F (58, 174) = 19.42, p < 0.0001 | |||
| Post hoc tests: | ||||
| Level | VTA vs. LHb | VTA vs. RMTg | RMTg vs. LHb | |
| 11 | t (180) = 3.59 | t (180) = 4.41 | ||
| 13 | t (180) = 3.00 | t (180) = 4.77 | ||
| 14 | t (180) = 2.61 | t (180) = 4.26 | t (180) = 6.86 | |
| 15 | t (180) = 2.14 | t (180) = 3.32 | t (180) = 5.45 | |
| 18 | t (180) = 2.64 | t (180) = 5.04 | t (180) = 7.68 | |
| 19 | t (180) = 7.03 | t (180) = 7.95 | t (180) = 14.97 | |
| 20 | t (180) = 10.83 | t (180) = 5.29 | t (180) = 16.12 | |
| 21 | t (180) = 8.36 | t (180) = 4.19 | t (180) = 12.55 | |
| 22 | t (180) = 6.20 | t (180) = 2.305 | t (180) = 8.50 | |
| 23 | t (180) = 7.77 | t (180) = 7.03 | ||
| 24 | t (180) = 6.61 | t (180) = 3.37 | t (180) = 3.24 | |
| 25 | t (180) = 3.14 | |||
| 26: | t (180) = 5.33 | t (180) = 6.98 | ||
t values are given only for the levels that are significant. p values are given in the graph (Fig. 2).
Retrograde labeling in brain structures
Collectively, injections of tracer into the VTA, RMTg and LHb produced retrograde labeling in 70 brain structures listed in Fig. 3, which provides means±SEM of the actual numbers of labeled neurons ipsilateral to injection sites (except where noted) in three cases for each site. Results of post-hoc tests are shown in the figure and the associated ANOVA results are provided Table 3. Note, consistent with the prominence of ipsilateral forebrain labeling following VTA injections shown in Figure 2, that the numbers of labeled neurons were substantially greater following VTA as compared to RMTg and LHb injections in numerous forebrain structures listed in Figure 3 under ‘B. Deep telencephalic nuclei (not amygdala)’ and ‘C. Amygdala and extended amygdala’, including the Acb (Fig. 4A-C), ventral pallidum (VP), bed nucleus of stria terminalis, sublenticular extended amygdala, interstitial nucleus of the posterior limb of the anterior commissure (IPAC) and anterior amygdaloid area. A structure that underlies the infralimbic cortex and has been associated in previous accounts (e.g., Luskin and Price, 1983; Geisler and Zahm, 2005; Geisler et al., 2007; Yetnikoff et al., 2014b) with the dorsal peduncular cortex (see under ‘A. Cortex’ in Fig. 3) also exhibited many more retrogradely labeled neurons packed in a dense, non-laminar aggregation after VTA (Fig. 4D) as compared to RMTg (Fig. 4E) and LHb (Fig. 4F) injections. Neurons intimately related to the margin of the magnocellular part of the hypothalamic paraventricular nucleus (PaHmc) also were more numerous and strongly labeled following VTA (Fig. 4G) and RMTg (Fig. 4H) injections than after LHb (Fig. 4I) injections, whereas a hypothalamic region interposed between the PaH and LH and designated (Paxinos and Watson, 2007) as the juxtaparaventricular lateral hypothalamus (jPaLH), exhibited more labeling after LHb injections (Fig. 4G-I). Alternatively, RMTg injections produced much more retrograde labeling in the LHb (listed in Fig. 3 under ‘D. Thalamus, epithalmus and hypothalamus’) than VTA injections, contributing to the prominent diencephalic labeling observed following RMTg injections at levels 12-15n Figure 2A, much as robust labeling in the deep layers of the superior colliculus (SC) contralateral to RMTg injections (Fig. 5A, also listed in Fig. 3 under ‘E. Mesopontine region and cerebellum’) likely explains the dominant contralateral brainstem labeling from RMTg injections exhibited at levels 17-21 in Figure 2B. Light to moderate bilateral labeling biased ipsilaterally was present in the deep SC after VTA injections (Fig. 5B) and slight, entirely ipsilateral labeling was seen after injections into the LHb (Fig. 5C). Labeling in the deep cerebellar nuclei explains the bump observed only after RMTg injections shown at levels 25 and 26 on both sides of the brain (Fig. 2A and B) and modest, but significant, majorities of retrogradely labeled neurons occupied the retrorubral area, dorsomedial tegmental area, pontine reticular formation and raphe interpositus following RMTg as compared to VTA and LHb injections of tracer (also under ‘E. …’ in Fig. 3).
Figure 3.
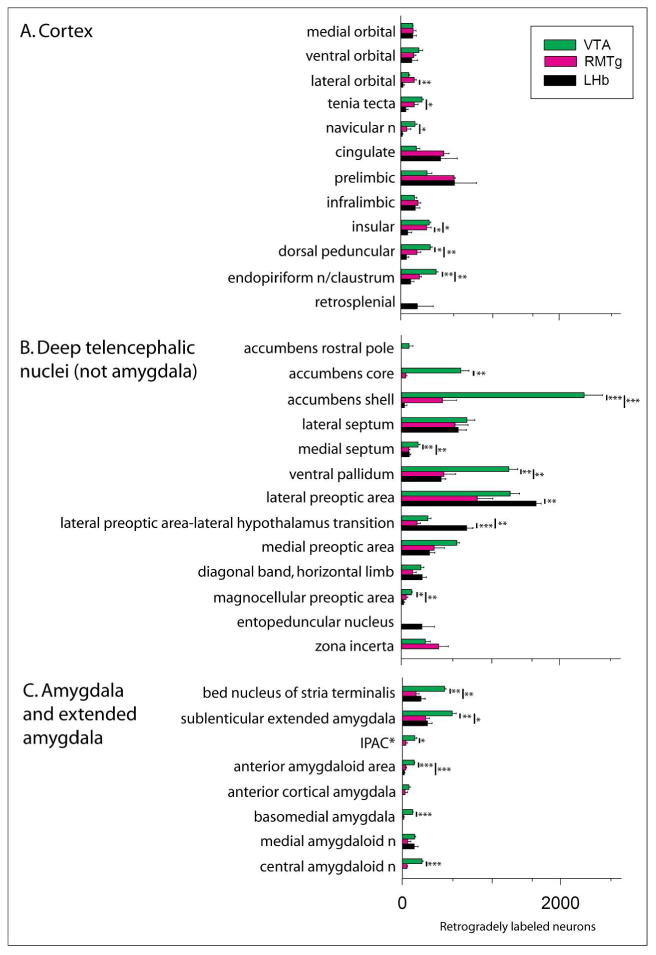
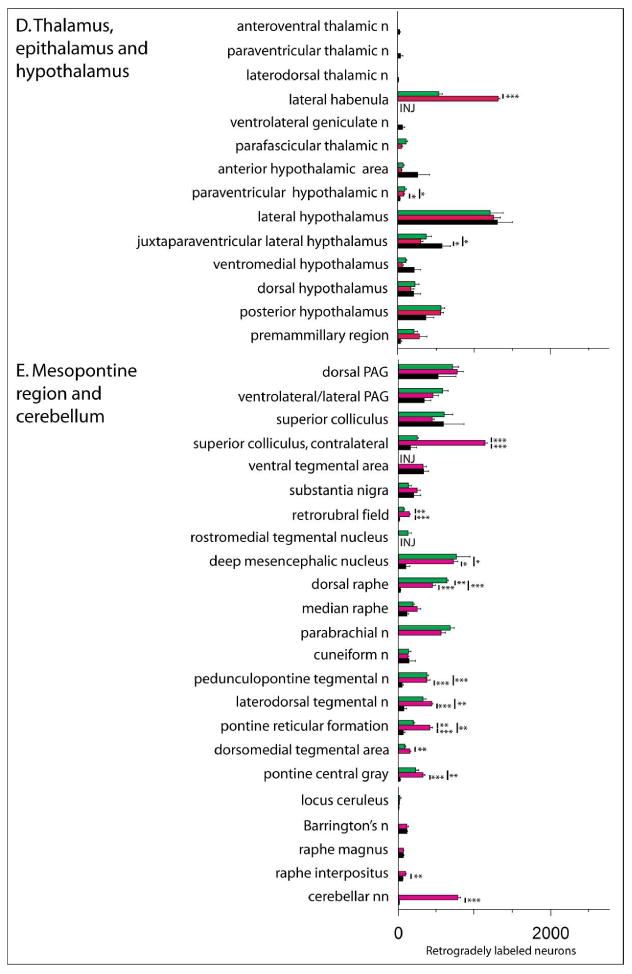
Bar graph illustrating the means± SEM of numbers of retrogradely labeled neurons counted in structures throughout the brain following injections of cholera toxin β subunit (Ctβ) into the ventral tegmental area (VTA, green bars), rostromedial tegmental nucleus (RMTg, magenta bars) and lateral habenula (LHb, black bars). The structures under each subheading (A. - E.) are listed in approximately rostrocaudal order. * - IPAC is interstitial nucleus of the posterior limb of the anterior commissure. Vertical bars with asterisks indicate statistically significant differences with *, **, and *** indicating p < 0.05, p < 0.01 and p < 0.001, respectively (Tukey's posthoc tests). Results of ANOVAs are given in Table 3
Table 3. Validations of Statistics in Figure 3 and Table 4*.
| A. Cortex | |
| lateral orbital cx | F(2,6) = 13.98, p < 0.01 |
| tenia tecta | F(2,6) = 9.11, p < 0.05 |
| navicular nucleus | F(2,6) = 11.61, p < 0.01 |
| insular cx | F(2,6) = 11.61, p < 0.01 |
| dorsal peduncular cx | F(2,6) = 17.53, p < 0.01 |
| endopiriform nucleus/claustrum | F(26) = 24.94, p < 0.01 |
| B. Deep telencephalic nuclei (not amygdala) | |
| accumbens core* | t(4) = 6.71, p < 0.01** |
| accumbens shell | F(2,6) = 48.53, p < 0.001 |
| medial septum | F(2,6) = 10.38, p < 0.05 |
| ventral pallidum | F(2,6) = 18.32, p < 0.01 |
| lateral preoptic area | F(2,6) = 7.29 p < 0.05 |
| lateral preoptic-lateral hypothalamus transition | F(2,6) = 34.83, p < 0.001 |
| magnocellular preoptic area | F(2,6) = 11.22, p <0.01 |
| C. Amygdala and extended amygdala | |
| bed nucleus of the stria terminalis | F(2,6) = 23.53, p < 0.01 |
| sublenticular extended amygdala | F(2,6) = 12.70, p < 0.01 |
| interstitial nucleus of the posterior anterior commissure | t(4) = 4.08, p < 0.01 |
| anterior amygdaloid area | F(2,6) = 75.66, p < 0.0001 |
| basomedial amygdaloid nucleus; | t(4) = 14.55, p < 0.0001 |
| central amygdaloid nucleus | t(4) = 12.15, p < 0.001 |
| D. Thalamus, epithalamus and hypothalamus | |
| lateral habenula | t(4) = 14.38, p < 0.001 |
| paraventricular nucleus of the hypothalamus | F(2,6) = 8.76, p < 0.05 |
| juxtaparaventricular lateral hypothalamus | F(2,6)= 5.22, p < 0.05 |
| E. Mesopontine region and cerebellum | |
| superior colliculus, contralateral | F(2,6) = 113.2, p < 0.0001 |
| retrorubral field | F(2,6) = 46.64, p < 0.001 |
| deep mesencephalic nucleus | F(2,6) = 11.14, p <0.01 |
| dorsal raphe | F(2,6)= 180.1, p < 0.0001 |
| pedunculopontine tegmental nucleus | F(2,6) = 38.10, p < 0.00 |
| laterodorsal tegmental nucleus | F(2,6)= 35.44, p < 0.001 |
| pontine reticular formation | F(2,6)= 37.67, p < 0.001 |
| dorsomedial tegmental nucleus | t(4) = 3.79, p < 0.05 |
| pontine central grey | F(2,6) = 29.65, p < 0.001 |
| raphe interpositus | t(4) = 3.17, p < 0.05 |
| deep cerebellar nuclei | t(4) = 23.26, p < 0.0001 |
Figure 4.
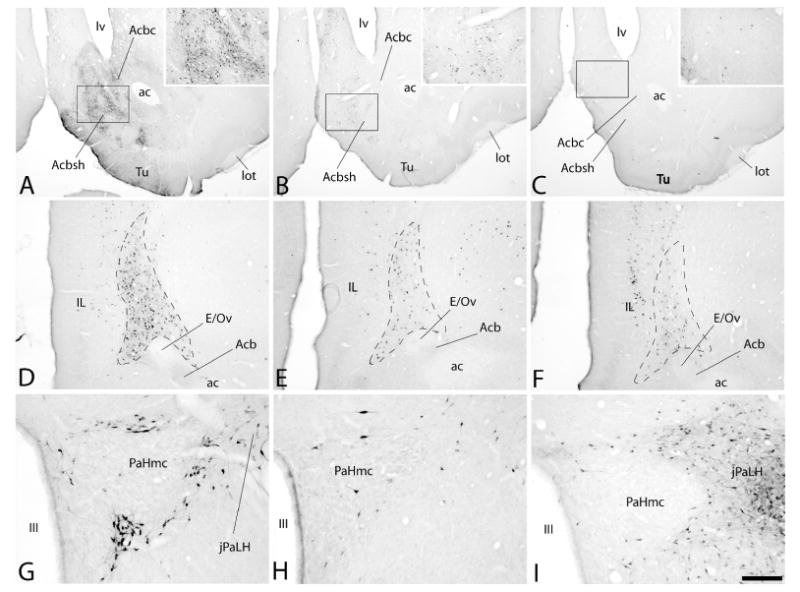
Photomicrographs illustrating retrogradely labeled neurons in the accumbens (Acb in A-C), a heavily labeled structure lodged beneath the infralimbic cortex (outlined area to the right of IL in D-F) and the magnocelluar division of the hypothalamic paraventricular nucleus (PaHmc in G-I) following injections of cholera toxin β subunit (Ctβ) into the ventral tegmental area (VTA, panels A, D and G), rostromedial tegmental nucleus (RMTg, panels B, E and H) and lateral habenula (LHb, panels C, F and I). Note the density of retrogradely labeled neurons in the Acb (A), beneath the infralimbic cortex (D) and surrounding the PaHmc (G) is greatest after injection of tracer into the VTA (A, D and G), whereas it is densest in the juxta-paraventricular lateral hypothalamus (jPaLH in I) following tracer injections into the LHb (C, F and I). Insets in A, B and C are enlargements of the respective boxed areas in the photomicrographs. See list for additional abbreviations. Scale bar: 1 mm in A-C, 200 μm in D-F and 100 μm in G-I.
Figure 5.
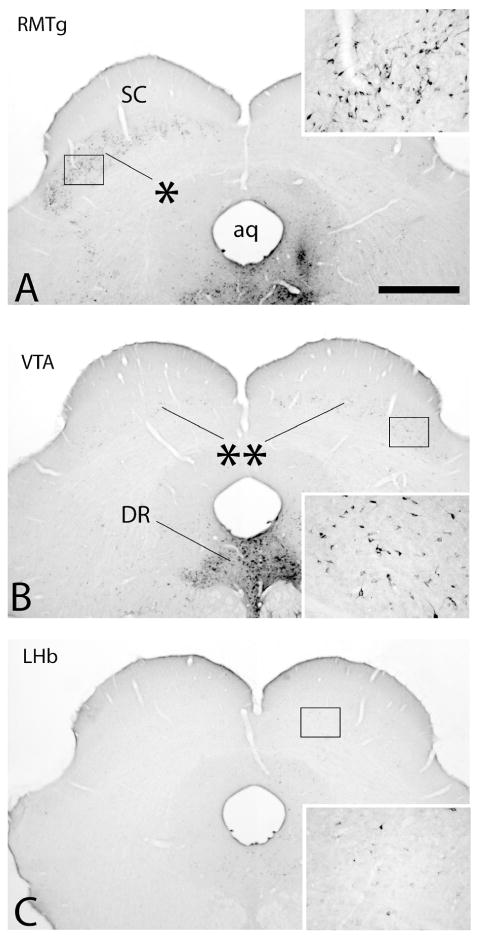
Photomicrographs illustrating retrograde labeling in the deep layers of the superior colliculus (SC) following injections of cholera toxin β subunit (Ctβ) into the rostromedial tegmental nucleus (RMTg in A), ventral tegmental area (VTA in B) and lateral habenula (LHb in C). Insets are enlargements of the boxed areas in the respective micrographs. Tracer was injected into the brain to the right of the midline. Note following injection of tracer into the RMTg that retrograde labeling is distributed almost exclusively contralateral to the RMTg injection (asterisk in A). Substantially less dense labeling was distributed bilaterally but with an ipsilateral bias following tracer injection into the VTA (double asterisks in B). Following LHb injections, labeling in the SC was almost entirely ipsilateral and, although there were moderate numbers of labeled neurons, they were very sparsely labeled with immunoperoxidase reaction product, such that higher magnification was necessary to visualize them (inset in C). See list for additional abbreviations. Scale bar: 1 mm.
Other than the aforementioned ipsilateral jPaLH, only the ipsilateral (Fig. 6 and Fig. 2A, level 11) and contralateral (Fig. 2B, level 11) LPO at the level where it transitions to the LH, exhibited significantly more labeling following injections into the LHb. For the purpose of quantitation illustrated in Figure 3 and Table 4, the LPO-LH transition was represented by a single level (level 11 in Fig. 2). The aggregation of retrogradely labeled neurons produced in the LPO-LH transition by LHb injections had a distinctive dorsomedial to ventrolateral tilt (Fig. 6A, compare with Fig. 6C and E), as did the somatodendritic orientations of many of the tightly packed labeled neurons that comprise it (Fig. 6B, compare with Fig. 6D and F). Less robust differences characterized labeling from tracer injections into the RMTg, VTA and LHb in more rostral parts of the LPO, where the numbers of labeled neurons only trended toward greater following LHb injections as compared to VTA and RMTg injections. Similarly, labeling in the anterior hypothalamic area (AHA) medially adjacent to the caudal LPO and LPO-LH transition region (Fig. 3, subheading D) trended toward greater labeling following LHb injections, although the differences were not significant with our groups of 3 cases/injection site. A complete listing of the respective subsets of structures of which all had significantly more labeled neurons after one of the tracer injections than either or both of the other two is provided in Table 4A-C. (Statistical results reported in Fig. 3 and Table 3 also apply to Table 4. For the convenience of the reader the results of post hoc tests are repeated in Figure 3 and Table 4.) Notably, injections of tracer into the LHb also produced retrograde labeling in a subset of other structures in which significantly fewer labeled neurons were produced than after injections of tracer into the VTA, RMTg, or both (Table 4D).
Figure 6.
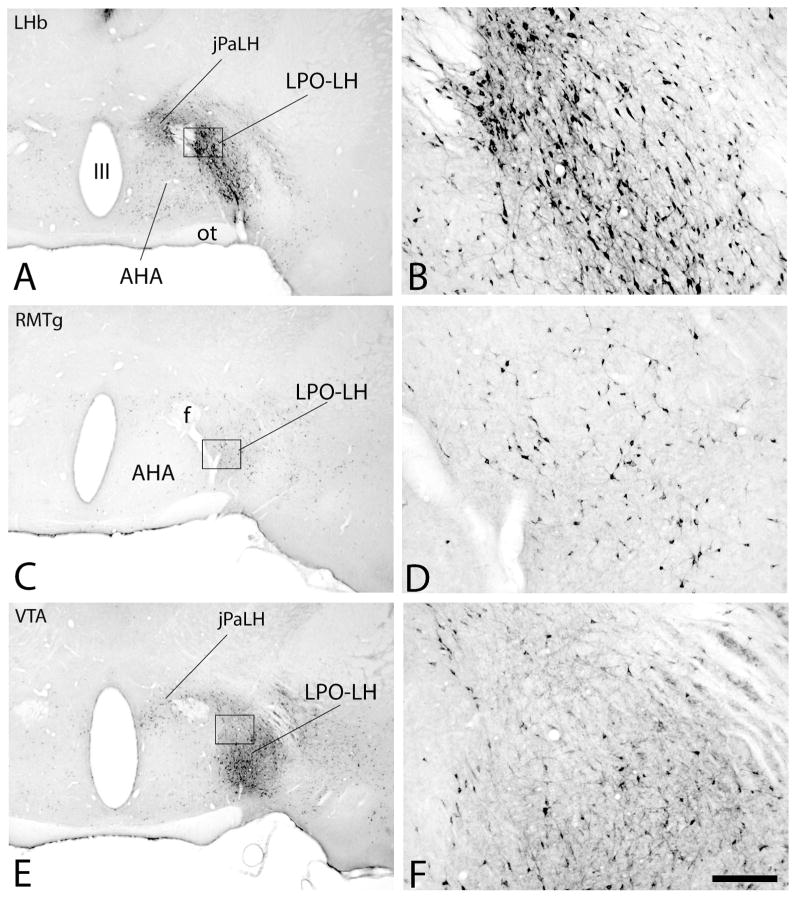
Photomicrographs illustrating retrograde labeling in the transition area between the lateral preoptic area (LPO) and lateral hypothalamus (LH) following injections of Ctβ into the lateral habenula (LHb, A and B), rostromedial tegmental nucleus (RMTg, C and D) and ventral tegmental area (VTA, E and F). Insets in B, D and F show the respective injection sites. Note after tracer injections into the LHb (A), that an arciform, dorsmedial to ventolateral oriented slab of densely packed retrogradely labeled neurons parallels the curved lateral margin of the anterior hypothalamic area (AHA). The somatodendritic architecture of many of the densely labeled neurons in that aggregation exhibits a similar dorsomedial to ventrolateral tilt (B). Note also that robust labeling is present in the juxta-paraventricular lateral hypothalamus (jPaLH) and moderate numbers of labeled neurons occupy the AHA following LHb injections (but not statistically different). In contrast, only moderate numbers of neurons were present in the LPO-LH transition after injections of tracer into the RMTg (C and D) and VTA (E and F) and the general shape of the labeling pattern is quite different from that observed after LHb injections of tracer as shown in A. The apparent density of labeling in the LPO-LH transition is enhanced following VTA injections due to the presence of many anterogradely labeled axons (E and F). Few neurons were present in the AHA following RMTg or VTA injections. The jPaLH contained moderate numbers of labeled neurons following VTA injections, as did the hypothalamic paraventricular nucleus, which exhibited few labeled neurons after LHb or RMTg injections. See list for additional abbreviations. Scale bar: 1 mm.
Table 4.
Means (standard errors are omitted due to space limitations) of retrogradely labeled neurons plotted in various afferent structures following injections of tracer into the ventral tegmental area (VTA), rostromedial tegmental nucleus (RMTg) and lateral habenula (LHb). Structures providing afferents are listed in the left column and numbers of retrogradely labeled neurons projecting to the VTA, RMTg and LHb are also binned with the aid of color-coding in three columns of boxes on the right (see color legend on Figure). Statistically significant differences are indicated by values inserted between the columns of blocks as described in column headings above - VTA vs. RMTg, VTA vs. LHb and RMTg vs. LHb. The symbol <, oriented appropriately and accompanied by the relevant value for p, is utilized to indicate lesser and greater values of pairs of significantly different values. The symbol « indicates the same for pairs of which one of the values being 0 renders the pair not subject to statistical testing. INJ indicates structures were tracer injection sites, which precluded counting retrogradely labeled neurons. Results of statistical analyses are reported in Table 3. * - interstitial nucleus of the posterior limb of the anterior commissure; ** - lateral preoptic area-lateral hypothalamus transition; *** - juxta-paraventricular nucleus.
| Structures exhibiting retrograde labeling | Injection sites (VTA, RMTg and LHb), mean numbers of retrogradely labeled neurons/structure and statistical comparisons | |||||
|---|---|---|---|---|---|---|
|
| ||||||
| VTA | VTA vs RMTg | RMTg | VTA vs LHb | RMTg vs LHb | LHb | |
| A. Statistically more labeling after VTA as compared to both other structures | ||||||
| dorsal peduncular cortex | 372 | 0.05> | 202 | 0.01> | 71 | |
| endopiriform n/claustrum | 445 | 0.01> | 236 | 0.01> | 122 | |
| accumbens rostral pole | 97 | ≫ | 236 | ≫ | ≫ | 0 |
| accumbens core | 751 | 0.01> | 56 | ≫ | ≫ | 0 |
| accumbens shell | 2307 | 0.001> | 519 | 0.001> | 37 | |
| medial septum | 210 | 0.05> | 90 | 0.05> | 99 | |
| ventral pallidum | 1357 | 0.01> | 539 | 0.01> | 503 | |
| magnocellular preoptic area | 129 | 0.05> | 58 | 0.01> | 28 | |
| bed n stria terminalis | 533 | 0.01> | 175 | 0.01> | 235 | |
| IPAC* | 159 | 0.01> | 46 | ≫ | ≫ | 0 |
| sublenticular ext amygdala | 631 | 0.01> | 293 | 0.05> | 319 | |
| anterior amygdaloid area | 151 | 0.001> | 44 | 0.001> | 24 | |
| basomedial amygdaloid n | 132 | 0.001> | 17 | ≫ | ≫ | 0 |
| central amygdaloid n | 249 | 0.001> | 58 | ≫ | ≫ | 0 |
| dorsal raphe | 639 | 0.01> | 447 | 0.001> | 0.001> | 27 |
| B. Statistically more labeling after RMTg as compared to both other structures | ||||||
| lateral habenula | 537 | <0.001 | 1314 | INJ | ||
| superior colliculus, contralat | 247 | <0.001 | 1136 | 0.001> | 157 | |
| retrorubral field | 70 | <0.01 | 145 | 0.001> | 15 | |
| pontine reticular formation | 194 | <0.01 | 411 | 0.05> | 0.001> | 62 |
| dorsomedial tegmental area | 84 | <0.05 | 151 | ≫ | 0 | |
| raphe interpositus | 54 | <0.05 | 92 | ≫ | ≫ | 0 |
| deep cerebellar n | 11 | <0.001 | 780 | ≫ | 0 | |
| C. Statistically more labeling after LHb as compared to one or both other structures | ||||||
| retrosplenial cx | 0 | 0 | ≪ | ≪ | 209 | |
| lateral preotic area | 1374 | 955 | <0.05 | 1700 | ||
| LPO-LH** transition | 336 | 197 | <0.01 | <0.001 | 826 | |
| entopeduncular n | 0 | 0 | ≪ | ≪ | 258 | |
| lateral hypothalamus, juxta-PA*** | 372 | 303 | <0.05 | <0.05 | 580 | |
| anteroventral thalamic n | 0 | 0 | ≪ | ≪ | 29 | |
| paraventricular thalamic n | 0 | 0 | ≪ | ≪ | 39 | |
| laterodorsal thalamic n | 0 | 0 | ≪ | ≪ | 6 | |
| ventrolateral geniculate n | 0 | 0 | ≪ | ≪ | 62 | |
| Numbers of retrogradely labeled neurons: | 0 | 1-100 | 101-300 | 301-700 | 701-1500 | 1501-3100 |
| D. Statistically less labeling after LHb as compared to one or both other structures | ||||||
| insular cx | 359 | 328 | 0.05> | 0.05> | 87 | |
| lateral orbital cx | 100 | 169 | 0.01> | 27 | ||
| tenia tecta | 266 | 169 | 0.05> | 64 | ||
| navicular n | 181 | 75 | 0.05> | 17 | ||
| anterior cortical amygdala | 82 | 35 | ≫ | ≫ | 0 | |
| paraventricular n hypothalamus | 96 | 77 | 0.05> | 0.05> | 32 | |
| zona incerta | 301 | 472 | ≫ | ≫ | 0 | |
| parafascicular thalamic n | 110 | 152 | ≫ | ≫ | 0 | |
| deep mesencephalic n | 762 | 723 | 0.05> | 0.05> | 97 | |
| rostromedial tegmental n | 125 | INJ | ≫ | 0 | ||
| parabrachial n | 678 | 559 | ≫ | ≫ | 0 | |
| Barrington's n | 111 | 109 | ≫ | ≫ | 0 | |
| pedunculopontine tegmental n | 374 | 370 | 0.001> | 0.001> | 46 | |
| laterodorsal tegmental n | 323 | 439 | 0.01> | 0.001> | 70 | |
| pontine central gray | 225 | 323 | 0.01> | 0.001> | 22 | |
| E. No statistically different labeling | ||||||
| medial orbital cx | 150 | 156 | 151 | |||
| ventral orbital cx | 227 | 162 | 137 | |||
| cingulate cx | 194 | 542 | 503 | |||
| prelimbic cx | 332 | 672 | 679 | |||
| infralimbic cx | 172 | 217 | 183 | |||
| lateral septum | 829 | 678 | 720 | |||
| medial preoptic area | 700 | 415 | 356 | |||
| diagonal band, horizontal limb | 245 | 143 | 263 | |||
| medial amygdaloid n | 156 | 68 | 149 | |||
| anterior hypothalamic area | 70 | 49 | 261 | |||
| lateral hypothalamus | 1211 | 1254 | 1304 | |||
| ventromedial hypothalamus | 317 | 297 | 253 | |||
| dorsal hypothalmus | 225 | 173 | 207 | |||
| posterior hypothalamus | 567 | 560 | 368 | |||
| premammillary region | 210 | 283 | 38 | |||
| dorsal PAG**** | 711 | 773 | 578 | |||
| ventrolateral/lateral PAG | 579 | 454 | 339 | |||
| suprior colliculus, ipsilateral | 600 | 443 | 592 | |||
| ventral tegmental area | INJ | 324 | 332 | |||
| substantia nigra | 130 | 243 | 198 | |||
| median raphe | 189 | 246 | 113 | |||
| cunieform n | 136 | 122 | 141 | |||
| locus ceruleus | 6 | 10 | 20 | |||
| raphe magnus | 62 | 66 | 1 | |||
It is noteworthy that fifty structures (71% of the total) listed in Figure 3 were labeled following injections into any of the three tracer-targeted injection sites, indicating that structures that provide input to all three of the targeted structures are numerous and represented widely throughout the brain. In this regard, Table 4E lists 24 structures in which statistically similar numbers of labeled neurons were obtained following injections of tracer into any of the targeted injection sites. Injections of tracer into the VTA and RMTg retrogradely labeled the greatest number of structures (64 [91.4% of total structures labeled in the study] and 63 [90%], respectively), whereas only 56 [80%] of them were labeled following injections into the LHb, which fits with the observation that the mean total number of labeled neurons in the analyzed series of sections from brains that received tracer injections in the LHb (17,434±4031) were significantly fewer (F2,6 = 11 08, p<0.01) than the mean values recorded after the VTA (p<0.05) and RMTg (p<0.05) tracer injections (35,215±874 and 33,057±2912, respectively), which were statistically equivalent to each other.
Another way of explicating these complex data is to express the numbers of labeled neurons in structures in terms of the proportions (percent) of total labeling they represented in the respective cases (Table 5, summarized in graphic format in Fig. 7). This approach reveals that, following injections into the VTA, RMTg and LHb, respectively, each of 47, 42 and 48 retrogradely labeled structures contained less than 1.25% of total labeled neurons on average, whereas 20, 25 and 18 labeled structures contained only 1.125 to 5% (Fig. 7). Only 3, 3 and 4 of labeled structures contained more than 5% of total labeling and the greatest proportional labeling observed in the study was only about 14%, which occurred in the LPO following injections of tracer into the LHb (Table 6).
Table 5. % Total Labeling.
Table illustrating percent of total labeling present in structures following injections of cholera toxin β subunit into the ventral tegmental area, rostromedial tegmental nucleus and lateral habenula. Structures are those given in Fig. 3 and Table 4. Values are means± SEM reflecting % of total labeling from 3 cases. Values from 1.125 to 2.499 are italicized; values from 2.5 to 4.999 are italicized and bolded, values above 5.0 are italicized, bolded and underlined.
| A. Cortex | |||
| VTA | RMTg | Hb | |
| medial orbital | 0.57±0.04 | 0.71±0.019 | 1.04±0.18 |
| ventral orbital | 0.087±0.24 | 0.73±0.13 | 0.91±0.53 |
| lateral orbital | 0.38±0.04 | 0.78±0.16 | 0.18±0.12 |
| tenia tecta | 1.01±0.05 | 0.75±0.2 | 0.42±0.14 |
| navicular n | 0.7±0.12 | 0.32±0.25 | 0.12±0.03 |
| cinculate | 0.75±0.25 | 2.5±0.5 | 3.17±1.3 |
| prelimbic | 1.28±0.33 | 3.1±0.4 | 4.37±1.73 |
| infrlimbic | 0.66±0.15 | 0.98±0.14 | 1.27±0.22 |
| insular | 1.37±0.1 | 1.5±0.27 | 0.55±0.37 |
| dorsal peduncular | 1.43±0.14 | 0.09±0.02 | 0.48±0.15 |
| claustru/endopiriform | 1.7±0.07 | 107±0.05 | 0.8±0.21 |
| retrosplenial | 0 | 0 | 0.8±0.84 |
| B. Deep telencephalic nuclei (not amygdala) | |||
| accumbens, rostral pole | 0.38±0.24 | 0 | 0 |
| accumbens core | 3.28±0.44 | 0 | 0 |
| accumbens shell | 8.87±1.37 | 2.27±0.78 | 0.25±0.24 |
| lateral septum | 3.19±0.55 | 3.0±0.68 | 5.85±2.13 |
| medial septum | 0.8±0.11 | 0.41±0.09 | 0.87±0.37 |
| ventral pallidum | 5.17±0.44 | 2.37±0.63 | 4.23±1.76 |
| lateral preoptic area | 5.24±0.49 | 4.49±1.47 | 13.84±4.68 |
| LPO-LH transition | 1.28±0.19 | 0.92±0.29 | 6.87±2.76 |
| medial preoptic area | 2.68±0.2 | 1.82±0.57 | 2.61±0.15 |
| diagonal band, horizontal limb | 0.94±0.19 | 0.63±0.02 | 237±1.37 |
| magnocellular preoptic area | 0.49±0.04 | 0.26±0.12 | 0.19±0.05 |
| entopeduncular n | 0 | 0 | 1.65±1.2 |
| zona incerta | 1.14±0.26 | 2.27±0.97 | 0 |
| C. Amygdala and extended amygdala | |||
| bed nucleus of stria terminalis | 2.04±0.09 | 0.78±0.15 | 1.69±0.16 |
| sublenticular extended amygdala | 2.4±0.19 | 1.31±0.16 | 2.38±0.35 |
| IPAC* | 0.6±0.10 | 0.2±0.07 | 0 |
| anterior amygdaloid area | 0.58±0.05 | 0.2±0.04 | 0.18±0.05 |
| anterior cortical amygdala | 0.31±0.07 | 0.15±0.16 | 0 |
| basomedial amygdala | 0.50±0.02 | 0.08±0.03 | 0 |
| medial amygdaloid n | 0.06±0.07 | 0.3±0.21 | 1.01±0.18 |
| central amygdaloid n | 0.95±0.04 | 0.26±0.01 | 0 |
| D. Thalamus, epithalamus, and hypothalamus | |||
| VTA | RMTg | LHb | |
| anteroventral thalamic n | 0.27±0.07 | 0.22±0.02 | 1.69±0.94 |
| paraventricular thalamic n | 0 | 0 | 0.29±0.21 |
| laterodorsal thalamic n | 0 | 0 | 0.065±0.02 |
| lateral habenula | 2.04±0.16 | 6.06±0.56 | XX |
| ventrolateral geniculate n | 0 | 0 | 0.39±0.17 |
| parafascicular thalamic n | 0 | 0 | 0.24±0.11 |
| anterior hypthalamus | 0.42±0.08 | 0.24±0.06 | 0 |
| paraventricular hypothalamic n | 0.37±0.09 | 0.36±0.09 | 0.28±0.13 |
| lateral hypothalamus | 4.6±0.68 | 5.81±0.87 | 9.78±1.3 |
| juxtaparaventricular lateral hypothalamus | 1.41±0.23 | 1.38±0.05 | 4.8±2.05 |
| ventromedial hypothalamus | 0.4±0.08 | 0.26±0.08 | 1.4±0.44 |
| dorsal hypothalamus | 0.85±0.22 | 0.78±0.1 | 1.32±0.54 |
| posterior hypothalamus | 2.16±0.17 | 2.58±0.27 | 2.55±0.44 |
| premammillary region | 0.79±0.20 | 1.23±0.44 | 0.34±0.22 |
| E. Mesopontine region and cerebellum | |||
| dorsal periaqueductal gray | 2.71±0.31 | 3.62±0.83 | 3.22±1.42 |
| ventrolateral periaqueductal gray | 2.2±0.28 | 2.05±0.28 | 2.38±0.16 |
| superior colliculus, ipsilateral | 2.28±0.45 | 2.06±0.31 | 3.66±1.65 |
| superior colliculus, contralateral | 0.94±0.04 | 5.22±0.37 | 0.99±0.5 |
| ventral tegmental area | XX | 1.51±0.35 | 0 |
| substantia nigra | 0.49±0.19 | 1.09±0.17 | 1.22±0.68 |
| retrorubral field | 0.27±0.05 | 0.66±0.00 | 0.1±0.03 |
| rostromedial tegmental n | 0.47±0.20 | XX | 0 |
| deep mesencephalic n | 2.88±0.72 | 3.29±0.07 | 0.6±0.39 |
| dorsal raphe | 2.44±0.13 | 2.03±0.01 | 0.2±0.03 |
| median raphe | 0.72±0.05 | 1.12±0.24 | 0.89±0.30 |
| parabrachial n | 2.6±0.34 | 2.54±0.20 | 0 |
| cuneiform n | 0.52±0.15 | 0.55±0.55 | 0.83±0.54 |
| pedunculopontine tegmental n | 1.43±0.14 | 1.7±0.29 | 0.31±0.07 |
| laterodorsal tegmental n | 1.24±0.21 | 2.02±0.14 | 0.43±0.23 |
| pontine reticular formation | 0.74±0.12 | 1.93±0.43 | 0.4±0.16 |
| dorsomedial tegmental area | 0.32±0.06 | 0.71±0.15 | 0 |
| pontine central gray | 0.86±0.20 | 1.47±0.05 | 0.14±0.06 |
| locus ceruleus | 0.02±0.01 | 0.04±0.02 | 0.15±0.10 |
| Barrington's n | 0.42±0.03 | 0.33±0.21 | 0 |
| raphe magnus | 0.23±0.03 | 0.29±0.01 | 0 |
| raphe interpositus | 0.21±0.03 | 0.43±0.08 | 0 |
| cerebellar n | 0.04±0.01 | 3.58±0.20 | 0 |
Values are means±SEM reflecting % of total labeling from 3 cases. Valuse from 1.125 to 2.249 are italicized, values from 2.5 to 4.999 are italicized and bolded, values at 5.0 and above are italicized, bolded and undelined.
Figure 7.
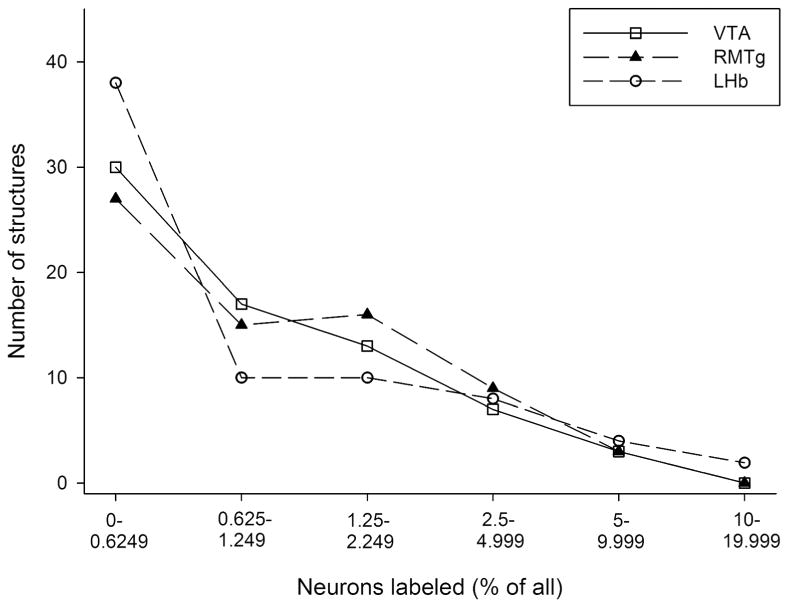
Frequency histogram (presented as a line graph) showing how much of the retrograde labeling (binned on the abscissa as percent of total labeling) was present in how many of structures (ordinate, total is 70, i.e., all the structures listed in Fig. 3) following injections of tracer into the ventral tegmental area (VTA - open squares), rostromedial tegmental nucleus (RMTg - closed triangles) and lateral habenula (LHb - open circles). Note that many of the structures had minimal labeling (less than 0.625% of total) following all of the injections, whereas most of the other structures were contained in the bins representing sparse to moderate labeling (e.g., 0.625-5%). A remaining small minority of structures, which, of note, were different for each of the three injection sites (see Tables 5 and 6) exhibited a substantial amount of labeling (e.g., 5% or more).
Table 6. Dominant retrograde labeling by injection site.
List of structures exhibiting 5% or more and 2.5%-5% of total labeling following injections of tracer into the ventral tegmental area, rostromedial tegmental nucleus and lateral habenula. Values in parentheses are means of three cases. SEMs are provided in Table 5.
| Injection site | 5% of total labeling and greater | 2.5% - 5% of total labeling |
|---|---|---|
| VTA | accumbens shell (8.9%) | lateral hypothalamus (4.6%) |
| ventral pallidum (5.2%) | accumbens core (3.3%) | |
| lateral preoptic area (5.2%) | lateral septum (3.2%) | |
| deep mesencephalic nucleus (2.9%) | ||
| medial preoptic area (2.7%) | ||
| dorsal periagueductal gray (2.7%) | ||
| parabrachial nucleus (2.6%) | ||
| RMTg | lateral habenula (6.1%) | lateral preoptic area (4.5%) |
| lateral hypothalamus (5.9%) | deep cerebellar nuclei (3.6%) | |
| superior colliculus, contralateral (5.2%) | dorsal periaqueductal gray (3.6%) | |
| deep mesencephalic nucleus (3.3%) | ||
| prelimbic cx (3.1%) | ||
| lateral septum (3.0%) | ||
| posterior hypothalamus (2.6%) | ||
| cingulate cx (2.5%) | ||
| parabrachial nucleus (2.5%) | ||
| LHb | lateral preoptic area (13.8%) | prelimbic cx (4.4%) |
| lateral hypothalamus (9.8%) | ventral pallidum (4.2%) | |
| LPO-LH transition region (6.9%) | juxtaparaventricular lateral hypothalamus (3.8%) | |
| lateral septum (5.9%) | ||
| superior colliculus, ipsilateral (3.7%) | ||
| cingulate cx (3.2%) | ||
| dorsal periaqueductal gray (3.2%) | ||
| medial preoptic area (2.6%) | ||
| posterior hypothalamus (2.6%) |
Neurons projecting by axon collaterals to both the RMTg and LHb or VTA
The distribution of single- and double-labeled neurons (Fig. 8) in the LPO and nearby forebrain structures following injections of FG into the RMTg and CTβ into the VTA or LHb of the same rat are shown in Figures 9 and 10, respectively. Quantitation of the labeling (Fig. 11) revealed that mean numbers of double-labeled neurons following intra-subject dual injections into the RMTg and LHb were significantly significantly greater in the ipsilateral (F5,36 = 9.570, p<0.0001), but not contralateral (F5,36= 2.229, not significant), LPO as compared to adjacent basal forebrain regions, which fits with the dominant concentration of retrogradely labeled neurons in the LPO following LHb injections of tracer (Table 6). In contrast, the numbers of double-labeled neurons in the LPO after injections into the RMTg and VTA in the same rat were no different than those in surrounding basal forebrain structure (ipsilateral LPO: F5,12 = 2.002, not significant; contralateral LPO: F5,12 = 0.8943, not significant).
Figure 8.
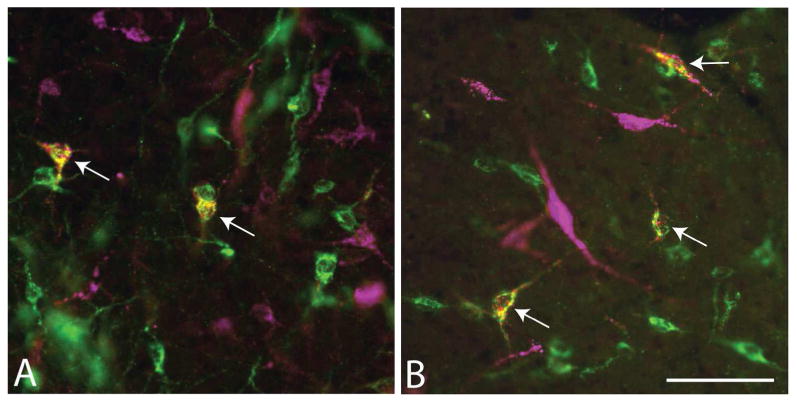
Micrographs showing single-labeled neurons (green and magenta) and double-labeled neurons (white arrows) in the lateral preoptic region following injections of (A) cholera toxin β subunit (Ctβ) into the VTA and Fluorogold (FG) into the RMTg (map is shown in Figure 9) and (B) FG into the LHb and Ctβ into the RMTg (map is shown in Figure 10). Scale bar: 100 μm.
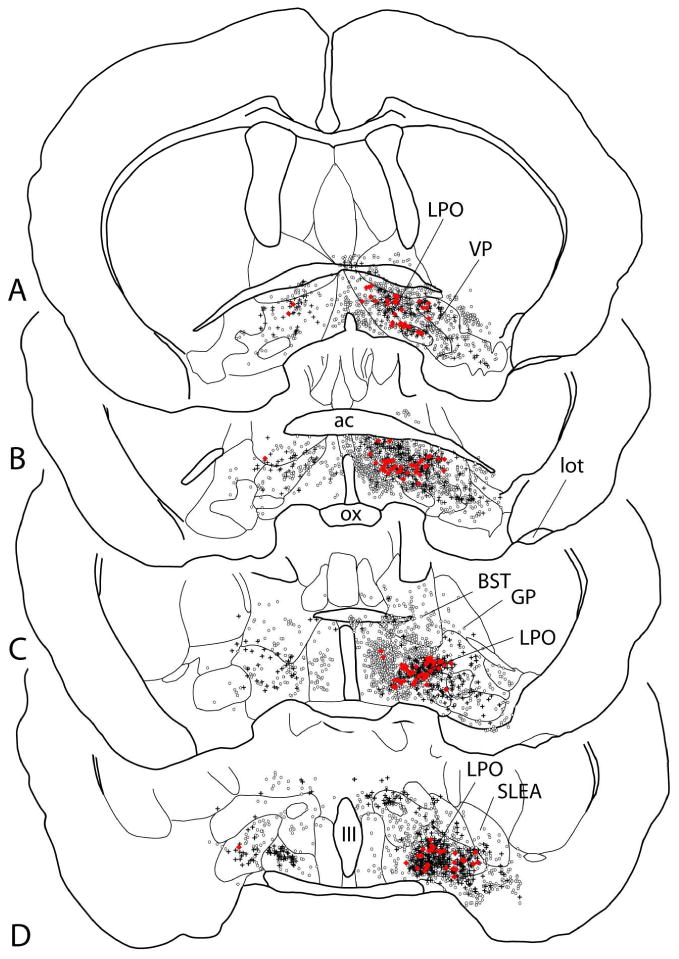
Figure 9.
Map showing several sections through the basal forebrain ordered rostrocaudally from A to D and illustrating retrogradely labeled neurons following injection of the retrograde tracers cholera toxin β subunit (Ctβ) into the ventral tegmental area (circles) and Fluorogold (FG) into the rostromedial tegmental nucleus (crosses). Neurons exhibiting both tracers (double-labeled) are shown as red dots. Note that the double-labeled neurons are not located preferentially in any particular structure (see also Fig. 10). Quantitative comparisons should not be made given the disparity in robustness of retrograde labeling after FG versus Ctβ injections. See list for abbreviations.
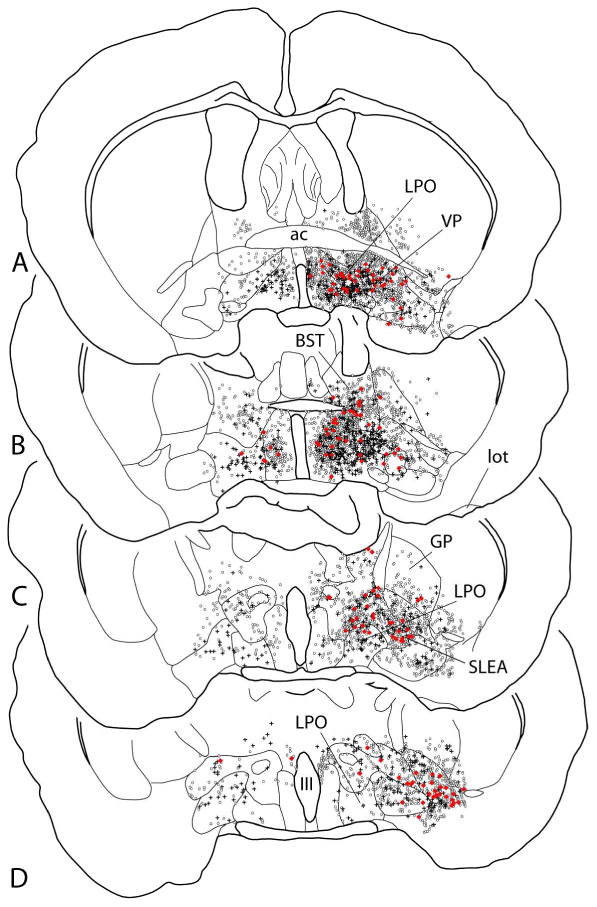
Figure 10.
Map showing several sections through the basal forebrain ordered rostrocaudally from A to D and illustrating retrogradely labeled neurons following injection of the retrograde tracers cholera toxin β subunit into the rostromedial tegmental nucleus (circles) and Fluorogold into the lateral habenula (crosses). Neurons exhibiting both tracers (double-labeled) are shown as red dots. Note that the double-labeled neurons are located preferentially in the lateral preoptic area, which probably reflects the greater concentration of retrogradely labeled neurons in the lateral preoptic area following lateral habenula injections of tracer (see also Fig. 11 and Table 6). See list for additional abbreviations.
Figure 11.
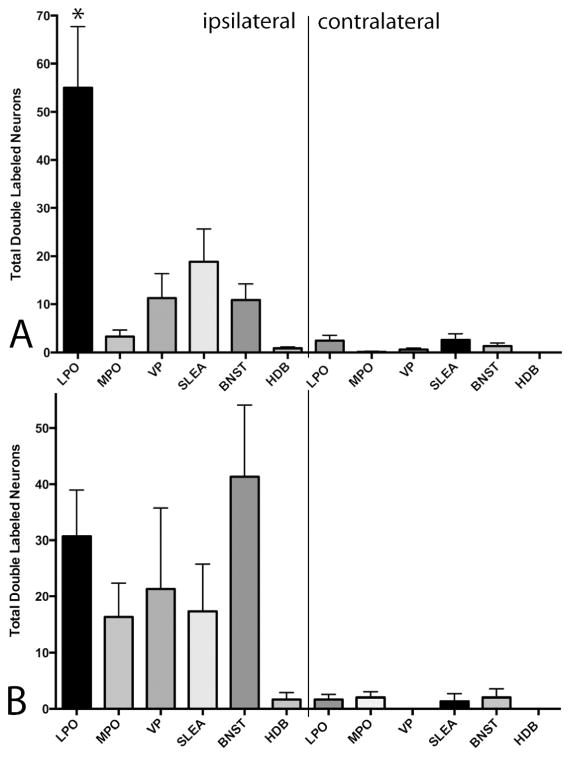
Graphs illustrating the numbers of retrogradely double-labeled neurons observed in various brain structures in cases in which (A) cholera toxin β subunit (Ctβ) was injected into the rostromedial tegmental nucleus (RMTg) and Fluorogold (FG) was injected into the lateral habenula (LHb) or (B) Ctβ was injected into the ventral tegmental area and FG was injected into the RMTg. Note that only the RMTg-LHb injection pair (A) produced preferential double-labeling in a particular structure, the lateral preoptic area. * - p < 0.05.
Discussion
The undoubtedly misleading impression that non-habenular inputs to the RMTg and VTA are equivalent (Jhou et al., 2009a; Kaufling et al., 2009) is dispelled by data reported here, which show fundamental differences in the patterns of distribution of these two sets of afferents along the length of the neuraxis and on different sides of the midline. The data indicate furthermore that, while the afferents of the RMTg and VTA do originate within essentially the same large pool of CNS structures, of which a sizable majority indeed projects to both with statistically equivalent numbers of neurons, each of the two regions also is related to structures that project more strongly to it than the other. Tracer injections into the VTA revealed a mainly ipsilateral surfeit of labeled neurons in structures comprising basal forebrain functional-anatomical systems, particularly ventral striatopallidum and extended amygdala, whereas tracer injections into the RMTg produced more prominent retrograde labeling in more caudally located structures, including the deep layers of the contralateral SC and multiple brainstem sites of which nearly all exhibited nearly uniform bilateral labeling.
In view of its known projections to and reported impact on the activities of both the VTA (Herkenham and Nauta, 1979; Ji and Shepard, 2007; Kim, 2009) and RMTg (Ji and Shepard, 2007; Jhou et al., 2009a; b; Hong et al., 2011; Balcita-Pedino et al., 2011), the LHb was included in this study. It was found that LHb afferents arise in many of the same structures that project to the RMTg and VTA. However, after tracer injections into the LHb as compared to the VTA and RMTg, the numbers of retrogradely labeled structures and neurons/structure were generally fewer. Nonetheless, two structures aligned along the VP-LPO-LH continuum, the LPO-LH transition and jPaLH, were found to exhibit greater numbers of neurons projecting to the LHb as compared to the VTA and RMTg. Furthermore, a number of structures, including particularly the entopeduncular nucleus (EPN), which exhibited no labeling following injections of tracer into the VTA and RMTg, were modestly labeled following LHb injections. Consistent with the present emphasis on the LHb-RMTg axis in responses to reward omission and aversive stimuli (see Intro for refs.), the RMTg and LHb received a greater proportion of their input than did the VTA from the prelimbic and cingulate cortices, which have been linked to aversive responding (e.g., Stern et al., 2010; Lammel et al., 2012; Jiang et al., 2014).
The general pattern of innervation was interestingly similar across the three structures evaluated in this study. The vast majority of inputs to each of the targeted structures arises in many structures that individually provide small percentages of total innervating neurons, whereas just a few structures provide more substantial numbers of innervating neurons to each and these differ for each of the targeted structures. This framework thus pits sets of distinct, potentially dominant inputs from a few innervating structures against many shared, small inputs from a large group of structures, of which each may exert small influence, the former possibly being countebalanced by the latter in the service of function that is at once stable and flexible. It would be interesting to know the extent to which such a framework that features both shared and distinct connectivity generalizes to other relevant forebrain and brainstem structures, such as, e.g., the PPTg (Floresco et al., 2003) and LDTg (Lodge and Grace, 2006a).
The present results should not be surprising in that one expects that the connections of different CNS structures should differ. However, one functional outcome to which all afferents revealed in this study contribute - modulation of activity in the mesotelencephalic DAergic pathway - is of such importance to adaptive and addictive behavior as to encourage all efforts to explicate the underlying neural organization. In view of this, we would like to consider the functional and behavioral implications of the present data after first discussing some pitfalls and limitations that may accompany them.
Methodological considerations
Data from the tracer injections utilized in this study are subject to error attributable to [1] spread of tracer into structures other than those targeted and [2] uptake of tracer by fibers of passage. Accordingly, we used small pipette tips and low ejection currents to strike a balance between the size and efficacy of injection sites (as discussed in, e.g., Zahm et al., 2011b; 2013) and selected cases for analysis with tracer injections that were centered within and more or less filled the targeted structures. Consequently, LHb injections impinged to varying degrees on medial habenula, as did RMTg injections on the median raphe. As regards the known interdigitation of the rostral tip of the RMTg with the caudal VTA (Jhou et al., 2009a; Lavezzi and Zahm, 2011), cases were selected that involved the caudal and rostral two-thirds of the RMTg and VTA, respectively, such that inputs to the region where both are present were not addressed here.
A customary control is to make injections of tracer into structures adjacent to the structure of interest in order to assess the extent to which labeling associated with that structure actually reflects projections of the adjacent structures. This control was omitted in the present study due to its inclusion in other previously published reports on the afferent connections of the three structures studied herein (for RMTg - Jhou et al., 2009a; Kaufling et al., 2009; for VTA - Phillipson, 1979; Oades and Haliday, 1979; Zahm et al., 2001; Geisler and Zahm, 2005; 2006; Geiser et al., 2007; for LHb - Herkenham et al., 1979). The present tracing data were fully consistent with those published results. Finally, it requires emphasis that the injections made in this study were sufficiently big so as to preclude assessment of specificity due to topographic ordering of inputs to the evaluated structures. Specifically, the RMTg, VTA and LHb exhibit a mediolateral, rostrocaudal and dorsoventral ordering of certain inputs and outputs (e.g., Geisler et al., 2005; Jhou et al., 2009b; Gonçalves et al., 2012; Sego et al., 2014) that would be neglected in the present data, which reflect afferents of the entire structures.
Beyond conventional concerns about uptake of tracer due to injection-related damage to fibers of passage, the problem of uptake of tracer must also be considered in light of the observation that, in the forebrain and brainstem, many projecting axons are decorated all along their distal trajectories with axonal varicosities, which are thought to be the main substrate for uptake of tracer (Zahm et al., 2011b). This property of axons could confound retrograde tracing data, particularly after injections of tracer into different structures aligned along complex CNS pathways, such as, e.g., the medial forebrain bundle (Nieuwenhuys et al., 1982), that pass sequentially through numerous structures. Despite the potential challenge to interpretation posed by this anatomical arrangement, empirical observations have revealed that tracer injections at different sites along such pathways typically give rise to distinct patterns of retrograde labeling (Zahm et al., 2011b). Another concern involves the possibility that a disproportionately dense axonal projection field may arise from a relatively small number of neurons, such as is observed, e.g., in the RMTg following retrograde tracer injections into the VTA and SNc to which the RMTg projects with exceptional density (Jhou et al., 2009a; b; Lavezzi and Zahm, 2011). These considerations together encourage caution in preemptively assigning functional significance to differences in numbers of retrogradely labeled neurons, the interpretation of which should instead be contingent upon the results of supplemental analyses, including, at the least, reciprocal anterograde axonal tracing. Thus, the retrograde labeling reported herein is regarded simply as an essential first step to a more comprehensive anatomical and functional dissection of the connectional relationships.
VTA
Although having been studied extensively with retrograde and anterograde tracing methods (recently reviewed in Fields et al., 2007; Sesack and Grace, 2010; Yetnikoff et al., 2014a), the connections of the VTA are unlikely as yet to have been fully revealed, insofar as additional potentially important details regarding that connectivity continue to emerge. In the present study, for example, we observed that VTA-projecting neurons are intimately associated with the PaHmc, as if partially encapsulating it. While a projection from the PaH to the VTA has previously been reported (Geisler and Zahm, 2005; Geerling et al., 2010), this new finding may have important functional implications meriting further study. Another structure that previously has attracted little attention, having been lumped with the dorsal peduncular cortex (DP, e.g., Luskin and Price, 1983; Geisler and Zahm, 2005; Geisler et al., 2007; Yetnikoff et al., 2014b), was shown by the present data to be very robustly labeled following injections of tracer into the VTA. The non-laminar organization of this structure argues against a purely cortical categorization and a preliminary examination of its afferent and efferent connections (Roby et al., 2014) revealed that it has robust reciprocal connections with the olfactory bulb, anterior olfactory nucleus, piriform cortex and numerous forebrain and hypothalamic structures and a distinctively fine grained and dense input to the VTA and medial SNc. These features distinguish it from the DP and other medial prefrontocortical structures and Roby et al. (2014) have conditionally referred to it as the deep frontal nucleus. It may turn out to be an important relay for modulation of the basal forebrain, hypothalamus and mesolimbic dopamine system by olfactory stimuli.
RMTg
The RMTg is a recent addition to the important connectional partners of the VTA (Jhou et al., 2005; Perrotti et al., 2007; Jhou et al., 2009a; b; Kaufling et al., 2009; Balcita-Pedicino et al., 2011) with significant functional and behavioral associations that presently are mainly regarded as reflecting its role in relaying the influence of the LHb to the VTA, particularly as regards reward omission and responses to aversive stimuli (Jhou et al., 2009b; 2013; Hong et al., 2011; Lecca et al., 2010; 2011; Matsui and Williams, 2011; Matsui et al, 2014). However, modulation of midbrain DAergic activity by the RMTg may transcend this limited role, insofar as injections of tracer into the RMTg, as compared to the VTA and LHb, produced significantly more retrogradely labeled neurons in cerebellar nuclei, deep layers of the superior colliculus contralateral to the tracer injection, retrorubral field, pontine reticular formation, dorsomedial tegmental area and raphe interpositus - all structures that have been shown or are thought to have significant roles in regulating motor, including visuomotor, function (e.g., Sahibzada et al., 1986; Dean et al., 1988; von Krosigk and Smith, 1991; Newman and Ginsberg, 1992; von Krosigk et al., 1992; Arts et al., 1998; Arts and Cools, 1998; 1999; 2000; Isa and Sasaki, 2002; Colussi-Mas et al., 2007; Hittinger and Horn, 2012; Pisotta I, Molinari M. 2014; Thach, 2014). Consistent with previous studies (Jhou et al., 2009a; b; Kaufling et al., 2009), the present data also identified the VP-LPO-LH continuum as a major input to the RMTg (see also Zahm et al., 2011a), stimulation of which is often reported to powerfully activate locomotion (Mogenson and Nielsen, 1983; Mogenson et al., 1983; 1985; 1993; Shreve and Uretsky, 1988; 1989; 1991; Austin and Kalivas, 1989; 1990; 1991; Kalivas et all., 1991; Mogenson and Yang, 1991; Willens et al., 1992; Johnson et al., 1996; Gong et al., 1999; Johnson and Napier, 2000; Chen et al., 2001; June et al., 2003; Hubert et al., 2010; Zahm et al., 2014). The LHb relay through the RMTg also is not entirely devoid of implications for motor function (see below). Accordingly, some recent investigations have emphasized that direct stimulation of the RMTg suppresses locomotor activation (Lavezzi et al., 2014) as well as motor learning and performance (Bourdy et al., 2014).
LHb
The LHb is reported to modulate stress response, affliliative behavior, nociception, circadian rhythms, learning and reward (Sutherland, 1982; Lecourtier and Kelly, 2007; Geisler and Trimble, 2008), among which, especially in recent studies, negative responding to aversive stimuli and reward omission has received particular attention (Jhou et al. 2009a; 2013; Hong et al., 2011; Hennigan et al., 2015). The LHb is a powerful modulator of the activity of neurons in the RMTg, and, both directly and via its relay in RMTg, in the VTA (Balcita-Pedicino et al., 2011; Hong et al., 2011). Consistent with the classic study of Herkenham and Nauta (1977), we observed that the LHb gets abundant inputs from many of the same structures that project to the RMTg and VTA, but, according to the quantitative comparisons reported herein, significantly fewer, both in terms of total numbers of labeled neurons and numbers of structures with labeled neurons. Contrary to this trend, however, nine structures with no observed projections to the RMTg or VTA contained retrogradely labeled neurons after LHb injections. These included several thalamic nuclei that project only sparsely to the LHb, the retrosplenial cortex (still to be validated with anterograde tracing) and the aforementioned EPN. While only modest numbers of retrogradely labeled neurons are observed in the EPN following tracer injections into the LHb (present results), anterograde tracing indicates that the projection gives rise to abundant axonal terminations mainly in the lateral part of the LHb (Yetnikoff et al., 2013; Zahm, unpublished results), consistent with earlier retrograde tracing data (Herkenham and Nauta, 1977). Insofar as the medial and lateral parts of the LHb project preferentially to the medial and lateral parts of the RMTg (Araki et al., 1988; Jhou et al., 2009a; b; Kim, 2009; Gonçalves et al., 2012), which, in turn, more strongly innervate the VTA and SNc, respectively (Jhou et al., 2009b; Gonçalves et al., 2012), the EPN would be expected to recruit RMTg modulation mainly of DAergic activity in the SNc and thus affect associated motor control. Shabel et al. (2012) have reported on neurons in the monkey globus pallidus internal segment (GP) that provide excitatory input to the LHb, whereas Hong and Hikosaka (2013) have emphasized that these are located mainly in the underlying part of the substantia innominata and a part of the GP so ventral as to be denoted as basal (GPb). Consequently, the systems affiliations of these LHb-projecting neurons are questionable at present.
Our data from rat indicate that it is the VP-LPO-LH continuum, however, that contains the most neurons projecting to the LHb. Whereas about equivalent absolute numbers of labeled neurons occupied most of the VP-LPO-LH following LHb, VTA and RMTg injections of tracer, significantly more filled the LPO-LH transition and nearby jPaLH after LHb injections. Considered in relative terms, i.e., as a percent of total labeled neurons/injection, VP-LPO-LH projections to the LHb far exceeded those to the VTA and RMTg, thus indicating that by far the strongest afferent influence on the LHb (at least in terms of numbers of retrogradely labeled neurons) arises in the VP-LPO-LH continuum and jPaLH (see also Kowski et al., 2008).
Dual injections
Because abundant and relatively equivalent numbers of basal forebrain neurons, particularly in the VP and LPO, were found to project to the RMTg, VTA and LHb, we examined whether neurons project by means of axon collaterals to more than one of them and, if so, whether neurons doing this are segregated in particular brain structures. As for single tracer injections, cases were selected for analysis only if spread of injected tracer was satisfactorily limited to both targeted structures. Also, because FG injections produced fewer immunoperoxidase labeled neurons than Ctβ injections, double-labeled neurons may have been underestimated in these experiments.
Whereas double-labeled neurons generated by RMTg-VTA injection pairs were scattered widely among forebrain and hypothalamic structures, RMTg-LHb injection pairs produced double-labeled neurons concentrated mainly in the VP-LPO-LH continuum, consistent with the tendency observed in the single labeling part of this study for LHb-projecting neurons to be concentrated there. Interestingly, GABAA receptor antagonists, such as picrotoxin and bicuculline, elicit locomotor activation more effectively, as compared to other basal forebrain sites, when infused into the LPO (Zahm et al., 2014). This action, in conjunction with the robust locomotor activation that accompanies infusion of the GABAA agonist muscimol into the RMTg (Lavezzi et al., 2014), suggests that LPO GABA neurons may inhibit RMTg neurons via one collateral and, via a second collateral, inhibit LHb neurons, which are known to tonically excite RMTg neurons (Jhou et al., 2009b; Lecca et al., 2010; 2011; Hong et al., 2011; Matsui and Williams, 2011). Stimulation of such branched axons would, at once, both directly inhibit RMTg neurons and release them from LHb excitation, which would relieve RMTg-mediated tonic inhibition of VTA DAergic neurons and facilitate mesolimbic DA release. In a similar vein, Wasserman et al. (2013, 2014) have described a possibly collateralized cholinergic projection from the mesopontine tegmentum that inhibits the RMTg at muscarinic M4 receptors, while exciting VTA dopamine neurons at M5 receptors.
It is expected, however, that a converse situation exists in the absence of experimenter administered drug infusions. Insofar as the main input to the LPO comes from GABAergic medium spiny neurons of ventral pallidum, lateral septum and extended amygdala (Zahm et al., 1999; Zahm, 2006; Zahm et al., 2013), which likely mediate tonic suppression of LPO activity, this circuitry likely mediates in vivo a tonic disinhibition of RMTg activity and consequent suppression of DA firing and, thus, mainly behavioral inhibition.
The widespread distribution in basal forebrain of double-labeling following tracer injections into RMTg-VTA pairs requires some further reconciliation. Indeed, there is a conundrum attached to the idea of neurons projecting via collaterals both to VTA DA neurons and RMTg GABA neurons, insofar the actions of the two kinds of collaterals would cancel each other, due to the inversion of signal valence mediated by the GABAergic RMTg. The paradox is eliminated, however, if, instead of to DAergic neurons, the projection to the VTA targets local GABAergic neurons that, in turn, are connected to DAergic neurons (Lavezzi and Zahm, 2014). If the double-labeling seen after paired tracer injections into the RMTg and VTA reflects selective projections to midbrain GABAergic neurons, a coherent control of DAergic neuron activity from numerous basal forebrain structures would be enabled. In contrast to the focal LPO involvement seen after RMTg-LHb injection pairs, such connections could reflect a more widespread basal forebrain GABAergic system capable of maintaining tonic regulation of DA-mediated mesotelencephalic modulations of locomotion, affect and mood.
It should be recognized as well that the VP-LPO-LH continuum also has a minority of excitatory, glutamatergic neurons reported to project to the VTA (Geisler et al. 2007) and prefrontocortical area (Hur and Zaborszky, 2005), which suggests that excitatory projections to the RMTg and LHb also may originate in VP-LPO-LH (see, e.g., Shabel et al., 2012; Hong and Hikosaka, 2013). How these might interact with GABAergic outputs to the VTA, RMTg and LHb is a subject for future study.
Concluding comments
Whereas recent literature has tended to portray the RMTg mainly as a device to relay LHb reflections of disappointment and aversion to midbrain dopamine neurons, the present data reveal several additional sources of input consistent with a broader RMTg role in the integration of motor control. Several inputs shown herein to be better represented in the RMTg as compared to VTA and LHb, such as cerebellum, superior colliculus, retrorubral area, pontine reticular formation, dorsomedial tegmental area and raphe interpositus, are known to contribute significantly to control of motor and orienting functions. The deep layers of the superior colliculus, for example, mediate orienting responses to visual stimuli (Sahibzada et al., 1986; Dean et al., 1988; Isa and Sasaki, 2002) and we have observed that turning behavior elicited by stimulating the deep colliculus is mitigated by stimulation of the contralateral RMTg (Lavezzi and Zahm, 2012). Furthermore, it is difficult to conceive that robust inputs to the LHb from the EPN, a basal ganglia output structure, and relays to the substantia nigra via the lateral part of the RMTg are unrelated to motor function. Indeed, Bourdy et al (2014) have shown that motor learning and performance are enhanced by inactivation and lesions of the RMTg. These considerations bring to mind the seminal observation that chemotoxic lesions of the dopamine innervation of the caudate-putamen not only mitigate stereotypic forelimb and orofacial movements elicited by administration of a high dose of D-amphetamine, but also restore locomotion also suppressed by the drug treatment (Kelly et al., 1975). Insofar as caudate-putamen outputs terminate densely in the EPN, one may ask if this effect on locomotion is not mediated at least in part by suppression of a pathway from the EPN, via the LHb and RMTg, to the SNc (but also see Shabel et al., 2012; Hong and Hikosaka, 2013). This circuitry could facilitate the execution of consummatory tasks such as ingestion, gnawing and grooming by mediating the necessary involuntary interruption of locomotion.
The present data on the afferent systems of the VTA, RMTg and LHb are consistent with the existence of opponent systems probably located mainly within the VP-LPO-LH continuum that negatively and positively modulate the LHb-RMTg axis and, accordingly, ascending DAergic pathways. The VP-LPO-LH continuum is positioned to receive and, presumably, integrate information carried in the outputs of all of the major cortical-subcortical functional anatomical systems with the exception of the dorsal striatopallidal system, which, nonetheless, by exploiting connectivity traversing the EPN, as described above, also targets the LHb-RMTg axis. Ventral striatopallidum, extended amygdala and the septal-preoptic system (Alheid and Heimer, 1988; Heimer and Alheid, 1991; Heimer et al., 1991a; Zahm, 2006; Heimer et al., 2008) all have specified, but also broadly overlapping, areas of termination within VP-LPO-LH (Heimer et al., 1991b; Zahm and Heimer, 1993; Zahm et al., 1999; 2013), which, collectively, reflect the function of the entire limbic lobe of the cerebral cortex, including the hippocampus and laterobasal-cortical nuclei of the amygdala (Heimer and Van Hoesen, 2006). The present results show that, while the afferent innervations of the VTA, RMTg and LHb are clearly distinct, each of these sites receives robust projections from the VP-LPO-LH continuum. In the case of LHb, the biggest component of its entire system of afferents originates there. Precise understanding of the composition and synaptic organization of the proposed opponent systems represents a formidable goal for future study.
Acknowledgments
This work was supported by USPHS NIH grant NS-23805 and a fellowship from the Fonds recherche Santé du Québéc.
List of abbreviations
- ac
anterior commissure
- Acb
accumbens (a.k.a., nucleus accumbens)
- Acbc
core of the Acb
- Acbsh
shell of the Acb
- AHA
anterior hypothalamic area
- anti-
antibody against
- BST (also BNST)
bed nucleus of the stria terminalis
- CB
calbindin
- CG
cingulate cortex
- Ctβ
cholera toxin, β subunit
- DA
dopamine
- DCN
deep cerebellar nuclei
- DP
dorsal peduncular cortex
- DR
dorsal raphe nucleus
- EA
extended amygdala
- E/Ov
ependyma/olfactory ventricle
- f
fornix
- FG
Fluorogold
- Fos
c-fos immediate-early gene protein
- GABA
gamma-aminobutyric acid
- GP
globus pallidus
- HDB
horizontal limb of the diagonal band
- IL
infralimbic cortex
- IPAC
interstitial nucleus of the posterior limb of the anterior commissure
- IPN
interpeduncular nucleus
- jPaLH
juxtaparaventricular part of the lateral hypothalamus
- LH
lateral hypothalamus
- LHb
lateral habenula
- LHbL
LHb, lateral part
- LHbM
LHb, medial part
- LO
lateral orbital cortex
- lot
lateral olfactory tract
- LPO
lateral preoptic area
- LPO-LH
LPO-LH transition area
- lv
lateral ventricle
- Mor
µ-opioid receptor
- MPO
medial preoptica area
- MR
median raphe nucleus
- Nos
nitric oxide synthase
- ot
optic tract
- ox
optic chiasm
- PAG
periaqueductal gray
- PaH
paraventricular nucleus of the hypothalamus
- PaHmc
magnocellular part of the PaH
- PaTh
paraventricular nucleus of the thalamus
- PPTg
pedunculopontine tegmental nucleus
- PrL
prelimbic cortex
- LH
lateral hypothalamus
- PV
parvalbumin
- RMTg
rostromedial tegmental nucleus
- SC
superior colliculus
- SLEA
sublenticular extended amygdala
- SNc
substantia nigra compacta
- SPB
Sorenson's phosphate buffer
- SPB-t
SPB containing triton
- TH
tyrosine hydroxylase
- Tu
olfactory tubercle
- VP
ventral pallidum
- VTA
ventral tegmental area
Footnotes
Author roles: All authors had full access to all the data in the study and take responsibility for the integrity of the data and the accuracy of the data analysis. Study concept and design: LY, HNL, DSZ. Acquisition of data: LY, AYC, HNL. Analysis and interpretation of data: LY, AYC, HNL, DSZ. Drafting of the manuscript: LY, AYC, HNL, DSZ. Critical revision of the manuscript for important intellectual content: LY, HNL, DSZ. Statistical analysis: LY, HNL, DSZ. Obtained funding: DSZ. Administrative, technical, and material support: LY, AYC, HNL, KPP. Study supervision: LY, AYC, HLN, DSZ.
Conflict of interest statement: None of the authors have conflicts of interest to claim.
Literature Cited
- Alheid GF, Heimer L. New perspectives in basal forebrain organization of special relevance for neuropsychiatric disorders: the striatopallidal, amygdaloid, and corticopetal components of substantia innominata. Neuroscience. 1988;27:1–39. doi: 10.1016/0306-4522(88)90217-5. [DOI] [PubMed] [Google Scholar]
- Araki M, McGeer PL, Kimura H. The efferent projections of the rat lateral habenular nucleus revealed by the PHA-L anterograde tracing method. Brain Res. 1988;441:319–330. doi: 10.1016/0006-8993(88)91410-2. [DOI] [PubMed] [Google Scholar]
- Arts MP, Bemelmans FF, Cools AR. Role of the retrorubral nucleus in striatally elicited orofacial dyskinesia in cats: effects of muscimol and bicuculline. Psychopharmacology (Berl) 1998;140:150–156. doi: 10.1007/s002130050752. [DOI] [PubMed] [Google Scholar]
- Arts MP, Cools AR. Bilateral 6-hydroxydopamine lesion in the dopaminergic A8 cell group produces long-lasting deficits in motor programming of cats. Behav Neurosci. 1998;112:102–115. doi: 10.1037//0735-7044.112.1.102. [DOI] [PubMed] [Google Scholar]
- Arts MP, Cools AR. 6-hydroxydopamine lesion in the A8 cell group of cats produces a short-lasting decreased accuracy in goal-directed forepaw-movements. Behav Brain Res. 1999;103:13–21. doi: 10.1016/s0166-4328(99)00023-6. [DOI] [PubMed] [Google Scholar]
- Arts MP, Cools AR. D1 and D2 dopamine receptor agonists improve deficits in motor programming of cats with a 6-hydroxydopamine lesion in the A8 cell group. Behav Brain Res. 2000;108:73–84. doi: 10.1016/s0166-4328(99)00133-3. [DOI] [PubMed] [Google Scholar]
- Austin MC, Kalivas PW. Blockade of enkephalinergic and GABAergic mediated locomotion in the nucleus accumbens by muscimol in the ventral pallidum. Jpn J Pharmacol. 1989;50:487–490. doi: 10.1254/jjp.50.487. [DOI] [PubMed] [Google Scholar]
- Austin MC, Kalivas PW. Enkephalinergic and GABAergic modulation of motor activity in the ventral pallidum. J Pharmacol Exp Ther. 1990;252:1370–1377. [PubMed] [Google Scholar]
- Austin MC, Kalivas PW. Dopaminergic involvement in locomotion elicited from the ventral pallidum/substantia innominata. Brain Res. 1991;542:123–131. doi: 10.1016/0006-8993(91)91005-l. [DOI] [PubMed] [Google Scholar]
- Balcita-Pedicino JJ, Omelchenko N, Bell R, Sesack SR. The inhibitory influence of the lateral habenula on midbrain dopamine cells: Ultrastructural evidence for indirect mediation via the rostromedial mesopontine tegmental nucleus. The Journal of Comparative Neurology. 2011;519:1143–1164. doi: 10.1002/cne.22561. [DOI] [PMC free article] [PubMed] [Google Scholar]
- Barrot M. The ventral tegmentum and dopamine: A new wave of diversity. Neuroscience. 2014;282C:243–247. doi: 10.1016/j.neuroscience.2014.10.017. [DOI] [PubMed] [Google Scholar]
- Barrot M, Thome J. Discovering a new anatomical structure in the brain: implications for neuropsychiatry and therapy. The world journal of biological psychiatry : the official journal of the World Federation of Societies of Biological Psychiatry. 2011;12(Suppl 1):19–22. doi: 10.3109/15622975.2011.598386. [DOI] [PubMed] [Google Scholar]
- Bentivoglio M, Morelli M. The organization and circuits of mesencephalic dopaminergic neurons and the distribution of dopamine receptors in the brain. In: Dunnett SB, Bentivoglio M, Björkland A, Hökfelt T, editors. Handbook of Chemical Neuroanatomy: Dopamine. Vol. 21. Amsterdam: H Elsevier Press; 2005. pp. 1–107. [Google Scholar]
- Bernard R, Veh RW. Individual neurons in the rat lateral habenular complex project mostly to the dopaminergic ventral tegmental area or to the serotonergic raphe nuclei. The Journal of Comparative Neurology. 2012;520:2545–2558. doi: 10.1002/cne.23080. [DOI] [PubMed] [Google Scholar]
- Berridge KC. The debate over dopamine's role in reward: the case for incentive salience. Psychop harmacology. 2007;191:391–431. doi: 10.1007/s00213-006-0578-x. [DOI] [PubMed] [Google Scholar]
- Björklund A, Dunnett SB. Dopamine neuron systems in the brain: an update. Trends Neurosci. 2007;30:194–202. doi: 10.1016/j.tins.2007.03.006. [DOI] [PubMed] [Google Scholar]
- Bourdy R, Barrot M. A new control center for dopaminergic systems: pulling the VTA by the tail. Trends in Neurosciences. 2012;35:681–690. doi: 10.1016/j.tins.2012.06.007. [DOI] [PubMed] [Google Scholar]
- Bourdy R, Sanchez-Catalan MJ, Kaufling J, Balcita-Pedicino JJ, Freund-Mercier MJ, Veinante P, Sesack SR, Georges F, Barrot M. Control of the nigrostriatal dopamine neuron activity and motor function by the tail of the ventral tegmental area. Neuropsychopharmacology. 2014;39:2788–98. doi: 10.1038/npp.2014.129. [DOI] [PMC free article] [PubMed] [Google Scholar]
- Brinschwitz K, Dittgen A, Madai VI, Lommel R, Geisler S, Veh RW. Glutamatergic axons from the lateral habenula mainly terminate on GABAergic neurons of the ventral midbrain. Neuroscience. 2010;168:463–476. doi: 10.1016/j.neuroscience.2010.03.050. [DOI] [PubMed] [Google Scholar]
- Bromberg-Martin ES, Matsumoto M, Hikosaka O. Dopamine in motivational control: rewarding, aversive, and alerting. Neuron. 2010;68:815–834. doi: 10.1016/j.neuron.2010.11.022. [DOI] [PMC free article] [PubMed] [Google Scholar]
- Brown PL, Shepard PD. Lesions of the fasciculus retroflexus alter footshock-induced cFos expression in the mesopontine rostromedial tegmental area of rats. PloS One. 2013;8:e60678. doi: 10.1371/journal.pone.0060678. [DOI] [PMC free article] [PubMed] [Google Scholar]
- Chen JC, Liang KW, Huang YK, Liang CS, Chiang YC. Significance of glutamate and dopamine neurons in the ventral pallidum in the expression of behavioral sensitization to amphetamine. Life Sci. 2001;68:973–983. doi: 10.1016/s0024-3205(00)00995-4. [DOI] [PubMed] [Google Scholar]
- Cohen JY, Haesler S, Vong L, Lowell BB, Uchida N. Neuron-type-specific signals for reward and punishment in the ventral tegmental area. Nature. 2012;482:85–88. doi: 10.1038/nature10754. [DOI] [PMC free article] [PubMed] [Google Scholar]
- Colussi-Mas J, Geisler S, Zimmer L, Zahm DS, Berod A. Activation of afferents to the ventral tegmental area in response to acute amphetamine: a double-labelling study. The European journal of neuroscience. 2007;26(4):1011–1025. doi: 10.1111/j.1460-9568.2007.05738.x. [DOI] [PMC free article] [PubMed] [Google Scholar]
- Dean P, Mitchell IJ, Redgrave P. Contralateral head movements produced by microinjection of glutamate into superior colliculus of rats: evidence for mediation by multiple output pathways. Neuroscience. 1988;24(2):491–500. doi: 10.1016/0306-4522(88)90344-2. [DOI] [PubMed] [Google Scholar]
- Fields HL, Hjelmstad GO, Margolis EB, Nicola SM. Ventral tegmental area neurons in learned appetitive behavior and positive reinforcement. Ann Rev Neurosci. 2007;30:289–316. doi: 10.1146/annurev.neuro.30.051606.094341. [DOI] [PubMed] [Google Scholar]
- Fiorillo CD, Song MR, Yun SR. Multiphasic temporal dynamics in responses of midbrain dopamine neurons to appetitive and aversive stimuli. J Neurosci. 2013;33:4710–4725. doi: 10.1523/JNEUROSCI.3883-12.2013. [DOI] [PMC free article] [PubMed] [Google Scholar]
- Floresco SB, West AR, Ash B, Moore H, Grace AA. Afferent modulation of dopamine neuron firing differentially regulates tonic and phasic dopamine transmission. Nat Neurosci. 2003;6:968–973. doi: 10.1038/nn1103. [DOI] [PubMed] [Google Scholar]
- Geisler S, Derst C, Veh RW, Zahm DS. Glutamatergic afferents of the ventral tegmental area in the rat. J Neurosci. 2007;27:5730–5743. doi: 10.1523/JNEUROSCI.0012-07.2007. [DOI] [PMC free article] [PubMed] [Google Scholar]
- Geisler S, Marinelli M, Degarmo B, Becker ML, Freiman AJ, Beales M, Meredith GM, Zahm DS. Prominent activation of brainstem and pallidal afferents of the ventral tegmental area by cocaine. Neuropsychopharmacol. 2008;33:2688–2700. doi: 10.1038/sj.npp.1301650. [DOI] [PMC free article] [PubMed] [Google Scholar]
- Geisler S, Trimble M. The lateral habenula: no longer neglected. CNS Spectr. 2008;13:484–489. doi: 10.1017/s1092852900016710. [DOI] [PubMed] [Google Scholar]
- Geisler S, Zahm DS. Afferents of the ventral tegmental area in the rat-anatomical substratum for integrative functions. J Comp Neurol. 2005;490:270–294. doi: 10.1002/cne.20668. [DOI] [PubMed] [Google Scholar]
- Geisler S, Zahm DS. Neurotensin afferents of the ventral tegmental area in the rat: [1] re-examination of their origins and [2] responses to acute psychostimulant and antipsychotic drug administration. Eur J Neurosci. 2006;24(1):116–134. doi: 10.1111/j.1460-9568.2006.04928.x. [DOI] [PubMed] [Google Scholar]
- Geerling JC, Shin JW, Chimenti PC, Loewy AD. Paraventricular hypothalamic nucleus: axonal projections to the brainstem. J Comp Neurol. 2010;518:1460–1499. doi: 10.1002/cne.22283. [DOI] [PMC free article] [PubMed] [Google Scholar]
- Gonçalves L, Sego C, Metzger M. Differential projections from the lateral habenula to the rostromedial tegmental nucleus and ventral tegmental area in the rat. J Comp Neurol. 2012;520:1278–1300. doi: 10.1002/cne.22787. [DOI] [PubMed] [Google Scholar]
- Gong W, Neill DB, Lynn M, Justice JB., Jr Dopamine D1/D2 agonists injected into nucleus accumbens and ventral pallidum differentially affect locomotor activity depending on site. Neuroscience. 1999;93:1349–1358. doi: 10.1016/s0306-4522(99)00235-3. [DOI] [PubMed] [Google Scholar]
- Grace AA. In vivo and in vitro intracellular recordings from rat midbrain dopamine neurons. Ann N Y Acad Sci. 1988;537:51–76. doi: 10.1111/j.1749-6632.1988.tb42096.x. [DOI] [PubMed] [Google Scholar]
- Grace AA, Floresco SB, Goto Y, Lodge DJ. Regulation of firing of dopaminergic neurons and control of goal-directed behaviors. Trends Neurosci. 2007;30:220–227. doi: 10.1016/j.tins.2007.03.003. [DOI] [PubMed] [Google Scholar]
- Hart AS, Rutledge RB, Glimcher PW, Phillips PE. Phasic dopamine release in the rat nucleus accumbens symmetrically encodes a reward prediction error term. J Neurosci. 2014;34:698–704. doi: 10.1523/JNEUROSCI.2489-13.2014. [DOI] [PMC free article] [PubMed] [Google Scholar]
- Heimer L, Alheid GF. Piecing together the puzzle of basal forebrain anatomy. Adv Exp Med Biol. 1991;295:1–42. doi: 10.1007/978-1-4757-0145-6_1. [DOI] [PubMed] [Google Scholar]
- Heimer L, de Olmos J, Alheid GF, Zaborszky L. “Perestroika” in the basal forebrain: opening the border between neurology and psychiatry. Progress in brain research. 1991a;87:109–165. doi: 10.1016/s0079-6123(08)63050-2. [DOI] [PubMed] [Google Scholar]
- Heimer L, Van Hoesen GW. The limbic lobe and its output channels: implications for emotional functions and adaptive behavior. Neurosci Biobehav Rev. 2006;30:126–147. doi: 10.1016/j.neubiorev.2005.06.006. [DOI] [PubMed] [Google Scholar]
- Heimer L, Van Hoesen GW, Trimble M, Zahm DS. Anatomy of Neuropsychiatry The New Anatomy of the Basal Forebrain and Its Implications for Neuropsychiatric Illness. Amsterdam: Elsevier; 2008. [Google Scholar]
- Heimer L, Zahm DS, Churchill L, Kalivas PW, Wohltmann C. Specificity in the projection patterns of accumbal core and shell in the rat. Neuroscience. 1991b;41:89–125. doi: 10.1016/0306-4522(91)90202-y. [DOI] [PubMed] [Google Scholar]
- Hennigan K, D'Ardenne K, McClure SM. Distinct midbrain and habenula pathways are involved in processing aversive events in humans. J Neurosci. 2015;35(1):198–208. doi: 10.1523/JNEUROSCI.0927-14.2015. [DOI] [PMC free article] [PubMed] [Google Scholar]
- Herkenham M, Nauta WJ. Afferent connections of the habenular nuclei in the rat. A horseradish peroxidase study, with a note on the fiber-of-passage problem. J Comp Neurol. 1977;173:123–146. doi: 10.1002/cne.901730107. [DOI] [PubMed] [Google Scholar]
- Herkenham M, Nauta WJ. Efferent connections of the habenular nuclei in the rat. J Comp Neurol. 1979;187:19–47. doi: 10.1002/cne.901870103. [DOI] [PubMed] [Google Scholar]
- Hittinger M, Horn AK. The anatomical identification of saccadic omnipause neurons in the rat brainstem. Neuroscience. 2012;210:191–199. doi: 10.1016/j.neuroscience.2012.02.048. [DOI] [PubMed] [Google Scholar]
- Hökfelt T, Mårtensson R, Björklund A, Kleinau S, Goldstein M. Distribution maps of tyrosine-hydroxylase-immunoreactive neurons in the rat brain. In: Björklund A, Hökfelt T, editors. Classical Transmitters in the CNS Handbook of Chemical Neuroanatomy. Part I. Vol. 2. Elsevier; Amsterdam: 1984. pp. 277–379. [Google Scholar]
- Hong S, Jhou TC, Smith M, Saleem KS, Hikosaka O. Negative reward signals from the lateral habenula to dopamine neurons are mediated by rostromedial tegmental nucleus in primates. J Neurosci. 2011;31:11457–11471. doi: 10.1523/JNEUROSCI.1384-11.2011. [DOI] [PMC free article] [PubMed] [Google Scholar]
- Hong S, Hikosaka O. Diverse sources of reward value signals in the basal ganglia nuclei transmitted to the lateral habenula in the monkey. Front Hum Neurosci. 2013;7:778. doi: 10.3389/fnhum.2013.00778. [DOI] [PMC free article] [PubMed] [Google Scholar]
- Hubert GW, Manvich DF, Kuhar MJ. Cocaine and amphetamine-regulated transcript-containing neurons in the nucleus accumbens project to the ventral pallidum in the rat and may inhibit cocaine-induced locomotion. Neuroscience. 2010;165:179–187. doi: 10.1016/j.neuroscience.2009.10.013. [DOI] [PMC free article] [PubMed] [Google Scholar]
- Hur EE, Zaborszky L. Vglut2 afferents to the medial prefrontal and primary somatosensory cortices: a combined retrograde tracing in situ hybridization study [corrected] J Comp Neurol. 2005;483(3):351–373. doi: 10.1002/cne.20444. [DOI] [PubMed] [Google Scholar]
- Ikemoto S. Dopamine reward circuitry: two projection systems from the ventral midbrain to the nucleus accumbens-olfactory tubercle complex. Brain Res Rev. 2007;56:27–78. doi: 10.1016/j.brainresrev.2007.05.004. [DOI] [PMC free article] [PubMed] [Google Scholar]
- Isa T, Sasaki S. Brainstem control of head movements during orienting; organization of the premotor circuits. Progress in neurobiology. 2002;66(4):205–241. doi: 10.1016/s0301-0082(02)00006-0. [DOI] [PubMed] [Google Scholar]
- Jhou T. Neural mechanisms of freezing and passive aversive behaviors. J Comp Neurol. 2005;493(1):111–114. doi: 10.1002/cne.20734. [DOI] [PubMed] [Google Scholar]
- Jhou TC, Fields HL, Baxter MG, Saper CB, Holland PC. The rostromedial tegmental nucleus (RMTg), a GABAergic afferent to midbrain dopamine neurons, encodes aversive stimuli and inhibits motor responses. Neuron. 2009a;61:786–800. doi: 10.1016/j.neuron.2009.02.001. [DOI] [PMC free article] [PubMed] [Google Scholar]
- Jhou TC, Geisler S, Marinelli M, Degarmo BA, Zahm DS. The mesopontine rostromedial tegmental nucleus: A structure targeted by the lateral habenula that projects to the ventral tegmental area of Tsai and substantia nigra compacta. J Comp Neurol. 2009b;513:566–596. doi: 10.1002/cne.21891. [DOI] [PMC free article] [PubMed] [Google Scholar]
- Jhou TC, Good CH, Rowley CS, Xu SP, Wang H, Burnham NW, Hoffman AF, Lupica CR, Ikemoto S. Cocaine drives aversive conditioning via delayed activation of dopamine-responsive habenular and midbrain pathways. J Neurosci. 2013;33:7501–7512. doi: 10.1523/JNEUROSCI.3634-12.2013. [DOI] [PMC free article] [PubMed] [Google Scholar]
- Jhou TC, Xu SP, Lee MR, Gallen CL, Ikemoto S. Mapping of reinforcing and analgesic effects of the mu opioid agonist endomorphin-1 in the ventral midbrain of the rat. Psychopharmacology (Berl) 2012;224(2):303–312. doi: 10.1007/s00213-012-2753-6. [DOI] [PMC free article] [PubMed] [Google Scholar]
- Ji H, Shepard PD. Lateral habenula stimulation inhibits rat midbrain dopamine neurons through a GABAA receptor-mediated mechanism. J Neurosci. 2007;27:6923–6930. doi: 10.1523/JNEUROSCI.0958-07.2007. [DOI] [PMC free article] [PubMed] [Google Scholar]
- Jiang ZC, Pan Q, Zheng C, Deng XF, Wang JY, Luo F. Inactivation of the prelimbic rather than infralimbic cortex impairs acquisition and expression of formalin-induced conditioned place avoidance. Neuroscience letters. 2014;569:89–93. doi: 10.1016/j.neulet.2014.03.074. [DOI] [PMC free article] [PubMed] [Google Scholar]
- Johnson K, Churchill L, Klitenick MA, Hooks MS, Kalivas PW. Involvement of the ventral tegmental area in locomotion elicited from the nucleus accumbens or ventral pallidum. J Pharmacol Exp Ther. 1996;277:1122–1131. [PubMed] [Google Scholar]
- Johnson PI, Napier TC. Ventral pallidal injections of a mu antagonist block the development of behavioral sensitization to systemic morphine. Synapse. 2000;38:61–70. doi: 10.1002/1098-2396(200010)38:1<61::AID-SYN7>3.0.CO;2-6. [DOI] [PubMed] [Google Scholar]
- June HL, Foster KL, McKay PF, Seyoum R, Woods JE, Harvey SC, Eiler WJ, Grey C, Carroll MR, McCane S, Jones CM, Yin W, Mason D, Cummings R, Garcia M, Ma C, Sarma PV, Cook JM, Skolnick P. The reinforcing properties of alcohol are mediated by GABA(A1) receptors in the ventral pallidum. Neuropsychopharmacol. 2003;28:2124–2137. doi: 10.1038/sj.npp.1300239. [DOI] [PubMed] [Google Scholar]
- Kalivas PW, Klitenick MA, Hagler H, Austin MC. GABAergic and enkephalinergic regulation of locomotion in the ventral pallidum: involvement of the mesolimbic dopamine system. In: Napier TC, Kaliavs PW, Hanin I, editors. The Basal Forebrain Anatomy to Function. Plenum Press; NY: 1991. pp. 315–326. Adv Exp Med Biol 295. [DOI] [PubMed] [Google Scholar]
- Kaufling J, Veinante P, Pawlowski SA, Freund-Mercier MJ, Barrot M. Afferents to the GABAergic tail of the ventral tegmental area in the rat. J Comp Neurol. 2009;513:597–621. doi: 10.1002/cne.21983. [DOI] [PubMed] [Google Scholar]
- Kelly PH, Seviour PW, Iversen SD. Amphetamine and apomorphine responses in the rat following 6-OHDA lesions of the nucleus accumbens septi and corpus striatum. Brain Research. 1975;94:507–522. doi: 10.1016/0006-8993(75)90233-4. [DOI] [PubMed] [Google Scholar]
- Kim U. Topographic commissural and descending projections of the habenula in the rat. J Comp Neurol. 2009;513:173–187. doi: 10.1002/cne.21951. [DOI] [PubMed] [Google Scholar]
- Kowski AB, Geisler S, Krauss M, Veh RW. Differential projections from subfields in the lateral preoptic area to the lateral habenular complex of the rat. J Comp Neurol. 2008;507:1465–1478. doi: 10.1002/cne.21610. [DOI] [PubMed] [Google Scholar]
- Lammel S, Ion DI, Roeper J, Malenka RC. Projection-specific modulation of dopamine neuron synapses by aversive and rewarding stimuli. Neuron. 2011;70(5):855–862. doi: 10.1016/j.neuron.2011.03.025. [DOI] [PMC free article] [PubMed] [Google Scholar]
- Lammel S, Lim BK, Malenka RC. Reward and aversion in a heterogeneous midbrain dopamine system. Neuropharmacology. 2014;76(Pt B):351–359. doi: 10.1016/j.neuropharm.2013.03.019. [DOI] [PMC free article] [PubMed] [Google Scholar]
- Lammel S, Lim BK, Ran C, Huang KW, Betley MJ, Tye KM, Deisseroth K, Malenka RC. Input-specific control of reward and aversion in the ventral tegmental area. Nature. 2012;491:212–7. doi: 10.1038/nature11527. [DOI] [PMC free article] [PubMed] [Google Scholar]
- Lavezzi HN, Parsley KP, Zahm DS. Mesopontine rostromedial tegmental nucleus neurons projecting to the dorsal raphe and pedunculopontine tegmental nucleus: psychostimulant-elicited Fos expression and collateralization. Brain Struct Funct. 2012;217:719–734. doi: 10.1007/s00429-011-0368-z. [DOI] [PMC free article] [PubMed] [Google Scholar]
- Lavezzi HN, Parsley KP, Zahm DS. Modulation of locomotor activation by the rostromedial tegmental nucleus. Neuropsychopharmacol. 2014;40:676–87. doi: 10.1038/npp.2014.223. [DOI] [PMC free article] [PubMed] [Google Scholar]
- Lavezzi HN, Zahm DS. The mesopontine rostromedial tegmental nucleus: An integrative modulator of the reward system. Basal Ganglia. 2011;1:191–200. doi: 10.1016/j.baga.2011.08.003. [DOI] [PMC free article] [PubMed] [Google Scholar]
- Lavezzi HN, Zahm DS. Structure and function of some non-habenular afferent projections to the mesopontine rostromedial tegmental nucleus. Soc Neurosci. 2012 Abstr. 183.14. [Google Scholar]
- Lecca S, Melis M, Luchicchi A, Ennas MG, Castelli MP, Muntoni AL, Pistis M. Effects of Drugs of abuse on putative rostromedial tegmental neurons, inhibitory afferents to midbrain dopamine cells. Neuropsychopharmacol. 2010;36:589–602. doi: 10.1038/npp.2010.190. [DOI] [PMC free article] [PubMed] [Google Scholar]
- Lecca S, Melis M, Luchicchi A, Muntoni AL, Pistis M. Inhibitory inputs from rostromedial tegmental neurons regulate spontaneous activity of midbrain dopamine cells and their responses to drugs of abuse. Neuropsychopharmacol. 2011;37:1164–1176. doi: 10.1038/npp.2011.302. [DOI] [PMC free article] [PubMed] [Google Scholar]
- Lecourtier L, Kelly PH. A conductor hidden in the orchestra? Role of the habenular complex in monoamine transmission and cognition. Neurosci Biobehav Rev. 2007;31:658–672. doi: 10.1016/j.neubiorev.2007.01.004. [DOI] [PubMed] [Google Scholar]
- Lindvall O, Björkland A. Dopamine- and norepinephrine-containing neuron systems: Their anatomy in the rat brain. In: Emson PC, editor. Chemical Neuroanatomy. New York: Raven Press; 1983. pp. 229–256. [Google Scholar]
- Lodge DJ, Grace AA. The laterodorsal tegmentum is essential for burst firing of ventral tegmental area dopamine neurons. Proc Natl Acad Sci. 2006a;103:5167–5172. doi: 10.1073/pnas.0510715103. [DOI] [PMC free article] [PubMed] [Google Scholar]
- Lodge DJ, Grace AA. The hippocampus modulates dopamine neuron responsivity by regulating the intensity of phasic neuron activation. Neuropsychopharmacol. 2006b;31:1356–1361. doi: 10.1038/sj.npp.1300963. [DOI] [PubMed] [Google Scholar]
- Luskin MB, Price JL. The topographic organization of associational fibers of the olfactory system in the rat, including centrifugal fibers to the olfactory bulb. J Comp Neurol. 1983;216:264–291. doi: 10.1002/cne.902160305. [DOI] [PubMed] [Google Scholar]
- Marinelli M, McCutcheon JE. Heterogeneity of dopamine neuron activity across traits and states. Neuroscience. 2014;282C:176–197. doi: 10.1016/j.neuroscience.2014.07.034. [DOI] [PMC free article] [PubMed] [Google Scholar]
- Marinelli M, Rudick CN, Hu XT, White FJ. Excitability of dopamine neurons: modulation and physiological consequences. CNS & Neurological Disorders Drug Targets. 2006;5:79–97. doi: 10.2174/187152706784111542. [DOI] [PubMed] [Google Scholar]
- Matsui A, Williams JT. Opioid-sensitive GABA inputs from rostromedial tegmental nucleus synapse onto midbrain dopamine neurons. J Neurosci. 2011;31:17729–17735. doi: 10.1523/JNEUROSCI.4570-11.2011. [DOI] [PMC free article] [PubMed] [Google Scholar]
- Matsui A, Jarvie BC, Robinson BG, Hentges ST, Williams JT. Separate GABA afferents to dopamine neurons mediate acute action of opioids, development of tolerance, and expression of withdrawal. Neuron. 2014;82:1346–56. doi: 10.1016/j.neuron.2014.04.030. [DOI] [PMC free article] [PubMed] [Google Scholar]
- Matsumoto M, Hikosaka O. Lateral habenula as a source of negative reward signals in dopamine neurons. Nature. 2007;447:1111–1115. doi: 10.1038/nature05860. [DOI] [PubMed] [Google Scholar]
- Matsumoto M, Hikosaka O. Representation of negative motivational value in the primate lateral habenula. Nature Neurosci. 2008;12:77–84. doi: 10.1038/nn.2233. [DOI] [PMC free article] [PubMed] [Google Scholar]
- Matsumoto M, Hikosaka O. Two types of dopamine neuron distinctly convey positive and negative motivational signals. Nature. 2009;459:837–841. doi: 10.1038/nature08028. [DOI] [PMC free article] [PubMed] [Google Scholar]
- Mogenson GJ, Brudzynski SM, Wu M, Yang CR, Yim CY. From motivation to Action: A review of dopaminergic regulation of limbic-nucleus accumbens-ventral pallidum-pedunculopontine nucleus circuitries involved in limbic-motor integration. In: Kalivas PW, Barnes CD, editors. Limbic Motor Circuits and Neuropsychiatry. CRC Press; Boca Raton, FL: 1993. pp. 193–236. Adv Exp Med Biol 295. [Google Scholar]
- Mogenson GJ, Nielsen MA. Evidence that an accumbens to subpallidal GABAergic projection contributes to locomotor activity. Brain Res Bull. 1983;11:309–314. doi: 10.1016/0361-9230(83)90166-1. [DOI] [PubMed] [Google Scholar]
- Mogenson GJ, Swanson LW, Wu M. Neural projections from nucleus accumbens to globus pallidus, substantia innominata, and lateral preoptic-lateral hypothalamic area: an anatomical and electrophysiological investigation in the rat. J Neurosci. 1983;3:189–202. doi: 10.1523/JNEUROSCI.03-01-00189.1983. [DOI] [PMC free article] [PubMed] [Google Scholar]
- Mogenson GJ, Swanson LW, Wu M. Evidence that projections from substantia innominata to zona incerta and mesencephalic locomotor region contribute to locomotor activity. Brain Res. 1985;334:65–76. doi: 10.1016/0006-8993(85)90568-2. [DOI] [PubMed] [Google Scholar]
- Mogenson GJ, Yang CR. The contribution of basal forebrain to limbic-motor integration and the mediation of motivation to action. In: Napier TC, Kaliavs PW, Hanin I, editors. The Basal Forebrain. Anatomy to Function. Plenum Press; NY: 1991. pp. 267–290. Adv Exp Med Biol 295. [DOI] [PubMed] [Google Scholar]
- Morales MF, Wang H, Zhang P, Lehrmann E, Wook WH, Becker KG, Ikemotor S, Jhou TC. Expression of prepronociceptin mRNA in the rostromedial tegmental nucleus (RMTg) Soc Neurosci. 2011 Abstr 201.20. [Google Scholar]
- Newman DB, Ginsberg CY. Brainstem reticular nuclei that project to the cerebellum in rats: a retrograde tracer study. Brain, behavior and evolution. 1992;39(1):24–68. doi: 10.1159/000114102. [DOI] [PubMed] [Google Scholar]
- Nieuwenhuys R, Geeraedts LM, Veening JG. The medial forebrain bundle of the rat. I. General introduction. J Comp Neurol. 1982;206:49–81. doi: 10.1002/cne.902060106. [DOI] [PubMed] [Google Scholar]
- Oades RD, Halliday GM. Ventral tegmental (A10) system: neurobiology. 1. Anatomy and connectivity. Brain Res. 1987;434(2):117–165. doi: 10.1016/0165-0173(87)90011-7. [DOI] [PubMed] [Google Scholar]
- Omelchenko N, Bell R, Sesack SR. Lateral habenula projections to dopamine and GABA neurons in the rat ventral tegmental area. Eur J Neurosci. 2009;30:1239–1250. doi: 10.1111/j.1460-9568.2009.06924.x. [DOI] [PMC free article] [PubMed] [Google Scholar]
- Paxinos G, Carrive P, Wang H, Wang PY. Chemoarchitectonic atlas of the rat brainstem. Academic Press; San Diego: 1999. [Google Scholar]
- Paxinos G, Watson C. The rat brain in stereotaxic coordinates. 6th. Academic Press; San Diego: 2007. [DOI] [PubMed] [Google Scholar]
- Perrotti LI, Bolanos CA, Cho KH, Russo SJ, Edwards S, Ulery PG, Wallace DL, Self DW, Nestler EJ, Barrot M. DeltaFosB accumulates in a GABAergic cell population in the posterior tail of the ventral tegmental area after psychostimulant treatment. Eur J Neurosci. 2005;21:2817–24. doi: 10.1111/j.1460-9568.2005.04110.x. [DOI] [PubMed] [Google Scholar]
- Phillipson OT. Afferent projections to the ventral tegmental area of Tsai and interfascicular nucleus: a horseradish peroxidase study in the rat. J Comp Neurol. 1979;187(1):117–143. doi: 10.1002/cne.901870108. [DOI] [PubMed] [Google Scholar]
- Pisotta I, Molinari M. Cerebellar contribution to feedforward control of locomotion. Frontiers in human neuroscience. 2014;8:475. doi: 10.3389/fnhum.2014.00475. [DOI] [PMC free article] [PubMed] [Google Scholar]
- Rebec GV, Grabner CP, Johnson M, Pierce RC, Bardo MT. Transient increases in catecholaminergic activity in medial prefrontal cortex and nucleus accumbens shell during novelty. Neuroscience. 1997a;76:707–714. doi: 10.1016/s0306-4522(96)00382-x. [DOI] [PubMed] [Google Scholar]
- Rebec GV, Christensen JCR, Guerra C, Bardo MT. Regional and temporal differences in real-time dopamine efflux in the nucleus accumbens during free-choice novelty. Brain Res. 1997b;776:61–67. doi: 10.1016/s0006-8993(97)01004-4. [DOI] [PubMed] [Google Scholar]
- Reynolds SM, Zahm DS. Specificity in the projections of prefrontal and insular cortex to ventral striatopallidum and the extended amygdala. J Neurosci. 2005;25:11757–11767. doi: 10.1523/JNEUROSCI.3432-05.2005. [DOI] [PMC free article] [PubMed] [Google Scholar]
- Roby D, Yetnikoff L, Parsley KP, Zahm DS. A novel afferent of the ventral tegmental area and substantia nigra compacta from the deep frontal lobe. Soc Neurosci. 2014 Abstr 442.05. [Google Scholar]
- Saddoris MP, Sugam JA, Stuber GD, Witten IB, Deisseroth K, Carelli RM. Mesolimbic Dopamine Dynamically Tracks, and Is Causally Linked to, Discrete Aspects of Value-Based Decision Making. Biological psychiatry. 2014 Nov 13; doi: 10.1016/j.biopsych.2014.10.024. pii: S0006-3223(14)00833-6. Epub ahead of print. [DOI] [PMC free article] [PubMed] [Google Scholar]
- Sahibzada N, Dean P, Redgrave P. Movements resembling orientation or avoidance elicited by electrical stimulation of the superior colliculus in rats. The Journal of neuroscience : the official journal of the Society for Neuroscience. 1986;6(3):723–733. doi: 10.1523/JNEUROSCI.06-03-00723.1986. [DOI] [PMC free article] [PubMed] [Google Scholar]
- Salamone JD, Correa M. The mysterious motivational functions of mesolimbic dopamine. Neuron. 2012;76(3):470–485. doi: 10.1016/j.neuron.2012.10.021. [DOI] [PMC free article] [PubMed] [Google Scholar]
- Scammell TE, Estabrooke IV, McCarthy MT, Chemelli RM, Yanagisawa M, Miller MS, Saper CB. Hypothalamic arousal regions are activated during modafinil-induced wakefulness. J Neurosci. 2000;20:8620–8. doi: 10.1523/JNEUROSCI.20-22-08620.2000. [DOI] [PMC free article] [PubMed] [Google Scholar]
- Schulz S, Schreff M, Koch T, Zimprich A, Gramsch C, Elde R, Höllt V. Immunolocalization of two mu-opioid receptor isoforms (MOR1 and MOR1B) in the rat central nervous system. Neuroscience. 1998;82:613–22. doi: 10.1016/s0306-4522(97)00288-1. [DOI] [PubMed] [Google Scholar]
- Schultz W. Predictive reward signal of dopamine neurons. J Neurophysiol. 1998;80:1–27. doi: 10.1152/jn.1998.80.1.1. [DOI] [PubMed] [Google Scholar]
- Schultz W. Behavioral dopamine signals. Trends Neurosci. 2007;30:203–210. doi: 10.1016/j.tins.2007.03.007. [DOI] [PubMed] [Google Scholar]
- Schultz W. Updating dopamine reward signals. Curr Opin Neurobiol. 2013;23:229–238. doi: 10.1016/j.conb.2012.11.012. [DOI] [PMC free article] [PubMed] [Google Scholar]
- Schultz W, Dayan P, Montague PR. A neural substrate of prediction and reward. Science. 1997;275:1593–1599. doi: 10.1126/science.275.5306.1593. [DOI] [PubMed] [Google Scholar]
- Sego C, Gonçalves L, Lima L, Furigo IC, Donato J, Jr, Metzger M. Lateral habenula and the rostromedial tegmental nucleus innervate neurochemically distinct subdivisions of the dorsal raphe nucleus in the rat. J Comp Neurol. 2014;522(7):1454–1484. doi: 10.1002/cne.23533. [DOI] [PubMed] [Google Scholar]
- Sesack SR, Grace AA. Cortico-basal ganglia reward network: Microcircuitry. Neuropsychopharmacol. 2010;35:27–47. doi: 10.1038/npp.2009.93. [DOI] [PMC free article] [PubMed] [Google Scholar]
- Shabel SJ, Proulx CD, Trias A, Murphy RT, Malinow R. Input to the lateral habenula from the basal ganglia is excitatory, aversive, and suppressed by serotonin. Neuron. 2012;74(3):475–481. doi: 10.1016/j.neuron.2012.02.037. [DOI] [PMC free article] [PubMed] [Google Scholar]
- Shelton L, Becerra L, Borsook D. Unmasking the mysteries of the habenula in pain and analgesia. Prog Neurobiol. 2012;96:208–219. doi: 10.1016/j.pneurobio.2012.01.004. [DOI] [PMC free article] [PubMed] [Google Scholar]
- Shreve PE, Uretsky NJ. Effect of GABAergic transmission in the subpallidal region on the hypermotility response to the administration of excitatory amino acids and Picrotoxin into the nucleus accumbens. Neuropharmacol. 1988;27:1271–1277. doi: 10.1016/0028-3908(88)90030-5. [DOI] [PubMed] [Google Scholar]
- Shreve PE, Uretsky NJ. AMPA, kainic acid, and N-methyl-D-aspartic acid stimulate locomotor activity after injection into the substantia innominata/lateral preoptic area. Pharmacol Biochem Behav. 1989;34:101–106. doi: 10.1016/0091-3057(89)90360-2. [DOI] [PubMed] [Google Scholar]
- Shreve PE, Uretsky NJ. GABA and glutamate interact in the substantia innominata/lateral preoptic area to modulate locomotor activity. Pharmacol Biochem Behav. 1991;38:385–388. doi: 10.1016/0091-3057(91)90296-e. [DOI] [PubMed] [Google Scholar]
- Stamatakis AM, Stuber GD. Activation of lateral habenula inputs to the ventral midbrain promotes behavioral avoidance. Nat Neurosci. 2012;15:1105–1107. doi: 10.1038/nn.3145. [DOI] [PMC free article] [PubMed] [Google Scholar]
- Steinberg EE, Keiflin R, Boivin JR, Witten IB, Deisseroth K, Janak PH. A causal link between prediction errors, dopamine neurons and learning. Nature neuroscience. 2013;16(7):966–973. doi: 10.1038/nn.3413. [DOI] [PMC free article] [PubMed] [Google Scholar]
- Stern CA, Do Monte FH, Gazarini L, Carobrez AP, Bertoglio LJ. Activity in prelimbic cortex is required for adjusting the anxiety response level during the elevated plus-maze retest. Neuroscience. 2010;170(1):214–222. doi: 10.1016/j.neuroscience.2010.06.080. [DOI] [PubMed] [Google Scholar]
- Stopper CM, Floresco SB. What's better for me? Fundamental role for lateral habenula in promoting subjective decision biases. Nature Neurosci. 2013;17:33–35. doi: 10.1038/nn.3587. [DOI] [PMC free article] [PubMed] [Google Scholar]
- Sutherland RJ. The dorsal diencephalic conduction system: a review of the anatomy and functions of the habenular complex. Neurosci Biobehav Rev. 1982;6:1–13. doi: 10.1016/0149-7634(82)90003-3. [DOI] [PubMed] [Google Scholar]
- Thach WT. Does the cerebellum initiate movement? Cerebellum (London, England) 2014;13(1):139–150. doi: 10.1007/s12311-013-0506-7. [DOI] [PubMed] [Google Scholar]
- Ungless MA. Dopamine: The salient issue. Trends Neurosci. 2004;27:702–706. doi: 10.1016/j.tins.2004.10.001. [DOI] [PubMed] [Google Scholar]
- Ungless MA, Argilli E, Bond A. Effects of stress and aversion on dopamine neurons: implications for addiction. Neuroscience and biobehavioral reviews. 2010;35(2):151–156. doi: 10.1016/j.neubiorev.2010.04.006. [DOI] [PubMed] [Google Scholar]
- Velasquez KM, Molfese DL, Salas R. The role of the habenula in drug addiction. Front Hum Neurosci. 2014;8:174. doi: 10.3389/fnhum.2014.00174. [DOI] [PMC free article] [PubMed] [Google Scholar]
- von Krosigk M, Smith AD. Descending Projections from the Substantia Nigra and Retrorubral Field to the Medullary and Pontomedullary Reticular Formation. Eur J Neurosci. 1991;3:260–273. doi: 10.1111/j.1460-9568.1991.tb00088.x. [DOI] [PubMed] [Google Scholar]
- von Krosigk M, Smith Y, Bolam JP, Smith AD. Synaptic organization of GABAergic inputs from the striatum and the globus pallidus onto neurons in the substantia nigra and retrorubral field which project to the medullary reticular formation. Neuroscience. 1992;50:531–49. doi: 10.1016/0306-4522(92)90445-8. [DOI] [PubMed] [Google Scholar]
- Wasserman DI, Tan JMJ, Kim J, Yeomans JS. Muscarinic control of rostromedial tegmental nucleus (RMTg) GABA neurons and morphine-induced locomotion. Soc Neurosci. 2014 doi: 10.1111/ejn.13237. Abstr 364.02. [DOI] [PubMed] [Google Scholar]
- Wasserman DI, Wang HG, Rashid AJ, Josselyn SA, Yeomans JS. Cholinergic control of morphine-induced locomotion in rostromedial tegmental nucleus versus ventral tegmental area sites. Eur J Neurosci. 2013;38:2774–2785. doi: 10.1111/ejn.12279. [DOI] [PubMed] [Google Scholar]
- White FJ. Synaptic regulation of mesocorticolimbic dopamine neurons. Ann Rev Neurosci. 1996;19:405–436. doi: 10.1146/annurev.ne.19.030196.002201. [DOI] [PubMed] [Google Scholar]
- Willins DL, Wallace LJ, Miller DD, Uretsky NJ. alpha-Amino-3-hydroxy-5-methylisoxazole-4-propionate/kainate receptor antagonists in the nucleus accumbens and ventral pallidum decrease the hypermotility response to psychostimulant drugs. J Pharmacol Exp Ther. 1992;260:1145–1151. [PubMed] [Google Scholar]
- Wise RA. Dopamine, learning and motivation. Nature Rev Neurosci. 2004;5:483–494. doi: 10.1038/nrn1406. [DOI] [PubMed] [Google Scholar]
- Yetnikoff L, Chang AY, Schwartz ZM, Parsley KP, Zahm DS. Differences in numbers of neurons projecting to the ventral tegmental area and rostromedial tegmental nucleus from key structures in the reward/aversion network. Soc Neurosci. 2013 Abstr 393.07. [Google Scholar]
- Yetnikoff L, Lavezzi HN, Reichard RA, Zahm DS. An update on the connections of the ventral mesencephalic dopaminergic complex. Neuroscience. 2014a;282C:23–48. doi: 10.1016/j.neuroscience.2014.04.010. [DOI] [PMC free article] [PubMed] [Google Scholar]
- Yetnikoff L, Reichard RA, Schwartz ZM, Parsely KP, Zahm DS. Protracted maturation of forebrain afferent connections of the ventral tegmental area in the rat. J Comp Neurol. 2014b;522:1031–1047. doi: 10.1002/cne.23459. [DOI] [PMC free article] [PubMed] [Google Scholar]
- Zahm DS. The evolving theory of basal forebrain functional-anatomical 'macrosystems'. Neurosci Biobehav Rev. 2006;30:148–172. doi: 10.1016/j.neubiorev.2005.06.003. [DOI] [PubMed] [Google Scholar]
- Zahm DS, Arends JJA, Parsley KP, Geisler S. Projection to the mesopontine rostromedial tegmental nucleus from the lateral preoptic area. Soc Neurosci. 2011a Abstr 79.09. [Google Scholar]
- Zahm DS, Cheng AY, Lee TJ, Ghobadi CW, Schwartz ZM, Geisler S, Parsely KP, Gruber C, Veh RW. Inputs to the midbrain dopaminergic complex in the rat, with emphasis on extended amygdala-recipient sectors. J Comp Neurol. 2011b;519:3159–3188. doi: 10.1002/cne.22670. [DOI] [PMC free article] [PubMed] [Google Scholar]
- Zahm DS, Grosu S, Williams EA, Qin S, Berod A. Neurons of origin of the neurotensinergic plexus enmeshing the ventral tegmental area in rat: retrograde labeling and in situ hybridization combined. Neuroscience. 2001;104(3):841–851. doi: 10.1016/s0306-4522(01)00118-x. [DOI] [PubMed] [Google Scholar]
- Zahm DS, Heimer L. Specificity in the efferent projections of the nucleus accumbens in the rat: comparison of the rostral pole projection patterns with those of the core and shell. J Comp Neurol. 1993;327:220–232. doi: 10.1002/cne.903270205. [DOI] [PubMed] [Google Scholar]
- Zahm DS, Jensen SL, Williams ES, Martin JR., 3rd Direct comparison of projections from the central amygdaloid region and nucleus accumbens shell. Eur J Neurosci. 1999;11:1119–1126. doi: 10.1046/j.1460-9568.1999.00524.x. [DOI] [PubMed] [Google Scholar]
- Zahm DS, Parsley KP, Schwartz ZM, Cheng AY. On lateral septum-like characteristics of outputs from the accumbal hedonic “hotspot” of Pecina and Berridge with commentary on the transitional nature of basal forebrain “boundaries”. J Comp Neurol. 2013;521:50–68. doi: 10.1002/cne.23157. [DOI] [PMC free article] [PubMed] [Google Scholar]
- Zahm S, Schwartz ZM, Lavezzi HN, Yetnikoff L, Parsley KP. Comparison of the locomotor-activating effects of bicuculline infusions into the preoptic area and ventral pallidum. Brain Struct Funct. 2014;19:511–526. doi: 10.1007/s00429-013-0514-x. [DOI] [PMC free article] [PubMed] [Google Scholar]