

Abstract
Recent studies have demonstrated that neural stem cell (NSC) culture at physiologically normoxic conditions (2-5% O2) is advantageous in terms of neuronal differentiation and survival. Neuronal differentiation is accompanied by a remarkable shift to mitochondrial oxidative metabolism compared to preferentially glycolytic metabolism of proliferating cells. However, metabolic changes induced by growth in a normoxic (5%) O2 culture environment in NSC have been minimally explored. In this study we demonstrate that culturing under 5% O2 resulted in higher levels of mitochondrial oxidative metabolism, decreased glycolysis, and reduced levels of reactive oxygen species (ROS) in NSC cultures. Inflammation is one of the major environmental factors limiting post-injury NSC neuronal differentiation and survival. Our results show that NSC differentiated under 5% O2 conditions possess better resistance to in vitro inflammatory injury compared to ones exposed to 20% O2. The present work demonstrates that lower, more physiologically normal O2 levels support metabolic changes induced during NSC neuronal differentiation and provide increased resistance to inflammatory injury, thus highlighting O2 tension as an important determinant of cell fate and survival in various stem cell therapies.
Keywords: neurogenesis, mitochondria, metabolism, oxygen, stem cell
Graphical abstract
Introduction
NSCs are multipotent precursor cells residing in specialized areas of fetal and adult CNS. They possess life-long self-renewal potential and the ability to differentiate into neurons, astrocytes, and oligodendrocytes. When propagated in vitro, they form free-floating neurospheres and demonstrate the same features of self-renewal and differentiation. These cells are the focus of intense study for their potential use in brain injury and neurodegenerative diseases. Though endogenous NSCs contribute to spontaneous recovery after brain damage, their contribution to recovery is limited by several factors, particularly by low survival rates (Popa-Wagner et al. 2011; Romanko et al. 2004). Thus an important goal is to improve survival of NSCs to increase the potential for neuroregeneration by both endogenous and transplanted exogenous NSCs. The ability of NSCs to differentiate into neurons, and the survival of the newly produced neurons are determined by a complex interplay between extracellular environment and intrinsic machinery (De Filippis and Delia 2011; Panchision et al. 1998; Pereira et al. 2013; Vescovi et al. 1999).
Mitochondrial function has been shown to be an important determinant of the differentiation fate of NSCs (Candelario et al. 2013; Pereira et al. 2013; Steib et al. 2014; Wang et al. 2011; Zhang et al. 2012). It has also been shown that neurons at the early stages of differentiation are particularly vulnerable to mitochondrial inhibition (Voloboueva et al. 2010). In our earlier study we demonstrated that young doublecortin positive (Dcx+) neurons demonstrated higher vulnerability towards mitochondrial inhibition than glia or even mature neurons. In line with this, the protection of mitochondrial function with a variety of mitochondria-protective compounds attenuated inflammation-associated loss of Dcx+ cells both in vivo and in vitro (Voloboueva et al. 2010). NSC differentiation involves a strong increase in mitochondrial oxidative metabolism (Wang et al. 2010; Zhang et al. 2012). While the increased mitochondrial metabolism is essential for cellular energetics, it can also result in excessive ROS production eventually leading to damage of mitochondrial DNA and compromised mitochondrial function.
In the settings of neurodegenerative disease and brain injury, inflammation is appreciated to be one of the major factors determining cellular survival and overall damage (Gao and Hong 2008; Perry and Holmes 2014; Streit et al. 2004). Importantly, inflammation strongly modulates NSC differentiation fate and survival of newly generated neurons (Mathieu et al. 2010; Monje et al. 2003; Voloboueva et al. 2010; Wong et al. 2004). One of the major targets of inflammation injury is cellular mitochondria. Several interrelated mechanisms contribute to mitochondrial inflammatory injury. A major proinflammatory cytokine TNF-α has been reported to suppress mitochondrial complexes I and IV (Samavati et al. 2008; Stadler et al. 1992; Zell et al. 1997). Inflammation markedly upregulates production of nitric oxide (NO), a potent inhibitor of mitochondrial complex IV (Brown and Borutaite 2001). Levels of reactive oxygen species (ROS) are markedly increased during inflammation, both through direct production and through IL-6 dependent mechanisms (Behrens et al. 2008; Inoue et al. 2003; Liu and Hong 2003). Increased ROS levels lead to impairment of mitochondrial function through oxidation of mitochondrial lipids, sulfhydryl groups, and iron-sulfur complexes within the mitochondrial respiratory enzymes (Halliwell 2006; Wagner et al. 1990).
It is well established in both experimental and clinical settings that oxygen tension is one of the major factors influencing NSC differentiation (De Filippis and Delia 2011; Santilli et al. 2010). The physiological oxygen concentration in tissues is markedly lower than the 20% found in the atmosphere. For example, in human brain oxygen tension ranges from 8% close to the surface down to less than 1% in the midbrain (Erecinska and Silver 2001). It has been shown that physiological levels of oxygen (2.5-5% O2) typical for neural tissues suppresses astrogliosis and promotes differentiation into the neuronal lineage in vitro (De Filippis and Delia 2011; Storch et al. 2001; Studer et al. 2000). Despite the demonstrated connection between O2 tension and NSC differentiation fate, changes promoted in NSC metabolism during differentiation under physiological O2 tensions have not been well characterized. The purpose of this study was to characterize metabolic changes induced in NSCs by physiologically relevant 5% oxygen tension. We also investigated whether NSC cultures differentiated under 5% O2 tension would demonstrate better survival during mitochondrial inhibition and in vitro inflammatory injury, both conditions relevant for young neuron survival during post-injury neurogenesis.
Materials and Methods
Cell culture
Neural precursor cells were isolated from newborn mice. The brains were removed, freed of meninges, and diced with a sterile razor blade in dissociation buffer [DMEM containing 2.5 U/ml papain, 250 U/ml DNase I (Worthington, Lakewood, NJ), and 1 U/ml Dispase II (Roche Diagnostics, Indianapolis, IN)]. After a 1 hr incubation, the cells were washed twice with DMEM and once with DMEM supplemented with 10% fetal bovine serum (FBS) (HyClone, Logan, UT). The cells were resuspended in growth medium, Neurobasal A (Gibco, Grand Island, NY), with 2 mM L-glutamine, 100 U/ml penicillin, and 100 ug/ml streptomycin (Gibco), B-27 without vitamin A (Gibco), 20 ng/ml fibroblast growth factor-2 (Peprotech, Rocky Hill, NJ), and 20 ng/ml epidermal growth factor (Peprotech), and plated at a density of 1 brain per six-well plate. Neural precursor cells proliferated and started to form neurospheres in 2-3 days. Neural precursor cells were induced to differentiate by plating dissociated neurospheres in laminin-coated 24-well plates and 35mm dishes (the plates were coated with 10 ug/well laminin (Gibco) in dH2O for 2–3 hr, and rinsed twice with dH2O). The floating neurospheres were collected after passage through a 70 μm cell strainer (BD Biosciences, Bedford, MA) by centrifugation at 400 g for 5 min, 4°C. The cell pellet was gently triturated with a 200 μl pipette tip 15-20 times, resuspended in a small volume of differentiation medium, Neurobasal A, B27 (Gibco), 1% FBS, 1 ng/ml fibroblast growth factor-2 (Peprotech), 10 ng/ml brain-derived neurotrophic factor (Peprotech), and 10 ng/ml neurotrophic factor-3 (Peprotech). The cells were plated onto laminin-coated 24-well plates or 35 mm dishes at a density of 200,000 cells/mL. One-half of the differentiation medium was changed every 2 days. Cells were grown in either 20% O2 or 5% O2 incubators. Cells were allowed to differentiate for different times depend on the experiment. For the microglial conditioned media (CM) experiments (see below), the cells were allowed to differentiate for 8 days before the 24 hr CM exposure.
Tri-Gas Incubators
Cells were incubated at two levels of incubator oxygen. Five percent incubator oxygen tensions were maintained in a Sanyo MCO-175M O2/CO2 incubator (Sanyo Scientific, Bensenville, IL). Gas phase O2 tensions were controlled by regulated injection of medical grade N2 to reach the target oxygen level. Cells cultured at atmospheric oxygen levels (20% O2) were incubated in a standard incubator without additional supply of nitrogen. CO2 levels were maintained at 5% in all cases.
BV-2 cells and CM
BV-2 murine microglia were plated on uncoated plastic tissue culture plates and grown in DMEM supplemented with 10% FBS, and 100 U/ml penicillin and 100 ug/ml streptomycin. BV-2 cells were placed in with fresh differentiation medium with added lipopolysaccharide (LPS) (1 μg/ml; Sigma, St Louis, Missouri) for 6-8 hr to prepare CM from activated microglia. The medium was collected, sterile filtered, and applied to neural progenitor cells as described above.
Mitochondrial inhibition
Cells were allowed to differentiate for 6 days and treated with 2 μM Antimycin A or 300 pg/mL TNF-α (410-MT, R&D Systems, Minneapolis, MN) for 24 hr in either the 20% or 5% O2 incubator.
Lactate measurements
The lactate measurements were performed as previously described (Voloboueva et al. 2013) with some modifications. Briefly, the cells were rinsed once with serum-free DMEM media, then incubated with 300 μL DMEM/well under 5% or 20% O2 for 2.5 hours. Afterwards, the media were collected, and lactate levels were measured using the Lactate Assay Kit (Biovision Research, Mountain View, CA). Cell lysate protein concentrations were measured with the BCA protein assay reagent kit (Pierce, Rockford, IL).
CellROX green measurements
Cells were incubated with the ROS sensitive dye CellROX green (5 μM final concentration) (Life Technologies C10444) to compare ROS levels in NSC cells cultured under different O2 tensions. After 30 min incubation with CellROX green under the relevant oxygen tension the cells were briefly rinsed and fixed with 4% paraformaldehyde (PFA) for 30 minutes according to the manufacturer's instructions. The CellROX green fluorescence was visualized with an epifluorescence microscope (Zeiss Axiovert LSM510; Carl Zeiss, Göttingen, Germany), and images were obtained on a Macintosh computer using Openlab software from Improvision Inc. (Lexington, MA, USA).
TUNEL assay for apoptosis
Cells were allowed to differentiate for 6 days and treated with 2 μM Antimycin A or 300 pg TNF-α for 5 h in 20% or 5% O2. After fixation, cells were washed three times with PBS, then incubated on ice with ice-cold 70% (V/V) ethanol for 30 min. Staining for apoptotic cells was performed using the in situ TUNEL assay kit (Abcam, Cambrige, MA, # ab66108) according to the manufacturer's instructions.
In vitro immunocytochemistry
Fluorescence immunocytochemistry was performed on cell cultures in 24-well plates and 35 mm dishes with glass bottoms. The cultures were washed with PBS and then fixed in 4% PFA for 30 min at room temperature. The cells were then washed twice with PBS and nonspecific binding was blocked with 5% normal horse serum, 0.1% Triton X100 in PBS for 1 hr. The cells were subsequently incubated with primary antibodies diluted in blocking buffer overnight at 4°C. For the detailed description of primary antibodies see the section Antibody Characterization below. Cells were subsequently incubated with the appropriate secondary Alexa Fluor 488- or 594-conjugated secondary antibodies (1:500; Gibco). Cell nuclei were counterstained with 4′-6′-diamidino-2-phenylindole (DAPI) (0.5 ug/ml; Sigma). The image areas were randomly selected, avoiding areas within one microscopic field of view from the edge, approximately 400 μm, and areas with either very low cell densities or very clustered nuclei. The immunofluorescence was visualized with an epifluorescence microscope (Zeiss Axiovert LSM510; Carl Zeiss, Göttingen, Germany), and images were obtained on a Macintosh computer using Openlab software (Improvision Inc., Lexington, MA, USA, RRID: rid_000096).
Antibody Characterization
To label immature neurons we used a Dcx cell specific polyclonal goat antibody (1:500; Santa Cruz Biotechnology, Cat# sc-8066, RRID: AB_2088494). In our previous studies this antibody demonstrated the appropriate pattern of staining and morphology of neuroblasts in the neurogenic region of dentate gyrus in vivo, of immature neurons in NSC cultures in vitro (Voloboueva et al. 2010).
A polyclonal rabbit antibody against glial fibrillary acid protein (GFAP), an intermediate filament protein, was used to stain astrocytes (1:3; Immunostar, Cat# 22522, RRID: AB_572240). This antibody demonstrated appropriate pattern of astrocyte staining in the CA1 region of dentate gyrus and co-localization with other astrocytic markers in primary astrocytic cultures (Ouyang et al. 2007).
A polyclonal rat antibody against NG2 was used for immature oligodendrocytes (1:400; Millipore Bioscience Research Reagents, Cat# AB5320, RRID: AB_91789). The morphology of NG2 staining corresponded to the regular oligodendrocyte morphology in differentiated stem cell cultures reported previously (Stacpoole et al. 2013a).
A polyclonal rabbit antibody against microtubule associated protein 2 (MAP2) was used as a marker for mature neurons (1:400; Millipore Bioscience Research Reagents, Cat# AB5622, RRID: AB_91939). The morphology of MAP2 staining corresponded to the regular neuronal morphology in differentiated neural cell cultures reported previously (Smith et al. 2009; Voloboueva et al. 2010).
Live imaging
To monitor changes in mitochondrial membrane potential, cells were incubated with the mitochondrial membrane potential sensitive dye tetramethylrhodamine ethyl ester (TMRE) (50 nM).
Imaging Chamber
Cells were imaged on the stage of an inverted microscope in a chamber equipped for atmospheric control. Briefly, cells were plated on poly-d-lysine coated glass-bottomed 35 mm microwell dishes (#P35GC-1.0-14-C, MatTek Corporation, Ashland, MA) and placed in an atmospherically sealed imaging chamber (Uno-Plus Microscope Stage Incubator Model H301-EC-BL, Okolab, Ottaviano, Italy). Cells were maintained at either 20% or 5% ambient PO2 by constant flow (2 L/min) of heated and humidified pre-mixed gases containing either 20% O2/5% CO2/bal N2 or 5% O2/5% CO2/bal N2, and verified by an optical O2 sensing system (NeoFox-GT phase fluorimeter, Ocean Optics, Jasper GA). Ambient gas and chamber temperature were measured and maintained at 37°C with an Okolab H301-T-UNIT-BL-PLUS thermal controller with heating elements in the body and lid of the imaging chamber, and in the gas humidifier.
Statistics
All statistical analyses were performed in the GraphPad Prism 6.0 (GraphPad Software, LaJolla, CA, RRID: nif-0000-30467). Statistical differences between two groups of data were determined using unpaired two-tailed Student's t-test. If three or more groups of data were analyzed, oneway ANOVA followed by Bonferroni's multiple comparison test was performed. P≤0.05 was considered statistically significant. Data in all plots are pooled from three independent experiments, with the number of independent samples or cells/experiment indicated in the figure legends. Results are presented as mean±SD.
Results
Effects of 5% O2 tension on NSC differentiation and metabolism
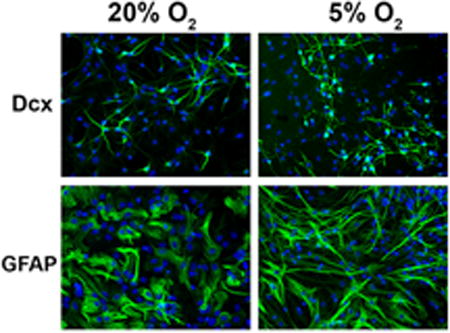
In the first set of experiments we evaluated the effect of 5% O2 tension on cell-specific differentiation of NSCs. Because it has been reported that lower oxygen tension promotes neuronal differentiation (De Filippis and Delia 2011), we used two neuronal markers, doublecortin (Dcx) to label young neuroblasts, and MAP2, for more mature neuronal cells, and GFAP staining as a marker of differentiated astrocytes. Fig. 1A demonstrates that NSCs cultured for 8 days under 5% O2 demonstrate significantly increased percentages of both Dcx+ and MAP2+ cells. On the other hand, there was no significant change in the percentage of glial GFAP+ cells. Of note, while we did not observe significant changes in numbers, the astrocytes cultured under 5% O2 demonstrated more fibrous morphology with elongated processes that better correspond to in vivo astrocyte morphology. We also observed a significant 31% increase in the number of oligodendrocyte precursor NG2+ cells in cultures under 5% O2 conditions, in accordance with previous observations (Stacpoole et al. 2013b). To identify oligodendrocytes at later stages of differentiation we performed staining with the oligodendrocyte marker O4. We observed almost complete overlap of NG2 and O4 staining (less than 2% difference) in our NSC cultures at the end of 8 days differentiation (data not shown). Fig. 1B shows the quantification of the fraction of different cell types for 5% and 20% O2 conditions. Cells that were not MAP+, Dcx+, GFAP+, or NG2+ remained undifferentiated. Fig. 1C shows that 5% O2 tension also promoted a significant 34% increase in the total cell number.
Figure 1.
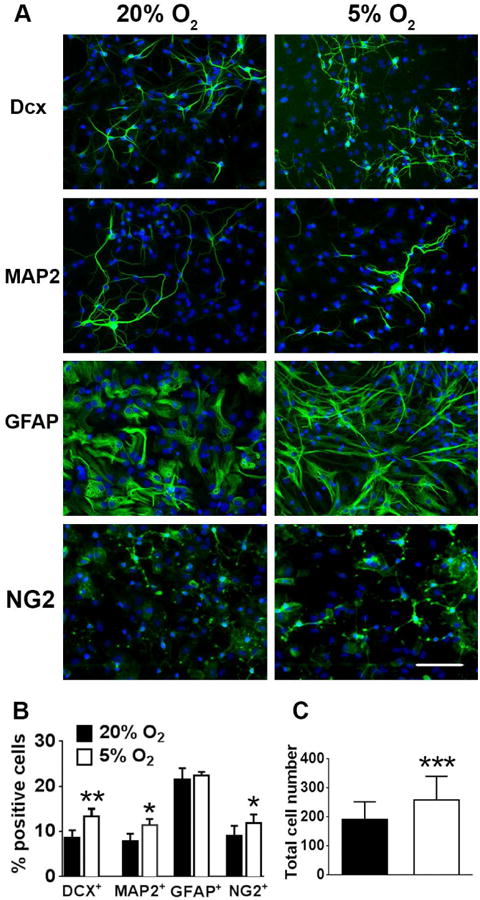
5% O2 increases neuronal differentiation. (A) NSC cultures differentiated under 5% O2 demonstrated higher levels of neuronal differentiation as indicated by neuronal markers Dcx (young neurons) and MAP2 (mature neurons), without significant changes in GFAP glial staining (nuclei are labeled with DAPI (blue), Dcx+, MAP2+, GFAP+ and NG2+ cells are green). Quantification of and the percentage of neuronal Dcx+ and MAP2+ and glial cells (B) the total cell density (per 300×400 μm field of view) (C). The data show three independent experiments, with at least 500 total analyzed cells in each experiment (**p=0.062 for Dcx+, *p=0.014 for MAP2+, *p=0.04 for NG2+, ***p<0.001 for total cell number compared to the corresponding cell type or total cell number at 20% O2, calculated by unpaired t-test).
Metabolic changes induced by growth in 5% O2
We next investigated metabolic changes induced by 5% O2. Since different cell types have very different metabolic signatures, we performed metabolic studies at early stages of differentiation, 2-3 days after plating in the differentiation media when the effects of differential cellular composition are minimized. Fig. 2 shows the representative images and quantification of mitochondrial staining with MitoTracker Green, a mitochondrial marker not sensitive to mitochondrial potential, and TMRE, a mitochondrial membrane potential sensitive marker. While 5% O2 conditions did not promote significant changes in the mitotracker intensity that corresponds to the total mitochondrial mass, the decreased O2 resulted in significantly higher intensity of TMRE staining. These results are indicative of higher mitochondrial energetics of the NSC cultured under 5% O2 conditions (Nicholls and Ward 2000). We next compared lactate production as a measure of glycolytic activity (Winkler et al. 2003). Fig. 3A indicates that NSC cultured under 5% O2 had significantly lower rates of lactate production compared to cells cultured under 20% O2. The observed shift from glycolytic to mitochondrial metabolism of the NSC exposed to 5% could potentially promote higher levels of ROS production, a toxic byproduct of mitochondrial activity. We used a ROS sensitive dye Cytox green to compare ROS levels in NSC cells cultured under different O2 tensions. Fig 3B demonstrates that 5% O2 conditions actually resulted in decreased levels of ROS production, despite the higher mitochondrial activity.
Figure 2.
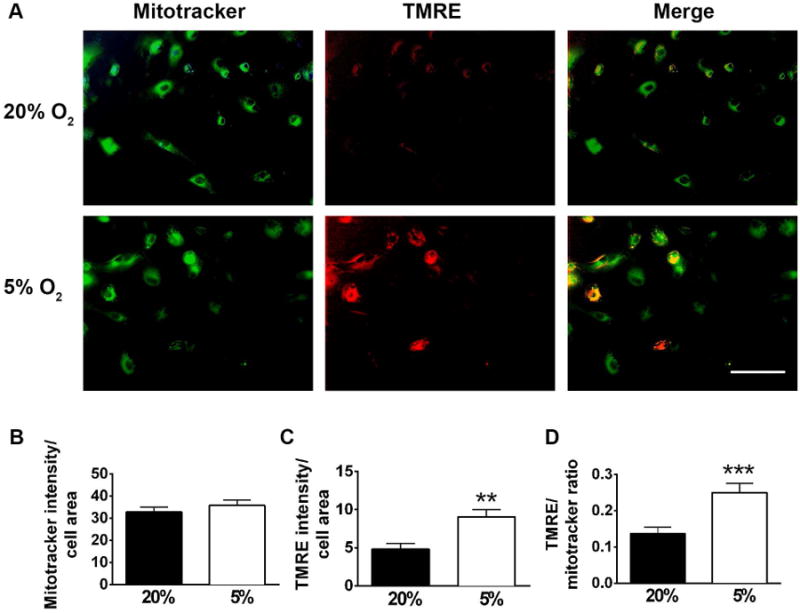
Mitochondrial changes induced by low oxygen. 5% O2 conditions did not promote significant changes in mitotracker staining (green), but induced significant increase in mitochondrial potential sensitive dye TMRE (Fig. 2A) indicating higher mitochondrial energetics. Quantification of mitotracker intensity (B), TMRE intensity (C) and TMRE/mitotracker ratio (D). The data show three independent experiments, with at least 10 fields of view in each experiment (**p<0.0014, ***p=0.0006 compared to 20% O2, calculated by unpaired t-test).
Figure 3.
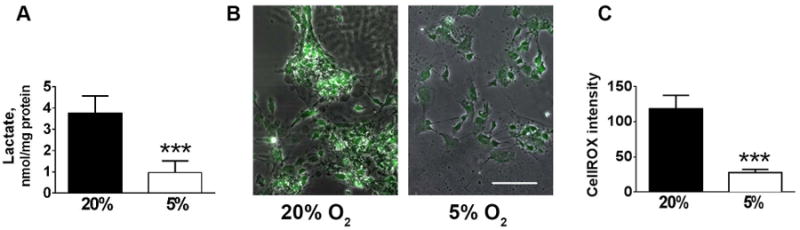
Changes in glycolysis and oxidative stress induced by 5% O2. Culturing under low oxygen promoted decrease in glycolytic rates as evidenced by decreased rates of lactate production (A), and decrease in ROS levels as indicated by Cytox staining. Representative images of Cytox staining (B). Quantification of Cytox staining (C) The data show three independent experiments, with 2-3 independent samples per experiment (***p<0.001 compared to 20% O2, calculated by unpaired t-test).
Effect of in vitro inflammation injury on NSC under 5% and 20% O2
We investigated the effect of microglial conditioned media (CM) which contains pro-inflammatory mediators to model in vitro the effect of inflammation on the survival of neuroblasts identified as Dcx+ cells under 5% and 20% O2. Dcx+ cells are particularly vulnerable to inflammation injury, compared to glia and even mature neurons (Voloboueva et al. 2010). Also levels of Dcx expression can be used as a reliable and specific marker of neurogenesis (Couillard-Despres et al. 2008). Fig. 4 A, B indicates that CM treatment promoted significant 40% loss of Dcx staining in 20% cultured NSC, and this loss was attenuated to 31% in 5% O2 cultured NSC. CM treatment did not induce significant changes in the number of total cells under either 5% or 20% O2 (Fig. 4C), though there were non-significant trends corresponding to the Dcx+ changes. We next exposed NSC to physiological concentrations of purified TNF-α, a major proinflammatory cytokine (Feuerstein et al. 1994). Fig 5A, B demonstrate that similar to CM, TNF-α treatment promoted loss of Dcx+ cells in 20% O2 cultures, and this loss was attenuated in 5% O2 treated cultures. TNF-α treatment did not induce significant changes in the number of total cells under either 5% or 20% O2 (Fig 5C).
Figure 4.
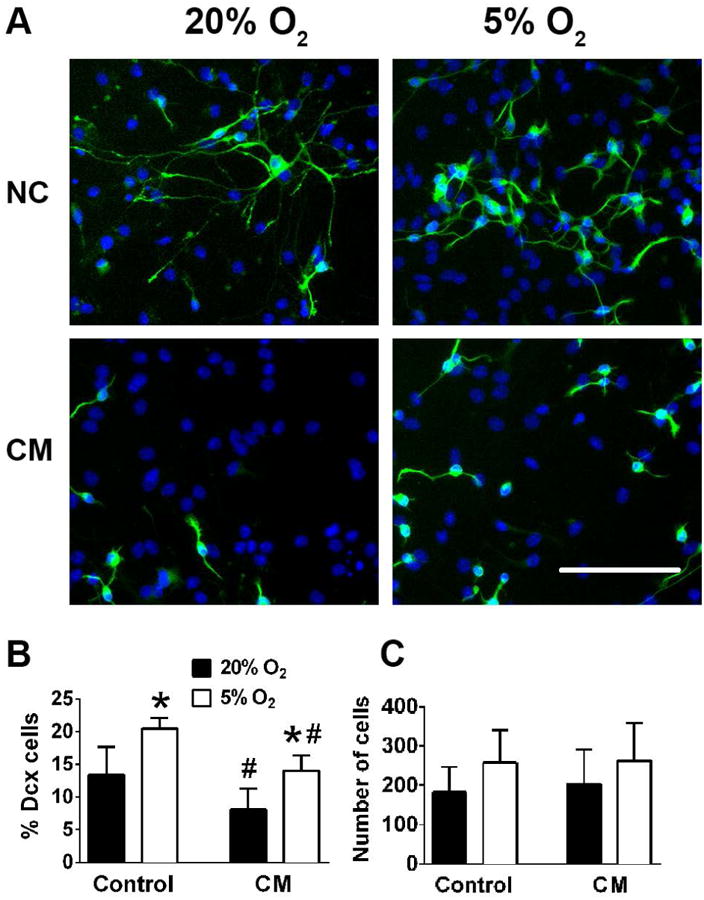
The effect of 5% O2 on Dcx+ cell survival during CM in vitro inflammatory injury. Representative changes of normal control (NC) and CM treated cultures. Nuclei are labeled with DAPI (blue), Dcx+, cells are green (A). Quantification of Dcx+ cells (B) and total cell numbers (C). The data show three independent experiments with at least 500 total analyzed cells in each experiment (*p<0.05 ANOVA compared to 20% O2, #p<0.05 ANOVA compared to the corresponding control condition).
Figure 5.
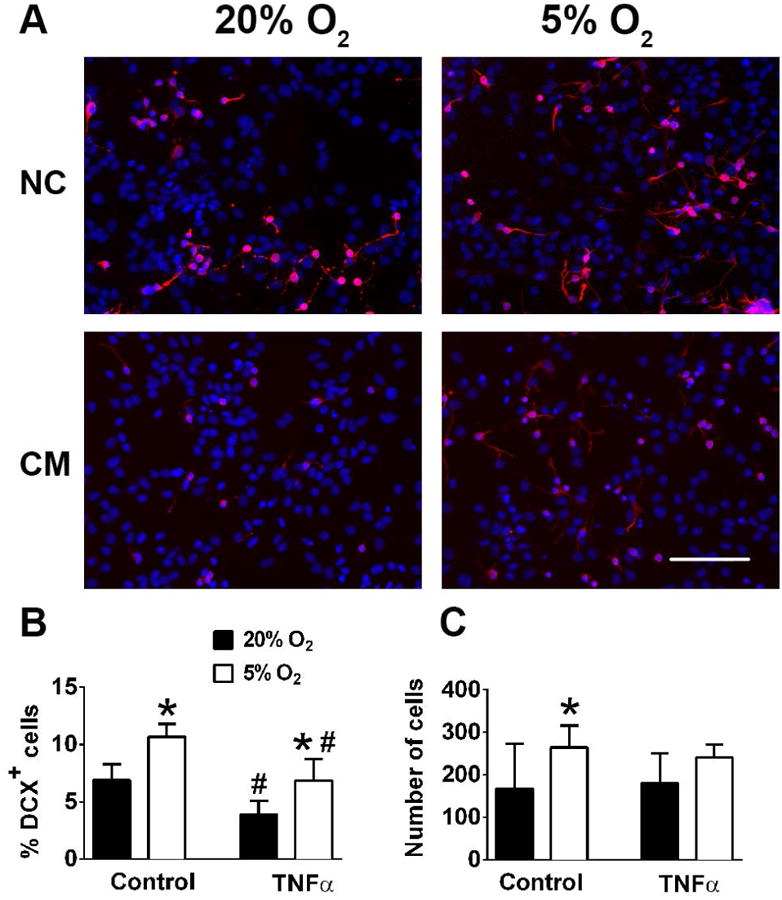
The effect of 5% O2 on Dcx+ cell survival during TNF-α inflammatory injury. Representative changes of normal control (NC) and TNF-α treated cultures. Nuclei are labeled with DAPI (blue), Dcx+, cells are red (A). Quantification of Dcx+ cells (B) and total cell numbers (C). The data show three independent experiments with at least 500 total analyzed cells in each experiment (*p<0.05 ANOVA compared to 20% O2, #p<0.05 ANOVA compared to the corresponding control condition).
Effect of mitochondrial inhibition on apoptotic rates and mitochondrial potential under 5% and 20% O2
Because it has been demonstrated that mitochondrial function is a major target of inflammatory injury, we next investigated the effect of the mitochondrial inhibitor antimycin A on Dcx+ cell survival, apoptotic rates and mitochondrial function. Fig. 6 A-C demonstrate that antimycin A treatment strongly reduced the number of Dcx+ cells in NSC cultured in 20% O2, and this loss was significantly smaller in 5% O2 cultured NSCs. Since low oxygen conditions also promoted significant increase in the number of NG2+ oligodendrocyte precursor cells, we also studied the effect of mitochondrial inhibition on the viability of NG2+ cells. Antimycin A treatment promoted a 46% loss (p<0.001) in NG2+ cells cultured in 20% O2, compared to a 21% loss (p<0.05) in NG2+ cells cultured in 5% O2. Fig. 6 D, E demonstrate that apoptotic rates after antimycin A exposure were significantly higher under 20% compared to 5% O2 conditions. Fig. 6F demonstrates the time course of loss of mitochondrial TMRE staining of NSC treated by TNF-α and antimycin A in cells grown at 20% O2, while the cells grown at 5% O2 do not show significant reductions over this timecourse. These results indicate the importance of mitochondrial function in the survival of young neurons, and emphasize the significant improvement in mitochondrial function induced by 5% O2 treatment.
Figure 6.
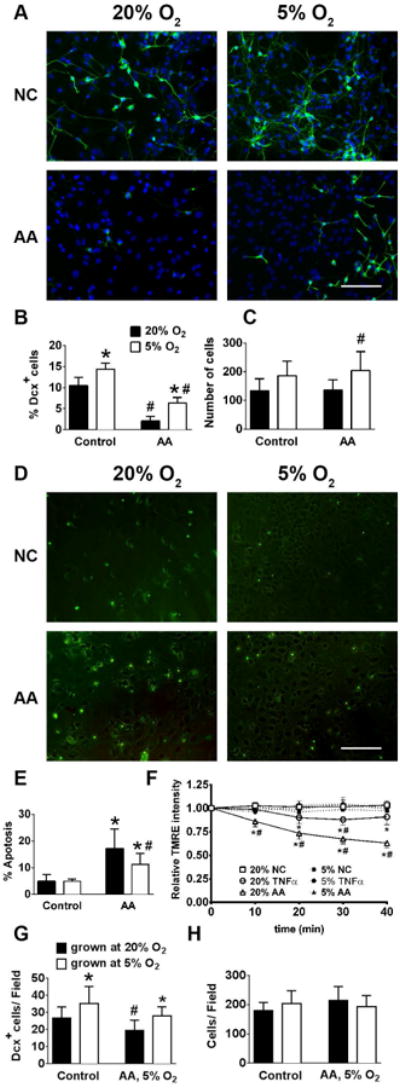
5% O2 increases Dcx+ survival, suppresses apoptotic rates and protects mitochondrial function during antimycin A treatment. Representative images Dcx+ staining in normal control (NC) and Antimycin A (AA) treated cultures (nuclei are labeled with blue DAPI, Dcx+ cells are green) (A). Quantification of Dcx+ cells (B) and total cell numbers (C). Representative images of TUNEL staining in control and Antimycin A (AA) treated cultures (TUNEL+ cells are green) (D). Quantification of apoptotic staining (E). Time course of mitochondrial TMRE intensity in control, TNF-α and antimycin A (AA) treated cultures (F). Quantification of survival of Dcx+ cells (G) and total cell numbers (H) of NSC cultures grown at 20% O2 or 5% O2, and shifted to 5% O2 for the antimycin A treatment. The data show three independent experiments with at least 500 total analyzed cells in each experiment (*p<0.05 ANOVA compared to 20% O2, #p<0.05 ANOVA compared to the corresponding control condition).
The potential therapeutic use of NSCs involves their transplantation into damaged areas of the central nervous system which would generally have physiological O2 levels. We investigated whether culturing under 5% O2 compared to culturing at 20% O2 results in better survival of Dcx+ cells when mitochondrial impairment was performed at physiological 5% O2, to model the condition of transplantation into brain. NSC were cultured and differentiatiated at 20% or 5% O2, and then placed into 5% O2 during the 24 hour antimycin A exposure. Fig.6G shows that cells cultured and differentiated under 5% O2 experienced only 20% loss of Dcx cells compared to 29% Dcx loss in cultures grown under 20% O2, while no significant changes in total cell numbers were observed (Fig. 6H).
Discussion
Traditional in vitro cell culture systems have used O2 tensions that are quite different from the in vivo situations, and this is particularly true for CNS cells (Silver and Erecinska 1998). NSC transplantation therapies for various neurodegenerative diseases have been proposed by different studies (Brundin et al. 2010; Cova et al. 2004; Smith and Gavins 2012), however approaches are limited by a number of factors, including both the availability of the transplant material and cell survival following transplantation. Several studies showed that cell culture at physiological O2 tensions that correspond to measured levels in brain (1%-5% O2) promotes NSC proliferation, survival, and neuronal differentiation (Chen et al. 2007; Morrison et al. 2000; Stacpoole et al. 2011; Studer et al. 2000). However, the metabolic, particularly mitochondrial mechanisms of the physiological O2-associated changes in NSCs have been minimally explored. Mitochondria are emerging as key regulators of NSC differentiation and survival (Lonergan et al. 2007; Nesti et al. 2007; Parker et al. 2009; Pereira et al. 2013). That stem cell differentiation involves a glycolytic to oxidative metabolic transition is now appreciated. This transition involves an increment in mitochondrial mass, with a concomitant increase of mitochondrial function, as well as a decrease in lactate production (Cho et al. 2006; Chung et al. 2010; Siggins et al. 2008; St John et al. 2005). Furthermore, mitochondrial impairment associated with mtDNA mutations or mitochondrial inhibitors preclude neuronal differentiation (Kirby et al. 2009; Pereira et al. 2013; Vayssiere et al. 1992; Wang et al. 2011).
In our experiments we observed that physiological 5% O2 conditions resulted in significantly higher rates of neuronal differentiation compared to a hyperoxic 20% O2 environment, in accordance with previous studies. We did not observe significant changes in mitochondrial mass, but mitochondrial bioenergetics was significantly higher in NSCs cultured under 5% O2 conditions and rates of lactate production were significantly lower in NSCs cultured in physiological O2. It has been demonstrated that neuronal differentiation is accompanied by increased ROS levels (Le Belle et al. 2011; Wang et al. 2011; Xavier et al. 2014). It has also been shown that suppression of the differentiation-induced ROS levels is beneficial for NSC differentiation, particularly due to protection of mitochondria which are readily damaged by ROS (Xavier et al. 2014). In our studies NSCs cultured under 5% O2 demonstrated remarkably lower ROS levels compared to 20% O2 suggesting that 5% O2 conditions result in lower differentiation-induced ROS mitochondrial damage, despite increased oxidative metabolism.
A variety of environmental factors determine NSC survival, differentiation and integration into the host nervous system. Among those factors inflammation is considered as one of the crucial factors determining the fate of both endogenous and transplanted NSCs (Borsini et al. 2015; Mathieu et al. 2010; Monje et al. 2003; Wong et al. 2004). In our experiments we used two in vitro models of inflammation, the microglial CM model (Monje et al. 2003; Voloboueva et al. 2010), and a more defined TNF-α exposure model. Both CM and TNF-α exposures promoted significant loss of young Dcx+ neurons, but the loss was significantly attenuated in NSC cultured under 5% O2. TNF-α exposure also promoted significant loss of mitochondrial potential in NSCs cultured in 20% O2 but not in 5% O2. Direct exposure to the mitochondrial inhibitor antimycin A resulted in significantly smaller decrease in mitochondrial potential, and correspondingly lower rates of apoptosis and neuronal loss in NSCs cultured in 5% O2 compared to 20% O2. Impairment of mitochondrial function induces conversion of cell mitochondria to apoptosis promoting organelles (Xavier et al. 2014). Our results suggest that improved mitochondrial function associated with physiological 5% O2 is responsible for the lower rates of apoptosis and neuronal death in NSC cultures. Since 5% O2 more realistically represents the in vivo NSC environment, our findings of changed NSC injury response under this physiological oxygen tension compared to 20% oxygen is also important for in vitro disease modelling studies.
In summary, our physiological O2 culture condition NSC differentiation experiments demonstrate that 5% O2 resulted in higher levels of mitochondrial oxidative metabolism, decreased glycolytic rates, accompanied by reduced ROS levels in differentiating NSC cultures. Importantly, these metabolic shifts corresponded to the greater robustness of NSC differentiated under physiological O2 conditions to in vitro inflammatory injury and direct mitochondrial impairment. Our findings support the notion that oxygen tension is an important factor that should be considered during NSC differentiation, affecting cell fate, metabolic regulation, and NSC robustness against inflammatory insult. Regulation of the environmental O2 levels is a key variable that should be considered when optimizing NSC and other cell types for cell-based therapies.
Significance Statement.
Neural stem cells (NSC) can differentiate into neurons, and are of great interest for potential use in neurodegenerative diseases, including stroke. Therapeutic use is limited by low neuroblast survival rates in the pathologic pro-inflammatory post-stroke environment. Oxygen tension is one of the major environmental factors determining NSC fate and survival. In this study we characterized metabolic changes induced in NSCs by culturing in physiologically relevant 5% oxygen. We demonstrate that NSCs cultured with 5% O2 demonstrate higher oxidative metabolism, less glycolysis, and better survival when subjected to inflammatory injury. Thus culture conditions can improve potential use of NSCs in stroke.
Acknowledgments
Support: The work was supported in part by NIH grants NS080177 and NS084396 to RGG
Footnotes
Role of authors: All authors had full access to all data in the study and take responsibility for the integrity of the data and the accuracy of the data analysis. Study concept and design: XS, LAV, RGG. Acquisition of data: XS, LAV, CMS. Analysis and interpretation of data: XS, LAV, CMS. Drafting of the manuscript: XS, LAV, RGG. Critical revision of the manuscript: RGG. Statistical analysis: XS, CMS, LAV. Obtained funding: RGG. Study supervision: RGG.
Conflict of interest statement: The authors declare no conflict of interest.
Literature cited
- Behrens MM, Ali SS, Dugan LL. Interleukin-6 mediates the increase in NADPH-oxidase in the ketamine model of schizophrenia. J Neurosci. 2008;28(51):13957–13966. doi: 10.1523/JNEUROSCI.4457-08.2008. [DOI] [PMC free article] [PubMed] [Google Scholar]
- Borsini A, Zunszain PA, Thuret S, Pariante CM. The role of inflammatory cytokines as key modulators of neurogenesis. Trends Neurosci. 2015 doi: 10.1016/j.tins.2014.12.006. [DOI] [PubMed] [Google Scholar]
- Brown GC, Borutaite V. Nitric oxide, mitochondria, and cell death. IUBMB Life. 2001;52(3-5):189–195. doi: 10.1080/15216540152845993. [DOI] [PubMed] [Google Scholar]
- Brundin P, Barker RA, Parmar M. Neural grafting in Parkinson's disease Problems and possibilities. Prog Brain Res. 2010;184:265–294. doi: 10.1016/S0079-6123(10)84014-2. [DOI] [PubMed] [Google Scholar]
- Candelario KM, Shuttleworth CW, Cunningham LA. Neural stem/progenitor cells display a low requirement for oxidative metabolism independent of hypoxia inducible factor-1alpha expression. J Neurochem. 2013;125(3):420–429. doi: 10.1111/jnc.12204. [DOI] [PMC free article] [PubMed] [Google Scholar]
- Chen HL, Pistollato F, Hoeppner DJ, Ni HT, McKay RD, Panchision DM. Oxygen tension regulates survival and fate of mouse central nervous system precursors at multiple levels. Stem Cells. 2007;25(9):2291–2301. doi: 10.1634/stemcells.2006-0609. [DOI] [PubMed] [Google Scholar]
- Cho YM, Kwon S, Pak YK, Seol HW, Choi YM, Park do J, Park KS, Lee HK. Dynamic changes in mitochondrial biogenesis and antioxidant enzymes during the spontaneous differentiation of human embryonic stem cells. Biochem Biophys Res Commun. 2006;348(4):1472–1478. doi: 10.1016/j.bbrc.2006.08.020. [DOI] [PubMed] [Google Scholar]
- Chung S, Arrell DK, Faustino RS, Terzic A, Dzeja PP. Glycolytic network restructuring integral to the energetics of embryonic stem cell cardiac differentiation. J Mol Cell Cardiol. 2010;48(4):725–734. doi: 10.1016/j.yjmcc.2009.12.014. [DOI] [PMC free article] [PubMed] [Google Scholar]
- Couillard-Despres S, Finkl R, Winner B, Ploetz S, Wiedermann D, Aigner R, Bogdahn U, Winkler J, Hoehn M, Aigner L. In vivo optical imaging of neurogenesis: watching new neurons in the intact brain. Mol Imaging. 2008;7(1):28–34. [PubMed] [Google Scholar]
- Cova L, Ratti A, Volta M, Fogh I, Cardin V, Corbo M, Silani V. Stem cell therapy for neurodegenerative diseases: the issue of transdifferentiation. Stem Cells Dev. 2004;13(1):121–131. doi: 10.1089/154732804773099326. [DOI] [PubMed] [Google Scholar]
- De Filippis L, Delia D. Hypoxia in the regulation of neural stem cells. Cell Mol Life Sci. 2011;68(17):2831–2844. doi: 10.1007/s00018-011-0723-5. [DOI] [PMC free article] [PubMed] [Google Scholar]
- Erecinska M, Silver IA. Tissue oxygen tension and brain sensitivity to hypoxia. Respir Physiol. 2001;128(3):263–276. doi: 10.1016/s0034-5687(01)00306-1. [DOI] [PubMed] [Google Scholar]
- Feuerstein GZ, Liu T, Barone FC. Cytokines, inflammation, and brain injury: role of tumor necrosis factor-alpha. Cerebrovasc Brain Metab Rev. 1994;6(4):341–360. [PubMed] [Google Scholar]
- Gao HM, Hong JS. Why neurodegenerative diseases are progressive: uncontrolled inflammation drives disease progression. Trends Immunol. 2008;29(8):357–365. doi: 10.1016/j.it.2008.05.002. [DOI] [PMC free article] [PubMed] [Google Scholar]
- Halliwell B. Oxidative stress and neurodegeneration: where are we now? J Neurochem. 2006;97(6):1634–1658. doi: 10.1111/j.1471-4159.2006.03907.x. [DOI] [PubMed] [Google Scholar]
- Inoue M, Sato EF, Nishikawa M, Park AM, Kira Y, Imada I, Utsumi K. Mitochondrial generation of reactive oxygen species and its role in aerobic life. Curr Med Chem. 2003;10(23):2495–2505. doi: 10.2174/0929867033456477. [DOI] [PubMed] [Google Scholar]
- Kirby DM, Rennie KJ, Smulders-Srinivasan TK, Acin-Perez R, Whittington M, Enriquez JA, Trevelyan AJ, Turnbull DM, Lightowlers RN. Transmitochondrial embryonic stem cells containing pathogenic mtDNA mutations are compromised in neuronal differentiation. Cell Prolif. 2009;42(4):413–424. doi: 10.1111/j.1365-2184.2009.00612.x. [DOI] [PMC free article] [PubMed] [Google Scholar]
- Le Belle JE, Orozco NM, Paucar AA, Saxe JP, Mottahedeh J, Pyle AD, Wu H, Kornblum HI. Proliferative neural stem cells have high endogenous ROS levels that regulate self-renewal and neurogenesis in a PI3K/Akt-dependant manner. Cell Stem Cell. 2011;8(1):59–71. doi: 10.1016/j.stem.2010.11.028. [DOI] [PMC free article] [PubMed] [Google Scholar]
- Liu B, Hong JS. Role of microglia in inflammation-mediated neurodegenerative diseases: mechanisms and strategies for therapeutic intervention. J Pharmacol Exp Ther. 2003;304(1):1–7. doi: 10.1124/jpet.102.035048. [DOI] [PubMed] [Google Scholar]
- Lonergan T, Bavister B, Brenner C. Mitochondria in stem cells. Mitochondrion. 2007;7(5):289–296. doi: 10.1016/j.mito.2007.05.002. [DOI] [PMC free article] [PubMed] [Google Scholar]
- Mathieu P, Battista D, Depino A, Roca V, Graciarena M, Pitossi F. The more you have, the less you get: the functional role of inflammation on neuronal differentiation of endogenous and transplanted neural stem cells in the adult brain. J Neurochem. 2010;112(6):1368–1385. doi: 10.1111/j.1471-4159.2009.06548.x. [DOI] [PubMed] [Google Scholar]
- Monje ML, Toda H, Palmer TD. Inflammatory blockade restores adult hippocampal neurogenesis. Science. 2003;302(5651):1760–1765. doi: 10.1126/science.1088417. [DOI] [PubMed] [Google Scholar]
- Morrison SJ, Csete M, Groves AK, Melega W, Wold B, Anderson DJ. Culture in reduced levels of oxygen promotes clonogenic sympathoadrenal differentiation by isolated neural crest stem cells. J Neurosci. 2000;20(19):7370–7376. doi: 10.1523/JNEUROSCI.20-19-07370.2000. [DOI] [PMC free article] [PubMed] [Google Scholar]
- Nesti C, Pasquali L, Vaglini F, Siciliano G, Murri L. The role of mitochondria in stem cell biology. Biosci Rep. 2007;27(1-3):165–171. doi: 10.1007/s10540-007-9044-1. [DOI] [PubMed] [Google Scholar]
- Nicholls DG, Ward MW. Mitochondrial membrane potential and neuronal glutamate excitotoxicity: mortality and millivolts. Trends Neurosci. 2000;23(4):166–174. doi: 10.1016/s0166-2236(99)01534-9. [DOI] [PubMed] [Google Scholar]
- Ouyang YB, Voloboueva LA, Xu LJ, Giffard RG. Selective dysfunction of hippocampal CA1 astrocytes contributes to delayed neuronal damage after transient forebrain ischemia. J Neurosci. 2007;27(16):4253–4260. doi: 10.1523/JNEUROSCI.0211-07.2007. [DOI] [PMC free article] [PubMed] [Google Scholar]
- Panchision D, Hazel T, McKay R. Plasticity and stem cells in the vertebrate nervous system. Curr Opin Cell Biol. 1998;10(6):727–733. doi: 10.1016/s0955-0674(98)80114-2. [DOI] [PubMed] [Google Scholar]
- Parker GC, Acsadi G, Brenner CA. Mitochondria: determinants of stem cell fate? Stem Cells Dev. 2009;18(6):803–806. doi: 10.1089/scd.2009.1806.edi. [DOI] [PubMed] [Google Scholar]
- Pereira SL, Graos M, Rodrigues AS, Anjo SI, Carvalho RA, Oliveira PJ, Arenas E, Ramalho-Santos J. Inhibition of mitochondrial complex III blocks neuronal differentiation and maintains embryonic stem cell pluripotency. PLoS One. 2013;8(12):e82095. doi: 10.1371/journal.pone.0082095. [DOI] [PMC free article] [PubMed] [Google Scholar]
- Perry VH, Holmes C. Microglial priming in neurodegenerative disease. Nat Rev Neurol. 2014;10(4):217–224. doi: 10.1038/nrneurol.2014.38. [DOI] [PubMed] [Google Scholar]
- Popa-Wagner A, Buga AM, Kokaia Z. Perturbed cellular response to brain injury during aging. Ageing Res Rev. 2011;10(1):71–79. doi: 10.1016/j.arr.2009.10.008. [DOI] [PubMed] [Google Scholar]
- Romanko MJ, Rola R, Fike JR, Szele FG, Dizon ML, Felling RJ, Brazel CY, Levison SW. Roles of the mammalian subventricular zone in cell replacement after brain injury. Prog Neurobiol. 2004;74(2):77–99. doi: 10.1016/j.pneurobio.2004.07.001. [DOI] [PubMed] [Google Scholar]
- Samavati L, Lee I, Mathes I, Lottspeich F, Huttemann M. Tumor necrosis factor alpha inhibits oxidative phosphorylation through tyrosine phosphorylation at subunit I of cytochrome c oxidase. J Biol Chem. 2008;283(30):21134–21144. doi: 10.1074/jbc.M801954200. [DOI] [PMC free article] [PubMed] [Google Scholar]
- Santilli G, Lamorte G, Carlessi L, Ferrari D, Rota Nodari L, Binda E, Delia D, Vescovi AL, De Filippis L. Mild hypoxia enhances proliferation and multipotency of human neural stem cells. PLoS One. 2010;5(1):e8575. doi: 10.1371/journal.pone.0008575. [DOI] [PMC free article] [PubMed] [Google Scholar]
- Siggins RW, Zhang P, Welsh D, Lecapitaine NJ, Nelson S. Stem cells, phenotypic inversion, and differentiation. Int J Clin Exp Med. 2008;1(1):2–21. [PMC free article] [PubMed] [Google Scholar]
- Silver I, Erecinska M. Oxygen and ion concentrations in normoxic and hypoxic brain cells. Adv Exp Med Biol. 1998;454:7–16. doi: 10.1007/978-1-4615-4863-8_2. [DOI] [PubMed] [Google Scholar]
- Smith DE, Lipsky BP, Russell C, Ketchem RR, Kirchner J, Hensley K, Huang Y, Friedman WJ, Boissonneault V, Plante MM, Rivest S, Sims JE. A Central Nervous System-Restricted Isoform of the Interleukin-1 Receptor Accessory Protein Modulates Neuronal Responses to Interleukin-1. Immunity. 2009;30(6):817–831. doi: 10.1016/j.immuni.2009.03.020. [DOI] [PMC free article] [PubMed] [Google Scholar]
- Smith HK, Gavins FN. The potential of stem cell therapy for stroke: is PISCES the sign? FASEB J. 2012;26(6):2239–2252. doi: 10.1096/fj.11-195719. [DOI] [PubMed] [Google Scholar]
- St John JC, Ramalho-Santos J, Gray HL, Petrosko P, Rawe VY, Navara CS, Simerly CR, Schatten GP. The expression of mitochondrial DNA transcription factors during early cardiomyocyte in vitro differentiation from human embryonic stem cells. Cloning Stem Cells. 2005;7(3):141–153. doi: 10.1089/clo.2005.7.141. [DOI] [PubMed] [Google Scholar]
- Stacpoole SR, Bilican B, Webber DJ, Luzhynskaya A, He XL, Compston A, Karadottir R, Franklin RJ, Chandran S. Derivation of neural precursor cells from human ES cells at 3% O(2) is efficient, enhances survival and presents no barrier to regional specification and functional differentiation. Cell Death Differ. 2011;18(6):1016–1023. doi: 10.1038/cdd.2010.171. [DOI] [PMC free article] [PubMed] [Google Scholar]
- Stacpoole SR, Spitzer S, Bilican B, Compston A, Karadottir R, Chandran S, Franklin RJ. High yields of oligodendrocyte lineage cells from human embryonic stem cells at physiological oxygen tensions for evaluation of translational biology. Stem Cell Reports. 2013a;1(5):437–450. doi: 10.1016/j.stemcr.2013.09.006. [DOI] [PMC free article] [PubMed] [Google Scholar]
- Stacpoole SR, Webber DJ, Bilican B, Compston A, Chandran S, Franklin RJ. Neural precursor cells cultured at physiologically relevant oxygen tensions have a survival advantage following transplantation. Stem Cells Transl Med. 2013b;2(6):464–472. doi: 10.5966/sctm.2012-0144. [DOI] [PMC free article] [PubMed] [Google Scholar]
- Stadler J, Bentz BG, Harbrecht BG, Di Silvio M, Curran RD, Billiar TR, Hoffman RA, Simmons RL. Tumor necrosis factor alpha inhibits hepatocyte mitochondrial respiration. Ann Surg. 1992;216(5):539–546. doi: 10.1097/00000658-199211000-00003. [DOI] [PMC free article] [PubMed] [Google Scholar]
- Steib K, Schaffner I, Jagasia R, Ebert B, Lie DC. Mitochondria modify exercise-induced development of stem cell-derived neurons in the adult brain. J Neurosci. 2014;34(19):6624–6633. doi: 10.1523/JNEUROSCI.4972-13.2014. [DOI] [PMC free article] [PubMed] [Google Scholar]
- Storch A, Paul G, Csete M, Boehm BO, Carvey PM, Kupsch A, Schwarz J. Long-term proliferation and dopaminergic differentiation of human mesencephalic neural precursor cells. Exp Neurol. 2001;170(2):317–325. doi: 10.1006/exnr.2001.7706. [DOI] [PubMed] [Google Scholar]
- Streit WJ, Mrak RE, Griffin WS. Microglia and neuroinflammation: a pathological perspective. J Neuroinflammation. 2004;1(1):14. doi: 10.1186/1742-2094-1-14. [DOI] [PMC free article] [PubMed] [Google Scholar]
- Studer L, Csete M, Lee SH, Kabbani N, Walikonis J, Wold B, McKay R. Enhanced proliferation, survival, and dopaminergic differentiation of CNS precursors in lowered oxygen. J Neurosci. 2000;20(19):7377–7383. doi: 10.1523/JNEUROSCI.20-19-07377.2000. [DOI] [PMC free article] [PubMed] [Google Scholar]
- Vayssiere JL, Cordeau-Lossouarn L, Larcher JC, Basseville M, Gros F, Croizat B. Participation of the mitochondrial genome in the differentiation of neuroblastoma cells. In Vitro Cell Dev Biol. 1992;28A(11-12):763–772. doi: 10.1007/BF02631065. [DOI] [PubMed] [Google Scholar]
- Vescovi AL, Parati EA, Gritti A, Poulin P, Ferrario M, Wanke E, Frolichsthal-Schoeller P, Cova L, Arcellana-Panlilio M, Colombo A, Galli R. Isolation and cloning of multipotential stem cells from the embryonic human CNS and establishment of transplantable human neural stem cell lines by epigenetic stimulation. Exp Neurol. 1999;156(1):71–83. doi: 10.1006/exnr.1998.6998. [DOI] [PubMed] [Google Scholar]
- Voloboueva LA, Emery JF, Sun X, Giffard RG. Inflammatory response of microglial BV-2 cells includes a glycolytic shift and is modulated by mitochondrial glucose-regulated protein 75/mortalin. FEBS Lett. 2013;587(6):756–762. doi: 10.1016/j.febslet.2013.01.067. [DOI] [PMC free article] [PubMed] [Google Scholar]
- Voloboueva LA, Lee SW, Emery JF, Palmer TD, Giffard RG. Mitochondrial protection attenuates inflammation-induced impairment of neurogenesis in vitro and in vivo. J Neurosci. 2010;30(37):12242–12251. doi: 10.1523/JNEUROSCI.1752-10.2010. [DOI] [PMC free article] [PubMed] [Google Scholar]
- Wagner KR, Kleinholz M, Myers RE. Delayed decreases in specific brain mitochondrial electron transfer complex activities and cytochrome concentrations following anoxia/ischemia. J Neurol Sci. 1990;100(1-2):142–151. doi: 10.1016/0022-510x(90)90025-i. [DOI] [PubMed] [Google Scholar]
- Wang W, Esbensen Y, Kunke D, Suganthan R, Rachek L, Bjoras M, Eide L. Mitochondrial DNA damage level determines neural stem cell differentiation fate. J Neurosci. 2011;31(26):9746–9751. doi: 10.1523/JNEUROSCI.0852-11.2011. [DOI] [PMC free article] [PubMed] [Google Scholar]
- Wang W, Osenbroch P, Skinnes R, Esbensen Y, Bjoras M, Eide L. Mitochondrial DNA integrity is essential for mitochondrial maturation during differentiation of neural stem cells. Stem Cells. 2010;28(12):2195–2204. doi: 10.1002/stem.542. [DOI] [PubMed] [Google Scholar]
- Winkler BS, Sauer MW, Starnes CA. Modulation of the Pasteur effect in retinal cells: implications for understanding compensatory metabolic mechanisms. Exp Eye Res. 2003;76(6):715–723. doi: 10.1016/s0014-4835(03)00052-6. [DOI] [PubMed] [Google Scholar]
- Wong G, Goldshmit Y, Turnley AM. Interferon-gamma but not TNF alpha promotes neuronal differentiation and neurite outgrowth of murine adult neural stem cells. Exp Neurol. 2004;187(1):171–177. doi: 10.1016/j.expneurol.2004.01.009. [DOI] [PubMed] [Google Scholar]
- Xavier JM, Morgado AL, Sola S, Rodrigues CM. Mitochondrial Translocation of p53 Modulates Neuronal Fate by Preventing Differentiation-Induced Mitochondrial Stress. Antioxid Redox Signal. 2014;21(7):1009–1024. doi: 10.1089/ars.2013.5417. [DOI] [PMC free article] [PubMed] [Google Scholar]
- Zell R, Geck P, Werdan K, Boekstegers P. TNF-alpha and IL-1 alpha inhibit both pyruvate dehydrogenase activity and mitochondrial function in cardiomyocytes: evidence for primary impairment of mitochondrial function. Mol Cell Biochem. 1997;177(1-2):61–67. doi: 10.1023/a:1006896832582. [DOI] [PubMed] [Google Scholar]
- Zhang J, Nuebel E, Daley GQ, Koehler CM, Teitell MA. Metabolic regulation in pluripotent stem cells during reprogramming and self-renewal. Cell Stem Cell. 2012;11(5):589–595. doi: 10.1016/j.stem.2012.10.005. [DOI] [PMC free article] [PubMed] [Google Scholar]