

Abstract
RATIONALE
A strong risk factor for atherosclerosis– the leading cause of heart attacks and strokes– is the elevation of low-density lipoprotein cholesterol (LDL-C) in blood. The LDL receptor (LDLR) is the primary pathway for LDL-C removal from circulation, and their levels are increased by statins --the main treatment for high blood LDL-C. However, statins have low efficiency because they also increase PCSK9 which targets LDLR for degradation. Since microRNAs have recently emerged as key regulators of cholesterol homeostasis, our aim was to identify potential microRNA-based therapeutics to decrease blood LDL-C and prevent atherosclerosis.
METHODS AND RESULTS
We over expressed and knocked down miR-27a in HepG2 cells to assess its effect on the expression of key players in the LDLR pathway using PCR Arrays, Elisas, and Western blots. We found that miR-27a decreases LDLR levels by 40% not only through a direct binding to its 3′ untranslated region but also indirectly by inducing a 3-fold increase in PCSK9, which enhances LDLR degradation. Interestingly, miR-27a also directly decreases LRP6 and LDLRAP1, two other key players in the LDLR pathway that are required for efficient endocytosis of the LDLR-LDL-C complex in the liver. The inhibition of miR-27a using lock nucleic acids induced a 70% increase in LDLR levels and, therefore, it would be a more efficient treatment for hypercholesterolemia because of its desirable effects not only on LDLR but also on PCSK9.
CONCLUSION
The results presented here provide evidence supporting the potential of miR-27a as a novel therapeutic target for the prevention of atherosclerosis.
Keywords: miR-27a, LDLR, PCSK9, LRP6, LDLRAP1, cholesterol homeostasis, atherosclerosis
Graphical Abstract
INTRODUCTION
Coronary heart disease (CHD)–a major complication of atherosclerosis–is the single leading cause of death in the Western World [1]. One of the strongest risk factors for atherosclerosis is the elevation of low-density lipoprotein cholesterol (LDL-C) in blood [2, 3]. The low-density lipoprotein receptor (LDLR) has a central role in cholesterol removal from circulation. The binding of LDL-C to LDLR initiates a receptor-mediated endocytosis. LDLRAP1 (LDLR-adapter protein 1) and LRP6 (LDLR-related protein 6) [2, 6, 7] are both required for an efficient endocytosis of the LDLR-LDL-C complex in liver –a necessary step to release LDL-C inside the cell. After internalization, LDLR dissociates from LDL-C in the endosomes and goes back to the cell surface. LDLR makes the same round trip several hundred times in its 20-hour lifespan [4]. However, binding of PCSK9 (proprotein convertase subtilisin/kexin type 9) to LDLR induces its degradation in lysosomes and, thus, shorten LDLR’s lifespan [2, 5].
Statins are the most commonly prescribed drugs to treat hypercholesterolemia [8, 9]. Statins slow and even reverse the development of coronary [10] and cerebral atherosclerosis [11]. However, some patients are statin-resistant because they fail to attain the recommended LDL-C target level, and still suffer heart attacks and strokes [12], while others are statin-intolerant and suffer adverse effects [13]. Therefore, more effective treatments to decrease blood LDL-C to prevent atherosclerosis and its complications are urgently needed.
MicroRNAs (miRNAs) have been recently identified as important regulators of genes involved in cholesterol homeostasis and potential novel therapeutic targets for hypercholesterolemia [14]. miRNAs are small (~22 nucleotide) single-stranded RNA molecules that regulate gene expression predominantly at the posttranscriptional level [15, 16]. The goal of our study was to identify novel potential therapeutic targets for hypercholesterolemia among miRNAs mapping to the most frequently reported region of linkage for high blood LDL-C in the literature (19p13.3-q13.32) [17, 18]. Of these, we selected miRNAs which are not only highly expressed in the liver but also target genes associated with cholesterol homeostasis. We found that miR-27a, a member of the miR-23a~27a~24-2 cluster on 19p13.13, not only directly decreases the levels of the LDLR on the surface of the liver cells but also targets other key players in the LDLR pathway which further contributes to hypercholesterolemia. The results presented here provide evidence supporting the potential of miR-27a as a therapeutic target for the prevention of atherosclerosis and its complications.
MATERIALS AND METHODS
Cell culture and treatments
Human liver hepatocellular carcinoma cell line (HepG2 cells) was purchased from the American Type Culture Collection (ATCC; Manassas, VA). Cells were cultured in EMEM (ATCC) supplemented with 10% fetal bovine serum (Life Technologies; Carlsbad, CA) in 25 cm2 polystyrene flasks placed in a Hera Cell 5% CO2 37°C incubator (ThermoFisher Scientific; Waltham, MA). Routine passage was carried out every 2 or 3 days.
About 2 × 10⁵ HepG2 cells were seeded per 6-cm plate and serum-starved for 24 h before the following treatments: 50, 100 or 200 μg/ml human LDL-cholesterol (LDL-C) (Kalen Biomedical; Montgomery Vlg, MD); 10, 30 or 90 μM simvastatin (Sigma; St Louis, MO); 100 nM insulin (Sigma); 30 nM glucose (Sigma); 5 μM Bay-11 (Cayman; Ann Arbor, MI); 200 μM fatty acids conjugated with 0.2% BSA (30 mM) in 1% ethanol. We treated HepG2 cells for 24 h with palmitic acid (Sigma), palmitoleic acid, stearic acid, oleic acid, linoleic acid, linolenic acid, and eicosapentaenoic acid (Cayman).
Bioinformatics
miRBase database (www.miRbase.org) was used to identified 91 miRNAs mapping to 19p13.3 – q13.32. MicroRNA gene targets were predicted using the TargetScan program release June 2012 (http://www.targetscan.org [14, 19, 20] and miRanda (http://www.microrna.org/microrna/home.do) [21].
Reverse transfection of miR-27a mimics and anti-miR-27a inhibitors
About 1 × 10⁵ HepG2 cells were seeded per well in a 12-well plate containing 3 μl Lipofectamine RNAiMAX (Life Technologies) supplemented with either 30 nM miR-27a mimic, 30 nM negative control mimic (NC; Dharmacon, Thermo Fisher Scientific; Pittsburgh PA), 50 nM locked nucleic acid (LNA) anti-miR-27a or LNA negative control (Exiqon; Woburn, MA). Total RNA was extracted 48 h after transfection using the miRNeasy Kit (Qiagen; Valencia, CA) according to the manufacturer’s instructions. Verification of miR-27a overexpression and knockdown was done using qPCR, as described below.
Quantitative real-time RT-PCR (qPCR)
First-strand cDNA was synthesized from either total RNA obtained from HepG2 cells or from Human Total RNA Survey Panel (Life Technologies) using random primers and the Super Script III Reverse Transcriptase kit (Life Technologies), according to the manufacturer’s protocol. For the quantification of specific microRNAs, total RNA samples were reverse transcribed using the TaqMan MicroRNA Reverse Transcriptase kit (Life Technologies), per the manufacturer’s instructions. Quantitative real time RT-PCR (qPCR) was performed using commercial TaqMan Gene Expression Assays (Life Technologies) in conjunction with the ABI Prism 7900 HT Sequence Detector apparatus (Applied Biosystems). Data were normalized using both 18S (eukaryotic 18S ribosomal RNA) and UBC (ubiquitin C), the 2 most stable housekeeping genes tested for the experimental conditions used. For microRNA quantification, data were normalized using RNU6B. Results were analyzed with RQ Manager and DataAssist software (Life Technologies). TaqMan assay information is provided in Supplementary Table 1.
SYBR PCR Array Gene Expression Profiling
Total RNA was extracted from HepG2 cells over-expressing either a control mimic or a miR-27a mimic, as described above. The RT2 First Strand kit (Qiagen) was used to reverse transcribe 1 μg of total RNA. Quantitative RT-PCR analysis of 84 lipid metabolism-related genes was performed using the Lipoprotein Signaling & Cholesterol Metabolism RT2 Profiler PCR Arrays (Qiagen) as it was previously described [22]. The complete list of genes and assays used in this PCR Array is shown in Supplementary Table 2. Data analysis was performed using RT2 Profiler PCR Array Data Analysis ver. 3.5 (http://pcrdataanalysis.sabiosciences.com/pcr/arrayanalysis.php) and ΔΔCt based fold-change calculations.
Western blot analysis
Cells were lysed on ice with Extraction Buffer containing 10 mM Tris HCl pH 7.4, 150 mM NaCl, 0.1% Triton X-100, and a protease inhibitor cocktail tablet (Roche; Branford, CT). Total soluble protein was quantified using the BCA Protein Assay kit (Pierce Biotechnology; Rockford, IL), and an equal amount of protein was loaded in each lane of a NuPAGE Novex 4–12% Bis-Tris gel. Membranes were blocked in 0.1% non-fat dry milk dissolved in 1X TBST (Tris-Buffered Saline plus 0.2% v/v Tween-20), and probed with antigen-specific antibodies. Rabbit polyclonal antibodies to LRP6 (1:1000) (GeneTex; Irvine, CA), LDLRAP1 (1:750) (Abcam; Cambridge, MA), and α/β tubulin (1:1000) (Cell Signaling Technology; Boston, MA) as well as anti-rabbit antibody (1:50,000) (Bio-Rad; Hercules, CA) were used in western blot. The antibody-antigen reactions were visualized using ECL Prime (GE Healthcare Life Sciences; Piscataway, NJ), and band density was quantified in triplicate with NIH Image J software (http://rsbweb.nih.gov/ij/).
Enzyme-linked immunosorbent assay analysis (ELISA)
Protein concentration was determined using a commercial sandwich ELISA kit for detection of LDLR (Cell Biolabs; San Diego, CA) and PCSK9 (R&D Systems; Minneapolis, MN) according to the manufacturer’s instructions. The optical density of the final product was read at 450 nm using a VICTOR3 Microplate Reader (Perkin Elmer; Waltham, MA).
miR-27a activity and 3′ UTR Luciferase Reporter Assays
Reporters were constructed based on pmirGLO Dual Luciferase miRNA Target Expression Vector (Promega; Fitchburg, WI). The pmirGLO vector contains firefly luciferase as the primary reporter to monitor mRNA regulation and Renilla luciferase as a control reporter for normalization [23].
To detect miR-27a activity in HepG2 cells, reporter pmiR-27a was generated with oligonucleotides containing the reverse complement sequence of mature miR-27a and the restriction sites for PmeI and XbaI (Supplementary Table 3). As a negative control, a mutated version of the reporter plasmid, named pmiR-27aM, was generated with oligonucleotides containing a mutated reverse complement sequence of mature miR-27a (Supplementary Table 3). For the construction of both pmiR-27a and pmiR-27aM, the oligonucleotides previously mentioned were annealed and cloned using PmeI and XbaI into the multiple cloning site (MCS) of the pmirGLO vector at the 3′ untranslated region (3′UTR) of the firefly luciferase gene. The firefly luciferase activity of HepG2 cells transfected with pmiR-27a inversely reports miR-27a activity in these cells.
The 3′UTR sequence of human LDLR (~740), LRP6 (~500 bp), and LDLRAP1 (~1400 bp) were generated by PCR using human genomic DNA as template and the CloneAmp HiFi PCR kit (Clontech; Mountain View, CA) as per the manufacturer’s instructions. In addition, site-directed mutagenesis in the seed region of predicted miR-27a sites within the 3′UTR of LDLR, LRP6 and LDLRAP1 were generated using Multisite-Quickchange (Stratagene) according to the manufacturer’s protocol. Restriction sites for PmeI and XbaI were added to the PCR primers (sequences provided in Supplementary Table 3) to allow the cloning of the PCR products into the MCS of the pmirGLO vector.
About 10,000 HepG2 cells were seeded per well into a white 96-well plate. After overnight incubation at 37°C, cells were co-transfected with 100 ng of the indicated luciferase reporter vectors and either 30 nM miR-27a, NC mimic (Dharmacon), LNA miR-27a inhibitor or LNA NC (Exiqon) using 0.2 μl per well of Lipofectamine 2000 (Life Technologies). Luciferase activity was measured 24 h after transfection using the Dual-Glo Luciferase Assay System (Promega). Firefly luciferase activity was normalized to the corresponding renilla luciferase activity and plotted as a percentage of the control (HepG2 cells co-transfected with plasmid and control mimic). Experiments were performed in triplicate wells of a 96-well plate.
LDLR activity
HepG2 cells were transfected with either miR-27a or NC mimic in a 96-well plate as previously described. Cell culture medium was removed from the 96-well plate 48 h after transfection, and cells were incubated overnight at 37°C in serum-free EMEM medium containing human LDL conjugated to DyLight™ 549, a fluorescent probe for detection of LDL uptake (LDL Uptake Cell-Based Assay kit; Cayman). The degree of LDL uptake was examined in an Evos Digital Inverted Fluorescence Microscope (AMG, Fisher Scientific) with filters for excitation at 540 nm and emission at 570 nm. The intensity of fluorescence was quantified at 540/570 nm excitation/emission using a Synergy MX plate reader (Biotek, Winooski, VT).
Statistical analysis
All statistical analyses were performed using the software GraphPad Prism 5 (GraphPad; La Jolla, CA). One-way ANOVA test with a Dunnett’s Multiple Comparison post-test were used to assess differences between conditions. Results were considered statistically significant if P<0.05.
RESULTS
Identification of miRNAs located on chromosome 19 (19p13.3 – q13.32) that participate in the regulation of cholesterol metabolism
The most frequently and consistently reported region of linkage for total cholesterol and/or LDL-C in the literature is on 19p13.3 – q13.32 [17, 18]. First, we determined if specific miRNAs located on this region of chromosome 19 participate in cholesterol homeostasis. Using the miRBase database (www.miRbase.org), we identified 91 miRNAs mapping to the region of interest. Since liver has a central role in cholesterol homeostasis, we identified which miRNAs among the ones localized on 19p13.3 – q13.32 have been previously reported to express in this organ [24–27]. We found that 7 out of the 91 miRNAs mapping on the region of interest were expressed in liver, including the miR-23a~27a~24-2 cluster on 19p13.13. While the three miRNA species of this cluster are derived from a single primary transcript, their expression patterns vary independently of one another depending on different biological conditions. Using TargetScan software, we found that miR-23a, miR-27a, and miR-24-2 have target sites in several genes related to cholesterol homeostasis (Supplementary Table 4). Therefore, we initially decided to focus our project on the functional characterization of these three miRNAs.
Quantification of miR-23a, miR-27a and miR-24-2 in different normal human organs
To determine expression patterns of miRNAs of interest, we first measured levels of miR-27a, miR-23a and miR-24-2 in human liver, adipose, kidney, small intestine, and heart tissues by TaqMan qPCR using a panel of total RNA. We found that the level of miR-27a was many times higher (lower cycle thresholds or Cts by qPCR) than miR-23a and miR-24-2 in all the different normal human organs assessed, including liver (Supplementary Table 5). Furthermore, recent studies have identified important roles for miR-27a on regulating cellular cholesterol in THP-1 macrophages [28]. Therefore, we decided to focus on the functional characterization of miR-27a and its role in cholesterol homeostasis in liver.
Identification of miR-27a target genes associated with lipoprotein transport and cholesterol metabolism
To begin to understand the role of miRNAs 27a in cholesterol homeostasis, we first over-expressed miR-27a in HepG2 cells using miRNA mimics, and determined the effect of miR-27a on the mRNA levels of 84 key genes involved in lipoprotein transport and cholesterol metabolism, using a SYBR PCR Array (Suppl. Table 2). We found a significant decrease in the levels of three key players in the LDLR pathway: LDLR, LRP6, and LDLRAP1 (Suppl. Fig. S1). These three genes were predicted as miR-27a targets by TargetScan and miRanda (Suppl. Table 6). Interestingly, we also found that miR-27a upregulates PCSK9, an enzyme that targets LDLR for degradation in the lysosomes. Based upon the strong evidence for their biological roles in cholesterol metabolism, we selected LRP6, LDLRAP1, PCSK9, and LDLR genes for further validation as targets of miR-27a.
miR-27a decreases expression of LRP6, an essential molecule for efficient LDLR endocytosis
The human LRP6 3′ UTR has one predicted conserved binding site for miR-27a (Fig. 1A). To confirm the results obtained in the SYBR PCR array, we quantified expression of LRP6 mRNA using TaqMan PCR in three independent experiments in which HepG2 cells were transfected with either 30 nM miR-27a mimic, negative control (NC) mimic, LNA anti-miR-27a, or LNA NC (Fig. 1A). We did not observe significant changes in the levels of LRP6 mRNA in HepG2 cells with miR-27a over-expression or knockdown suggesting that the effect of miR-27a on LRP6 expression is not at posttranscriptional level. However, these results are in disagreement with the results of the initial screening using SYBR PCR Array (Fig. 1S) in which we observed a 1.71 fold decrease in LRP6 mRNA in HepG2 cells transfected with 30 nM miR-27a mimic. This discrepancy on the effect of miR-27 on LRP6 mRNA can be explained by the differences in accuracy between mRNA quantification using SYBR PCR Array—a screening method used for a fast and a relatively inexpensive simultaneous quantification of the expression of multiple genes in the same sample— versus the more specific and accurate TaqMan PCR method which was used to confirm the results obtained by SYBR PCR Array [22].
Fig. 1. Effect of miR-27a on LRP6 expression in HepG2 cells.

(A) Predicted annealing of human miR-27a to LRP6 3′UTR. HepG2 cells were transfected with either 50 nM of LNA anti-miR-27a, 50 nM LNA NC, 30 nM of miR-27a, or 30 nM NC mimic, in the absence (A) or presence (B) of plasmid pLRP6-3′UTR. Western blot was used to assess the expression of LRP6 protein in HepG2 cells transfected with either LNA anti-miR-27a or LNA NC (C) as well as with either miR-27a or NC mimic (E). The intensity of the protein bands was measured by densitometry (D and F). Data are mean of three independent experiments ± S.D. LNA, locked nucleic acids; NC, negative control; LRP6, LDLR-related protein 6. The significance is indicated only for samples that are significantly different from all the others. * P<.05; ** P<0.01; *** P<0.001.
Next, we sought to determine whether miR-27a was able to bind to the 3′ UTR of LRP6. To this end, we constructed luciferase reporter plasmid pLRP6-3′UTR containing 500 bp of LRP6 3′UTR. We found that luciferase activity increased 40% in HepG2 with miR-27a knockdown co-transfeceted with pLRP6-3′UTR and decreased 40% when miR-27a was over-expressed, suggesting that the regulation of LRP6 by miR-27a is at translational level (Fig. 1B). As expected, mutations in the seed base-pairing sequence of the predicted miR-27a target site in LRP6 3′UTR reporter abolished regulation by miR-27a mimics and LNA anti-miR-27a (Fig. 1A). These results were confirmed by LRP6 western blot analysis of HepG2 cells with miR-27a knockdown (Fig. 1C and D) or miR-27a over-expression (Fig. 1E and F).
miR-27a downregulates LDLRAP1, another essential molecule for efficient endocytosis of LDLR
The human LDLRAP1 3′ UTR has two predicted miR-27a binding sites (Fig. 2A). To confirm the downregulation of LDLRAP1 gene expression by miR-27a that we observed using PCR Array, HepG2 cells were transfected with either 30 nM miR-27a, 30 nM NC mimics, 50 nM LNA anti-miR-27a, or 50 nM LNA NC. We found a 30% increase in LDLRAP1 mRNA levels in cells with miR-27a knockdown, and a 60% decrease in cells with miR-27a overexpression (Fig. 2B), suggesting that miR-27a downregulates LDLRAP1 at RNA level.
Fig. 2. Regulation of LDLRAP1 by miR-27a.

(A) Predicted annealing of human miR-27a to two sites on the LDLRAP1 3′UTR. (B and C) HepG2 cells were transfected with either 50 nM of LNA anti-miR-27a, 50 nM LNA NC, 30 nM of miR-27a mimic or 30 nM NC mimic, in the absence (B) or presence (C) of plasmid pLDLRAP1-3′UTR. The effect of miR-27a on the levels of LDLRAP1 mRNA was assessed by TaqMan qPCR (B), while luciferase activity was measured to determine the effect of miR-27a on protein levels (C). (D and E) The expression of LDLRAP1 protein in cells transfected with LNA anti-miR-27a or LNA NC was assessed by western-blot (D), and the intensity of the protein bands was measured by densitometry (E). Data are mean of three independent experiments ± S.D. LNA, locked nucleic acids; NC, negative control; LDLRAP1, LDLR-adapter protein 1. The significance is indicated only for samples that are significantly different from all the others. * P<.05; ** P<0.01; *** P<0.001.
A 3′UTR Luciferase Reporter Assay was performed in HepG2 cells co-transfected with plasmid pLDLRAP1-3′UTR and either LNA anti-miR-27a, LNA NC, miR-27a or NC mimics. We found that luciferase activity increased 40% with miR-27a knockdown and decreased 30% when miR-27a was over-expressed (Fig. 2C) suggesting that miR-27a downregulates LDLRAP1 gene not only at RNA but also at protein level. As expected, mutations in the seed base-pairing sequence of the two predicted miR-27a target sites in LDLRAP1 3′UTR reporter abolished regulation by miR-27a mimics and LNA anti-miR-27a (Fig. 2C). These results were confirmed by LDLRAP1 western blot of HepG2 cells with miR-27a knockdown (Fig. 2D and E).
miR-27a increases PCSK9, an enzyme that targets LDLR for degradation
PCSK9 is an enzyme that binds to the LDL receptor and induces its degradation. We found that LNA anti-miR-27a induced a dose-response decrease in the levels of PCSK9 mRNA in HepG2 cells compared to the control (Fig. 3A). Likewise, an increase in the level of PCSK9 mRNA and secreted PCSK9 protein was observed in cells with miR-27a overexpression (Fig. 3B). Since some reports suggest that miRNAs can upregulate rather than downregulate target genes by binding to their promoter region [29], we searched for sequences complementary to the different canonical seed types for miR-27a [30] in the PCSK9 promoter. We found a putative binding site for miR-27a at position -1671 bp relative to the transcription start site, possible in the PCSK9 promoter region. This site has the sequence AGTGTCA which is complementary to the 7mer- m8 seed type of miR-27a.
Fig. 3. Effect of miR-27a on the levels of PCSK9.

HepG2 cells were transfected with different concentrations of either LNA anti-miR-27a or LNA NC (A) or with either 30 nM miR-27a or NC mimic (B). The level of PCSK9 mRNA was quantified by TaqMan qPCR and the secreted PCSK9 protein by ELISA. Data are mean of three independent experiments ± S.D. LNA, locked nucleic acids; NC, negative control; PCSK9, proprotein convertase subtilisin/kexin type 9. The significance is indicated only for samples that are significantly different from all the others. * P<.05; ** P<0.01; *** P<0.001.
miR-27a directly downregulates LDLR by binding to its 3′UTR region
The human LDLR 3′ UTR has one predicted conserved miR-27a binding site (Fig. 4A). Thus, we first sought to confirm the effect of miR-27a on LDLR expression. We found that the inhibition of miR-27a using LNA-anti-miR-27a induced a dose-response increase in LDLR mRNA levels in HepG2 cells (Fig. 4A). Figure 4B shows the effect of miR-27a knockdown and overexpression on the levels of LDLR mRNA and protein. We concluded that miR-27a induced a decrease in LDLR at mRNA and protein levels.
Fig. 4. Effect of miR-27a on the expression of LDLR in HepG2 cells.

(A) Predicted annealing of human miR-27a to two sites on the LDLR 3′UTR. HepG2 cells were transfected with different concentrations of either LNA anti-miR-27a or LNA NC. (B) Cells were transfected with either 30 nM miR-27a, 30 nM NC mimic, 50 nM LNA anti-miR-27a or 50 nM LNA NC. The level of LDLR mRNA was quantified by TaqMan qPCR and the LDLR protein by ELISA. (C and D) Cells were co-transfected with 1 μg of reporter constructs pLDLR-3′UTR, pmiR-27a or mutated pmiR-27aM in the presence or absence of either 50 nM LNA anti-miR-27a, 50 nM LNA NC, 30 nM miR-27a or 30 nM NC mimic. (E) LDLR activity was assessed in HepG2 cells transfected with either 30 nM miR-27a or NC mimics and incubated overnight with LDL conjugated to DyLight™ 549, a fluorescent probe for detection of LDL uptake. The degree of LDL uptake was examined in an Evos Digital Inverted Fluorescence Microscope (AMG, Fisher Scientific) with filters for excitation at 540 nm and emission at 570 nm. (F) The intensity of fluorescence was quantified at 540/570 nm excitation/emission using a Synergy MX plate reader (Biotek). Data are mean of three independent experiments ± S.D. LNA, locked nucleic acids; NC, negative control; LDLR, LDL receptor. The significance is indicated only for samples that are significantly different from all the others. * P<.05; ** P<0.01; *** P<0.001.
We next wanted to determine whether the effect of miR-27a on LDLR level was only indirect and secondary to its regulation of PCSK9 or if there was also a direct effect. To this aim, we first transfected HepG2 cells with pLDLR-3′UTR and observed an 80% decrease in luciferase activity compared to empty vector suggesting the presence of factors that bind to the 3′UTR of LDLR likely including endogenous miR-27a (Fig. 4C, bar 2). We next transfected HepG2 cells with either pmiR-27a or pmiR-27aM in the presence or absence of LNA anti-miR-27a or LNA NC to determine miR-27a activity in HepG2 cells (Fig. 4C). We observed an 80% decrease in luciferase activity in cells transfected with pmiR-27a compared to empty vector suggesting that endogenous miR-27a is active in HepG2 cells. As expected, the decrease in luciferase activity observed in cells transfected with pmiR-27a was reversed when they were co-transfected with LNA anti-miR-27a (Fig. 4C, bar 5), but not LNA NC, demonstrating that LNA anti-miR-27a is specific for miR-27a. However, when cells were transfected with pmiR-27aM (the mutated version of pmiR-27a), luciferase activity was not affected compared to those cells transfected with the empty vector (Fig. 4C, column 6). We next co-transfected HepG2 cells with reporter pLDLR-3′UTR and either NC mimic, miR-27a mimic, LNA NC or LNA anti-miR-27a. We found that luciferase activity decreased 30% in cells over-expressing miR-27a while increased 25% in those with miR-27a knockdown (Fig. 4D, bars 2 and 5). As expected, mutations in the seed base-pairing sequence of the predicted miR-27a target site in LDLR 3′UTR reporter abolished regulation by miR-27a mimics and LNA anti-miR-27a (Fig. 4D, bars 3 and 6). These results confirmed that miR-27a directly downregulates the level of LDLR expression by binding to its 3′UTR. Finally, the activity of the LDLR was assessed in HepG2 cells transfected with either miR-27a or NC mimic and incubated with LDL labeled with DyLight™ 549. We found that LDLR activity decreased about 50% in HepG2 cells transfected with miR-27a mimic compared to the control (Fig. 4E and F).
Regulation of miR-27a expression in HepG2 cells
We wanted to determine whether NF-kB, LDL-C, insulin, glucose and fatty acids regulate the expression of miR-27a in HepG2 cells. We found that Bay-11, an inhibitor of NF-kB, decreased miR-27a expression, while LDL-C, simvastatin (inhibitor of cholesterol synthesis), and insulin but not glucose, increased the level of miR-27a in HepG2 cells (Fig. 5A). We observed a dose-response effect of simvastatin on the expression of miR-27a (Fig. 5B), while a biphasic response with a peak at 50 μg/ml was observed for LDL-C (Fig. 5C). In addition, we assessed the effect of different fatty acids on the expression of miR-27a (Fig. 5D). We found that the polyunsaturated fatty acids linoleic and eicopentanoic (EPA) induced a modest increase in the level of miR-27a, while the monounsaturated fatty acids palmitoleic and oleic decreased miR-27a. However, the saturated fatty acids palmitic and stearic did not significantly affect the levels of miR-27a. These results suggest that the level of saturation of fatty acids may determine the type of effect on the levels of miR-27a.
Fig. 5. Regulation of miR-27a in HepG2 cells.

The level of miR-27a was assessed by TaqMan qPCR in HepG2 cells treated for 24 h with (A) Bay-11 (an inhibitor of NF-KB), LDL-C, simvastatin (commonly used statin that inhibits cholesterol synthesis), insulin and glucose; (B) 200 μM fatty acids (Sigma) conjugated with 0.2% BSA (30 mM) in 1% ethanol; different concentrations of simvastatin (C) or human LDL-C (D). Data are mean of three independent experiments ± S.D. The significance is indicated only for samples that are significantly different from all the others. * P<.05; ** P<0.01; *** P<0.001.
DISCUSION
Several microRNAs have been identified as post-transcriptional regulators of cholesterol homeostasis, including miR-122, miR-370, miR-33 [3–33]. More recently, the miR-27 family (miR-27a and miR-27b) has emerged as a new key regulator in cholesterol and lipid homeostasis [28, 35, 36]. Although many genes associated with lipid and cholesterol metabolism are predicted as potential binding targets of the miR-27 family according to different bioinformatic databases, only few have been validated [35].
In the present study, we elucidated the underlying mechanism of miR-27a modulation of LDLR—the major regulator of LDL-C removal from circulation. Choi et al. [37] previously reported that miR-27a decreases hepatitis C virus (HCV) infectivity by downregulating LDLR --a candidate HCV entry receptor-- in differenciated hepatocyte-like cells (DHCs). Furthermore, these authors confirmed that, as the expression of miR-27a decreases during hepatic differentiation, the levels of LDLR increased. In contrast, miR-27b --the other member of the miR-27 family that shares the same seed region and 20 out of 21 nucleotides with 27a— increases during hepatic differentiation [37] suggesting that miR-27a but not miR-27b, modulates LDLR in DHCs. Although Choi et al [37] have clearly demonstrated that miR-27a downregulates LDLR, they did not characterize the underlying mechanism and whether this observed effect was direct or indirect.
Here, we demonstrated for the first time that miR-27a directly decreases LDLR at both RNA and protein levels by binding to the 3′UTR of the LDLR gene. Moreover, we found that miR-27a also indirectly decreases the levels of LDLR protein through upregulation of PCSK9, an enzyme that enhances hepatic LDLR degradation [38] (Fig. 6A). Overexpression of miR-27a induced an increase in the level of PCSK9 mRNA and secreted PCSK9 protein, while inhibition of miR-27a using LNA induced a dose-response decrease of up to 50% in the levels of PCSK9 compared to control. These results clearly demonstrated that miR-27a upregulates PCSK9 gene. This effect can be indirect via a downregulation of an unknown target that decreases PCSK9 levels, or direct through upregulation of PCSK9 gene expression by miR-27a. However, miRNAs generally induce downregulation rather than upregulation of gene expression through complementary binding to the 3′UTR of their target genes. Furthermore, miR-27a does not even have a putative binding site in the 3′UTR of PCSK9. Nevertheless, some studies demonstrated that miRNAs can also interact with their target genes by complementary binding to its promoter which stimulate rather than inhibit gene transcription and protein translation [29, 39]. We found a potential binding site for miR-27a at position -1671 bp relative to the transcription start site, which may be responsible for the upregulation of PCSK9. Although we recognize that it would have been interesting to further characterize the mechanism by which miR-27a upregulates PCSK9, this is outside the scope of this present study.
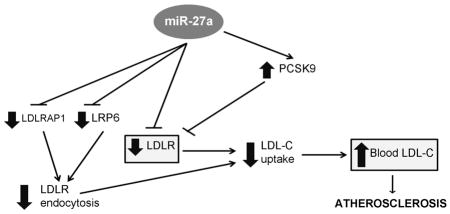
Fig. 6. Proposed mechanism for the effect of miR-27a and simvastatin on cholesterol homeostasis in the liver.

(A) miR-27a directly downregulates LDLR, LDLRAP1 and LRP6 gene expression by binding to their 3′UTR region. LDLRAP1 and LRP6 proteins are essential for efficient endocytosis of LDLR in hepatocytes, a step required for the release of LDL-C inside the cell. miR-27a also upregulates the enzyme PCSK9, which induces LDLR degradation and, thus, further decreases the number of LDLRs on the surface of the cell. Therefore, miR-27a decreases the level and efficiency of the LDLR leading to a diminished LDL-C uptake and increased LDL-C levels in the blood that contributes to atherosclerosis. (B) Simvastatin (SIM) inhibits HMGCR (3-hydroxy-3-methylglutaryl-CoA reductase), the limiting rate enzyme of the cholesterol biosynthesis, which induces a decrease in intracellular (I. C.) cholesterol and subsequent increase in the expression of the LDLR. However, simvastatin not only increases the expression of PCSK9 --an enzyme that induces LDLR degradation-- but also miR-27a, which contribute to diminish the efficiency of the treatment with statins in patients with hypercholesterolemia.
In addition to the direct and indirect downregulation of LDLR levels, miR-27a indirectly affects LDLR efficiency through a mechanism in which miR-27a targets another two genes of the LDLR pathway: LRP6 and LDLRAP1. Once LDL-C binds to LDLR, LRP6 forms a complex with LDLR, LDLRAP1, and clathrin to initiate a clathrin-dependent endocytosis. Thus, both LRP6 and LDLRAP1 are essential for efficient endocytosis of the LDLR-LDL-C complex in the liver [6, 7, 40], a step required to release LDL-C inside the cell. We found that miR-27a directly downregulates the expression of LRP6 and LDLRAP1 genes by binding to their 3′UTR. Therefore, miR-27a may not only decrease the level of LDLR on the surface of hepatocytes but also may affect its efficiency. In fact, we found that LDLR activity decreased about 50% in HepG2 cells transfected with miR-27a mimic compared to the control. Figure 6A summarizes all the mechanisms unraveled in the present study by which miR-27a may directly and indirectly affect LDLR levels and efficiency causing a decrease in the uptake of LDL-C. Consequently, LDL-C may accumulate in blood resulting in the deposition of cholesterol in tissues and in the arterial wall that leads to atherosclerosis. However, caution is required when extrapolating miRNA expression results in vitro into an in vivo scenario.
Dysregulation of miR-27a has been reported in different diseases commonly associated with high circulating LDL-C such as metabolic syndrome [41], diabetes [41–43], obesity [44], and non-alcoholic fatty liver disease (NAFLD) [45]. To start investigating how miR-27a is regulated and how it might be affected in these diseases, we assessed the effect of insulin, glucose, LDL-C, statins, fatty acids, and NF-kB (nuclear factor kappa B) on the levels of miR-27a in HepG2 cells. We found that insulin induced a 60% increase in the levels of miR-27a, while no effect was observed after treatment with high glucose. These results are in agreement with a global microRNA expression profiles performed in insulin-targeted tissues from a spontaneous rat model of type 2 diabetes in which miR-27a was upregulated in adipose tissue but not in liver or muscle. In addition, exposure of 3T3-L1 adipocytes to increased glucose concentration induced miR-27a upregulation [43]. Interestingly, an increase in the levels of circulating miR-27a in patients with metabolic syndrome and type 2 diabetes has been recently reported [41]. In the same study, a strong correlation between raised levels of fasting glucose and altered levels of circulating miR-27a was found in 265 individuals with health conditions related to metabolic syndrome. In another study, levels of miR-27a were significantly increased in sera from children and adolescents with newly diagnosed type 1 diabetes [42].
Transcription factor NF-kB controls many genes involved in inflammation, and is chronically active in diseases such as NAFLD [46] and atherosclerosis [47]. We found a 50% decrease in the levels of miR-27a in HepG2 treated with Bay-11, an inhibitor of NF-kB, suggesting that NF-kB upregulates hepatic miR-27a which may contribute to increase LDL-C in NAFLD and atherosclerosis.
For the past 20 years, drugs known as statins –which increase the levels of LDLR on the surface of the liver cells– have been the main treatment for high blood LDL-C. However, some patients do not respond to the treatment or fail to achieve the recommended levels of LDL-C and still suffer heart attacks [12]. Part of the positive effect of statins on augmenting the levels of LDLR is partially counteracted by an increase in the enzyme PCSK9, which degrades LDLR [48]. Interestingly, we found that a commonly used statin, known as simvastatin, induced a dose-response increase in the levels of miR-27a in HepG2 cells. Since miR-27a decreases LDLR while increasing PCSK9 protein levels, upregulation of miR-27a may contribute to limit the efficiency of this drug (Fig. 7B).
We observed that miR-27a inhibition using a specific LNA antisense oligonucleotide induced a 70% increase in the levels of LDLR and a 50% decrease in PCSK9. In a recent report, two LNA antisense oligonucleotides targeting PCSK9 induced a 50% reduction in circulating LDL-C with no observed toxic effects in nonhuman primates [49]. These results demonstrate the feasibility and efficacy of using LNA technology to downregulate a target gene and decrease LDL-C. The potential of using miR-27a as a therapeutic target for atherosclerosis has already been proposed in a recent report from Zhang et al [28] in which it was demonstrated that miR-27a and b regulate cellular cholesterol efflux, influx, and esterification/hydrolysis in THP-1 macrophages. Because miR-27a regulates different pathways that contribute to atherosclerosis in liver and macrophages, the inhibition of miR-27a may be a more global and effective therapeutic alternative to statins and PCSK9 inhibition.
The results presented here provide new insight into the complex mechanisms underlying cholesterol homeostasis as well as further evidence supporting the potential of miR-27a as a therapeutic target for the prevention of atherosclerosis and its complications.
Supplementary Material
Cells were transfected with either 30 nM miR-27a or NC (negative control) mimics and total RNA was extracted 48 h after transfection. RNA was reverse transcribed and analyzed using a commercial 384-well plate SYBR PCR array that profiles the expression of 84 pathway-focused key genes involved in lipoprotein transport and cholesterol metabolism (Qiagen) as previously described [22]. Supplementary Table 2 shows the list of genes in this array. Results were analyzed using The RT2 Profiler PCR Array Data Analysis version 3.5 (http://sabiosciences.com/pcr/arrayanalysis.php) and represented as a heat map, which provides fold regulation expression data between two groups overlaid onto the PCR Array plate layout.
ABI TaqMan Assays used in real-time quantitative PCR (qPCR)
Table S2: Gene array in the Lipoprotein Signaling & Cholesterol Metabolism RT2 Profiler PCR Array (Qiagen)
Primers used for the cloning of luciferase reporter vectors
Table S4. Some of the predicted targets of the miR-23a~27a~24a cluster that are related to cholesterol homeostasis
Table S5. Expression of miRNA-23, miR-24-2 and miR-27a in different normal human organs assessed by qPCRa
Table S6: Results using the softwares TargetScan and miRanda to identify miR-27a targets in the LDLR pathway
HIGHLIGHTS.
miR-27a directly decreases the levels of hepatic LDL receptor by 40%.
The inhibition of miR-27a increases the levels of LDL receptor by 70%.
miR-27a induces a 3-fold increase in the levels of PCSK9.
miR-27a decreases LRP6 and LDLRAP1, two other key players in the LDLR pathway.
The inhibition of miR-27a would be an effective therapeutic alternative to statins.
Acknowledgments
We thank Paul Arnold for his critical review of this manuscript.
This work was supported by M.L.A.’s Supplemental Award to Promote Diversity in Health-Related Research (PA- 08-190, National Heart, Lung and Blood Institute, NIH).
ABBREVIATIONS
- LDL
low-density lipoprotein
- LDL-C
LDL cholesterol
- LDLR
LDL receptor
- PCSK9
proprotein convertase subtilisin/kexin type 9
- LRP6
LDLR-related protein 6
- LDLRAP1
LDLR-adapter protein 1
- miRNA
microRNA
- LNA
locked nucleic acid
- N.C
negative control
- MCS
multiple cloning site
- 3′UTR
3′ untranslated region
Footnotes
Publisher's Disclaimer: This is a PDF file of an unedited manuscript that has been accepted for publication. As a service to our customers we are providing this early version of the manuscript. The manuscript will undergo copyediting, typesetting, and review of the resulting proof before it is published in its final citable form. Please note that during the production process errors may be discovered which could affect the content, and all legal disclaimers that apply to the journal pertain.
References
- 1.Contu R, Latronico MV, Condorelli G. Circulating microRNAs as potential biomarkers of coronary artery disease: a promise to be fulfilled? Circ Res. 2010;107:573–574. doi: 10.1161/CIRCRESAHA.110.227983. [DOI] [PubMed] [Google Scholar]
- 2.Go GW, Mani A. Low-Density Lipoprotein Receptor (LDLR) Family Orchestrates Cholesterol Homeostasis. Yale J Biol Med. 2012;85:19–28. [PMC free article] [PubMed] [Google Scholar]
- 3.Mozaffarian D, Benjamin EJ, Go AS, et al. Heart disease and stroke statistics--2015 update: a report from the American Heart Association. Circulation. 2015;131:e29–322. doi: 10.1161/CIR.0000000000000152. [DOI] [PubMed] [Google Scholar]
- 4.Goldstein JL, Brown MS. The LDL receptor. Arterioscler Thromb Vasc Biol. 2009;29:431–438. doi: 10.1161/ATVBAHA.108.179564. [DOI] [PMC free article] [PubMed] [Google Scholar]
- 5.Abifadel M, Varret M, Rabes JP, et al. Mutations in PCSK9 cause autosomal dominant hypercholesterolemia. Nat Genet. 2003;34:154–156. doi: 10.1038/ng1161. [DOI] [PubMed] [Google Scholar]
- 6.Michaely P, Li WP, Anderson RG, et al. The modular adaptor protein ARH is required for low density lipoprotein (LDL) binding and internalization but not for LDL receptor clustering in coated pits. J Biol Chem. 2004;32:34023–34031. doi: 10.1074/jbc.M405242200. [DOI] [PubMed] [Google Scholar]
- 7.Ye ZJ, Go GW, Singh R, et al. LRP6 protein regulates low density lipoprotein (LDL) receptor-mediated LDL uptake. J Biol Chem. 2012;287:1335–1344. doi: 10.1074/jbc.M111.295287. [DOI] [PMC free article] [PubMed] [Google Scholar]
- 8.Kidd J. Life after statin patent expiries. Nat Rev Drug Discov. 2006;10:813–814. doi: 10.1038/nrd2156. [DOI] [PubMed] [Google Scholar]
- 9.Dong B, Wu M, Li H, et al. Strong induction of PCSK9 gene expression through HNF1alpha and SREBP2: mechanism for the resistance to LDL-cholesterol lowering effect of statins in dyslipidemic hamsters. J Lipid Res. 2010;51:1486–1495. doi: 10.1194/jlr.M003566. [DOI] [PMC free article] [PubMed] [Google Scholar]
- 10.Athyros VG, Katsiki N, Karagiannis A, et al. High-intensity statin therapy and regression of coronary atherosclerosis in patients with diabetes mellitus. J Diabetes Complications. 2015;29:142–145. doi: 10.1016/j.jdiacomp.2014.10.004. [DOI] [PubMed] [Google Scholar]
- 11.Hegland O, Kurz MW, Munk PS, et al. The effect of statin therapy on the progression of carotid artery stenosis in relation to stenosis severity. Acta Neurol Scand. 2010;121:11–15. doi: 10.1111/j.1600-0404.2009.01280.x. [DOI] [PubMed] [Google Scholar]
- 12.Karalis DG, Victor B, Ahedor L, et al. Use of lipid-lowering medications and the likelihood of achieving optimal LDL-cholesterol goals in coronary artery disease patients. Cholesterol. 2012;861924:1–7. doi: 10.1155/2012/861924. [DOI] [PMC free article] [PubMed] [Google Scholar]
- 13.Reiner Z. Resistance and intolerance to statins. Nutr Metab Cardiovasc Dis. 2014;24:1057–1066. doi: 10.1016/j.numecd.2014.05.009. [DOI] [PubMed] [Google Scholar]
- 14.Fernandez-Hernando C, Moore KJ. MicroRNA modulation of cholesterol homeostasis. Arterioscler Thromb Vasc Biol. 2011;31:2378–2382. doi: 10.1161/ATVBAHA.111.226688. [DOI] [PMC free article] [PubMed] [Google Scholar]
- 15.Ambros V. The functions of animal microRNAs. Nature. 2004;431:350–355. doi: 10.1038/nature02871. [DOI] [PubMed] [Google Scholar]
- 16.Bartel DP. MicroRNAs: target recognition and regulatory functions. Cell. 2009;136:215–233. doi: 10.1016/j.cell.2009.01.002. [DOI] [PMC free article] [PubMed] [Google Scholar]
- 17.Beekman M, Heijmans BT, Martin NG, et al. Evidence for a QTL on chromosome 19 influencing LDL cholesterol levels in the general population. Eur J Hum Genet. 2003;11:845–850. doi: 10.1038/sj.ejhg.5201053. [DOI] [PubMed] [Google Scholar]
- 18.Imperatore G, Knowler WC, Pettitt DJ, et al. A locus influencing total serum cholesterol on chromosome 19p: results from an autosomal genomic scan of serum lipid concentrations in Pima Indians. Arterioscler Thromb Vasc Biol. 2000;20:2651–2656. doi: 10.1161/01.atv.20.12.2651. [DOI] [PubMed] [Google Scholar]
- 19.Lewis BP, Burge CB, Bartel DP. Conserved seed pairing, often flanked by adenosines, indicates that thousands of human genes are microRNA targets. Cell. 2005;120:15–20. doi: 10.1016/j.cell.2004.12.035. [DOI] [PubMed] [Google Scholar]
- 20.Grimson A, Farh KK, Johnston WK, et al. MicroRNA targeting specificity in mammals: determinants beyond seed pairing. Mol Cell. 2007;27:91–105. doi: 10.1016/j.molcel.2007.06.017. [DOI] [PMC free article] [PubMed] [Google Scholar]
- 21.John B, Enright AJ, Aravin A, et al. Human MicroRNA targets. PLoS Biol. 2004;2:e363. doi: 10.1371/journal.pbio.0020363. [DOI] [PMC free article] [PubMed] [Google Scholar]
- 22.Alvarez ML, Done SC. SYBR(R) Green and TaqMan(R) quantitative PCR arrays: expression profile of genes relevant to a pathway or a disease state. Methods Mol Biol. 2014;1182:321–359. doi: 10.1007/978-1-4939-1062-5_27. [DOI] [PubMed] [Google Scholar]
- 23.Alvarez ML. Faster Experimental Validation of microRNA Targets Using Cold Fusion Cloning and a Dual Firefly-Renilla Luciferase Reporter Assay. Methods Mol Biol. 2014;1182:227–243. doi: 10.1007/978-1-4939-1062-5_21. [DOI] [PubMed] [Google Scholar]
- 24.Landgraf P, Rusu M, Sheridan R, et al. A mammalian microRNA expression atlas based on small RNA library sequencing. Cell. 2007;129:1401–1414. doi: 10.1016/j.cell.2007.04.040. [DOI] [PMC free article] [PubMed] [Google Scholar]
- 25.Barad O, Meiri E, Avniel A, et al. MicroRNA expression detected by oligonucleotide microarrays: system establishment and expression profiling in human tissues. Genome Res. 2004;14:2486–2494. doi: 10.1101/gr.2845604. [DOI] [PMC free article] [PubMed] [Google Scholar]
- 26.Chen XM. MicroRNA signatures in liver diseases. World J Gastroenterol. 2009;15:1665–1672. doi: 10.3748/wjg.15.1665. [DOI] [PMC free article] [PubMed] [Google Scholar]
- 27.Fu H, Tie Y, Xu C, et al. Identification of human fetal liver miRNAs by a novel method. FEBS Lett. 2005;579:3849–3854. doi: 10.1016/j.febslet.2005.05.064. [DOI] [PubMed] [Google Scholar]
- 28.Zhang M, Wu JF, Chen WJ, et al. MicroRNA-27a/b regulates cellular cholesterol efflux, influx and esterification/hydrolysis in THP-1 macrophages. Atherosclerosis. 2014;234:54–64. doi: 10.1016/j.atherosclerosis.2014.02.008. [DOI] [PubMed] [Google Scholar]
- 29.Place RF, Li LC, Pookot D, et al. MicroRNA-373 induces expression of genes with complementary promoter sequences. Proc Natl Acad Sci U S A. 2008;105:1608–1613. doi: 10.1073/pnas.0707594105. [DOI] [PMC free article] [PubMed] [Google Scholar]
- 30.Ellwanger DC, Buttner FA, Mewes HW, et al. The sufficient minimal set of miRNA seed types. Bioinformatics. 2011;10:1346–1350. doi: 10.1093/bioinformatics/btr149. [DOI] [PMC free article] [PubMed] [Google Scholar]
- 31.Esau C, Davis S, Murray SF, et al. miR-122 regulation of lipid metabolism revealed by in vivo antisense targeting. Cell Metab. 2006;3:87–98. doi: 10.1016/j.cmet.2006.01.005. [DOI] [PubMed] [Google Scholar]
- 32.Iliopoulos D, Drosatos K, Hiyama Y, et al. MicroRNA-370 controls the expression of microRNA-122 and Cpt1alpha and affects lipid metabolism. J Lipid Res. 2010;51:1513–1523. doi: 10.1194/jlr.M004812. [DOI] [PMC free article] [PubMed] [Google Scholar]
- 33.Rayner KJ, Suarez Y, Davalos A, et al. MiR-33 contributes to the regulation of cholesterol homeostasis. Science. 2010;328:1570–1573. doi: 10.1126/science.1189862. [DOI] [PMC free article] [PubMed] [Google Scholar]
- 34.Najafi-Shoushtari SH, Kristo F, Li Y, et al. MicroRNA-33 and the SREBP host genes cooperate to control cholesterol homeostasis. Science. 2010;328:1566–1569. doi: 10.1126/science.1189123. [DOI] [PMC free article] [PubMed] [Google Scholar]
- 35.Chen WJ, Yin K, Zhao GJ, et al. The magic and mystery of microRNA-27 in atherosclerosis. Atherosclerosis. 2012;222:314–323. doi: 10.1016/j.atherosclerosis.2012.01.020. [DOI] [PubMed] [Google Scholar]
- 36.Vickers KC, Shoucri BM, Levin MG, et al. MicroRNA-27b is a regulatory hub in lipid metabolism and is altered in dyslipidemia. Hepatology. 2013;57:533–542. doi: 10.1002/hep.25846. [DOI] [PMC free article] [PubMed] [Google Scholar]
- 37.Choi JE, Hur W, Kim JH, et al. MicroRNA-27a modulates HCV infection in differentiated hepatocyte-like cells from adipose tissue-derived mesenchymal stem cells. PLoS One. 2014;9:e91958. doi: 10.1371/journal.pone.0091958. [DOI] [PMC free article] [PubMed] [Google Scholar]
- 38.Li S, Li JJ. PCSK9: A key factor modulating atherosclerosis. J Atheroscler Thromb. 2015;22:221–230. doi: 10.5551/jat.27615. [DOI] [PubMed] [Google Scholar]
- 39.Huang V, Place RF, Portnoy V, et al. Upregulation of Cyclin B1 by miRNA and its implications in cancer. Nucleic Acids Res. 2012;40:1695–707. doi: 10.1093/nar/gkr934. [DOI] [PMC free article] [PubMed] [Google Scholar]
- 40.He G, Gupta S, Yi M, et al. ARH is a modular adaptor protein that interacts with the LDL receptor, clathrin, and AP-2. J Biol Chem. 2002;277:44044–44049. doi: 10.1074/jbc.M208539200. [DOI] [PubMed] [Google Scholar]
- 41.Karolina DS, Tavintharan S, Armugam A, et al. Circulating miRNA profiles in patients with metabolic syndrome. J Clin Endocrinol Metab. 2012;97:E2271–2276. doi: 10.1210/jc.2012-1996. [DOI] [PubMed] [Google Scholar]
- 42.Nielsen LB, Wang C, Sorensen K, et al. Circulating levels of microRNA from children with newly diagnosed type 1 diabetes and healthy controls: evidence that miR-25 associates to residual beta-cell function and glycaemic control during disease progression. Exp Diabetes Res. 2012;2012:896362. doi: 10.1155/2012/896362. [DOI] [PMC free article] [PubMed] [Google Scholar]
- 43.Herrera BM, Lockstone HE, Taylor JM, et al. Global microRNA expression profiles in insulin target tissues in a spontaneous rat model of type 2 diabetes. Diabetologia. 2010;53:1099–1109. doi: 10.1007/s00125-010-1667-2. [DOI] [PMC free article] [PubMed] [Google Scholar]
- 44.Xie H, Sun L, Lodish HF. Targeting microRNAs in obesity. Expert Opin Ther Targets. 2009;10:1227–1238. doi: 10.1517/14728220903190707. [DOI] [PMC free article] [PubMed] [Google Scholar]
- 45.Alisi A, Da Sacco L, Bruscalupi G, et al. Mirnome analysis reveals novel molecular determinants in the pathogenesis of diet-induced nonalcoholic fatty liver disease. Lab Invest. 2011;2:283–293. doi: 10.1038/labinvest.2010.166. [DOI] [PubMed] [Google Scholar]
- 46.Dowman JK, Tomlinson JW, Newsome PN. Pathogenesis of non-alcoholic fatty liver disease. QJM. 2010;103:71–83. doi: 10.1093/qjmed/hcp158. [DOI] [PMC free article] [PubMed] [Google Scholar]
- 47.Monaco C, Paleolog E. Nuclear factor kappaB: a potential therapeutic target in atherosclerosis and thrombosis. Cardiovasc Res. 2004;4:671–682. doi: 10.1016/j.cardiores.2003.11.038. [DOI] [PubMed] [Google Scholar]
- 48.Dubuc G, Chamberland A, Wassef H, et al. Statins upregulate PCSK9, the gene encoding the proprotein convertase neural apoptosis-regulated convertase-1 implicated in familial hypercholesterolemia. Arterioscler Thromb Vasc Biol. 2004;24:1454–1459. doi: 10.1161/01.ATV.0000134621.14315.43. [DOI] [PubMed] [Google Scholar]
- 49.Lindholm MW, Elmen J, Fisker N, et al. PCSK9 LNA antisense oligonucleotides induce sustained reduction of LDL cholesterol in nonhuman primates. Mol Ther. 2012;20:376–381. doi: 10.1038/mt.2011.260. [DOI] [PMC free article] [PubMed] [Google Scholar]
- 50.Garcia DM, Baek D, Shin C, et al. Weak seed-pairing stability and high target-site abundance decrease the proficiency of lsy-6 and other microRNAs. Nat Struct Mol Biol. 2011;18:1139–1146. doi: 10.1038/nsmb.2115. [DOI] [PMC free article] [PubMed] [Google Scholar]
- 51.Friedman RC, Farh KK, Burge CB, et al. Most mammalian mRNAs are conserved targets of microRNAs. Genome Res. 2009;19:92–105. doi: 10.1101/gr.082701.108. [DOI] [PMC free article] [PubMed] [Google Scholar]
- 52.Betel D, Koppal A, Agius P, et al. Comprehensive modeling of microRNA targets predicts functional non-conserved and non-canonical sites. Genome Biol. 2011;11:R90. doi: 10.1186/gb-2010-11-8-r90. [DOI] [PMC free article] [PubMed] [Google Scholar]
Associated Data
This section collects any data citations, data availability statements, or supplementary materials included in this article.
Supplementary Materials
Cells were transfected with either 30 nM miR-27a or NC (negative control) mimics and total RNA was extracted 48 h after transfection. RNA was reverse transcribed and analyzed using a commercial 384-well plate SYBR PCR array that profiles the expression of 84 pathway-focused key genes involved in lipoprotein transport and cholesterol metabolism (Qiagen) as previously described [22]. Supplementary Table 2 shows the list of genes in this array. Results were analyzed using The RT2 Profiler PCR Array Data Analysis version 3.5 (http://sabiosciences.com/pcr/arrayanalysis.php) and represented as a heat map, which provides fold regulation expression data between two groups overlaid onto the PCR Array plate layout.
ABI TaqMan Assays used in real-time quantitative PCR (qPCR)
Table S2: Gene array in the Lipoprotein Signaling & Cholesterol Metabolism RT2 Profiler PCR Array (Qiagen)
Primers used for the cloning of luciferase reporter vectors
Table S4. Some of the predicted targets of the miR-23a~27a~24a cluster that are related to cholesterol homeostasis
Table S5. Expression of miRNA-23, miR-24-2 and miR-27a in different normal human organs assessed by qPCRa
Table S6: Results using the softwares TargetScan and miRanda to identify miR-27a targets in the LDLR pathway