Abstract
In myelinated axons, most of the voltage-gated ion channels are concentrated at the nodes of Ranvier, which are short gaps in the myelin sheath. This arrangement leads to saltatory conduction and a larger conduction velocity than in nonmyelinated axons. Intriguingly, axons in the peripheral nervous system that exceed about 2 μm in diameter exhibit a characteristic narrowing of the axon at nodes that results in a local reduction of the axonal cross-sectional area. The extent of constriction increases with increasing internodal axonal caliber, reaching a threefold reduction in diameter for the largest axons. In this paper, we use computational modeling to investigate the effect of nodal constrictions on axonal conduction velocity. For a fixed number of ion channels, we find that there is an optimal extent of nodal constriction which minimizes the internodal axon caliber that is required to achieve a given target conduction velocity, and we show that this is sensitive to the precise geometry of the axon and myelin sheath in the flanking paranodal regions. Thus axonal constrictions at nodes of Ranvier appear to be a biological adaptation to minimize axonal volume, thereby maximizing the spatial and metabolic efficiency of these processes, which can be a significant evolutionary constraint. We show that the optimal nodal morphologies are relatively insensitive to changes in the number of nodal sodium channels.
Keywords: axon morphology, computational modeling, nodal constrictions, node of Ranvier, conduction velocity
neurons signal to each other and to other cell types via action potentials, which are waves of membrane depolarization that propagate along long, slender projections called axons. Thus the speed of neuronal communication is limited by the axonal conduction velocity, and for long axons this can result in a significant delay. Two important ways in which animals maximize axonal conduction velocity are to increase axonal cross-sectional area, which reduces the internal resistance to the longitudinal diffusion of ions, and to myelinate axons, which allows for saltatory nerve conduction. Each of these strategies comes with metabolic costs (Hartline and Colman 2007). Large caliber axons require more metabolic investment for their growth and maintenance because of their larger volume and surface area, and they also increase body size. Myelination allows fast conduction velocities with much thinner axons, requiring less axonal metabolic investment and smaller body size, but this also requires metabolic investment in the growth and maintenance of the myelinating glia (Harris et al. 2012). Thus there are evolutionary constraints on the strategies that animals adopt to maximize axonal conduction velocity.
The myelin sheath of myelinated axons is discontinuous, consisting of discrete myelinated segments called internodes that are separated by short gaps called nodes of Ranvier, where the axon has direct access to the extracellular space (Arroyo and Scherer 2000; Poliak and Peles 2003; Salzer et al. 2008; Swärd et al. 1995). The voltage-gated sodium channels, which are responsible for the large inward current that generates the action potential, are largely confined to the nodes, where they are present at very high density. Each internode is myelinated by a single myelinating cell (Schwann cell), which extends a sheetlike protrusion that wraps the axon spirally. Immediately flanking each node are paranodal regions, where the myelin lamellae terminate in the form of paranodal loops that are linked to the axon membrane by specialized axo-glial junctions. Beyond the paranodal regions are the juxtaparanodal regions, which represent the edges of the compact myelin. The length of the internode increases with increasing internodal caliber and can exceed 1 mm for large axons, but the length of the nodal gap is generally about 1 μm, regardless of internodal caliber. Saltatory conduction arises because myelination decreases the membrane capacitance in the internode, allowing the transient depolarization of one node to trigger the transient depolarization of the next, thereby propagating the nerve impulse in a discontinuous manner. This results in a rapid propagation of action potentials at velocities of up to 100 m/s or more.
While the relationship between the electrophysiological function of myelinated axons and the spatial organization of their ion channels is understood fairly well, these axons exhibit additional anatomical features whose electrophysiological functions are not well understood. One of the most striking anatomical features of axons in the peripheral nervous system, which has been known for more than a century (Cajal 1899; Hess and Young 1952), is the narrowing of the axon at the nodes and the paranodes. The extent of these constrictions is minimal for axons below 2 μm in diameter but increases as axons expand, reaching threefold for the largest axons, which corresponds to a ninefold reduction in cross-sectional area (Berthold 1968; Berthold and Rydmark 1983a, 1983b; Bertram and Schröder 1993; Dun 1970; Rydmark 1981; Rydmark and Berthold 1983; Swärd et al. 1995).
Given the known dependence of the cable properties of axons on axonal cross-sectional area, it is interesting to ask what effect the constriction of axons at nodes of Ranvier may have on the propagation of the nerve impulse. This question has been addressed by Halter and Clark (1993) using computational modeling. A key result of their study was that constriction of axons at nodes of Ranvier increases axonal conduction velocity, and that there is an optimal extent of constriction at which the conduction velocity is maximal (see Fig. 3 in Halter and Clark 1993). Nodal radius was varied from 0.1 μm to about 6 μm, which corresponds to a 60-fold increase in nodal membrane surface area (if assumed to be cylindrical). However, the density of sodium channels was kept constant, leading to a corresponding 60-fold increase in the number of sodium channels. Moreover, the finding of an optimum extent of nodal constriction was dependent on the width of the periaxonal space between the axon and the myelin sheath and occurred only if this space was large enough. Hence, from this study, we do not know what the sole influence of nodal morphology is on conduction velocity. To address this, we have used computational modeling to investigate the influence of nodal morphology on axonal conduction velocity assuming a fixed number of sodium channels.
Fig. 3.
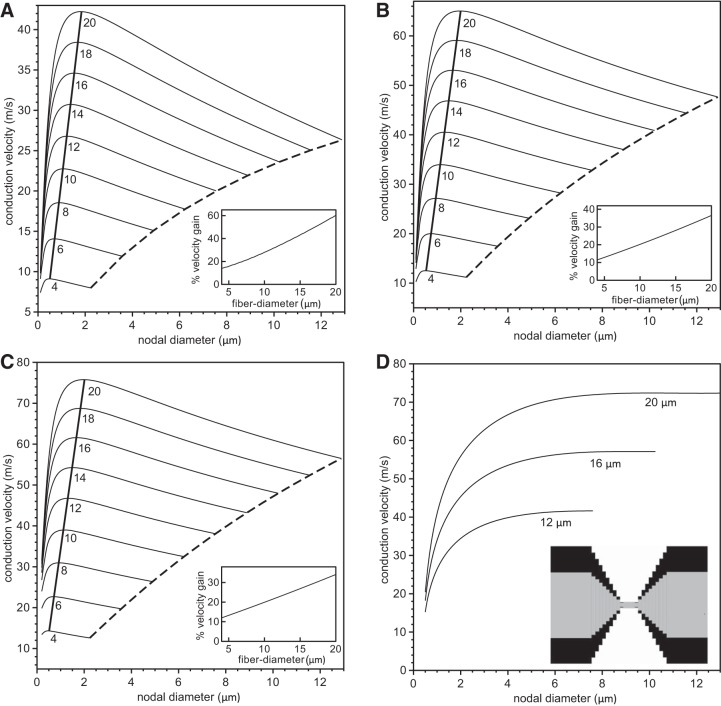
Analysis of velocity gain using a linear paranodal taper. The conduction velocity is plotted vs. nodal diameter for values of fiber diameter (internode plus twice the myelin thickness) ranging from 4 μm to 20 μm (indicated below each line) and 5 × 10³ nodal sodium channels (A), 1.5 × 10⁴ nodal sodium channels (B), and 2.5 × 10⁴ nodal sodium channels (C). The numbers below the curves indicate the fiber diameters. The dashed lines indicate velocities for unconstricted axons, i.e., where the nodal and internodal axon diameters are identical. The thick solid lines indicate the maximum conduction velocity for each fiber diameter. The insets in A–C indicate the percentage gain of conduction velocity compared with an unconstricted axon. In D, we show the conduction velocity as a function of the nodal diameter for three values of the fiber diameter with a constant specific sodium conductance of gNa = 3.0 S/cm2, i.e., when the numbers of nodal sodium channels increase linearly with the nodal diameter. The inset displays the linear tapering of the axon and myelin sheath in the PARA region.
METHODS
We used a cable-equation-based representation of a myelinated axon to study the dependence of conduction velocity on nodal, paranodal and juxtaparanodal axonal morphology. Berthold and Rydmark (1983a) compiled detailed information on the anatomy of nodes of Ranvier and their surrounding paranodal elements in feline spinal nerve root fibers. They divided the myelinated axon into four distinct regions, termed NODE, MYSA (“myelin sheath attachment”), FLUT (“fluted region”) and STIN (“stereotyped internode”). In modern terminology, the STIN corresponds to the internode where the axon is tightly ensheathed by myelin. The FLUT corresponds to the juxtaparanodal region where the voltage-gated potassium channels are localized, and the MYSA corresponds to the paranodal regions, where the myelin lamellae terminate in paranodal loops. Along the paranode, the axon diameter drops sharply to about 30–50% of its diameter in the internode (Berthold and Rydmark 1983a). The node of Ranvier is a 1-μm bare segment between the paranodes. The axon in this region has a barrellike shape, bulging slightly in the center relative to its proximal and distal ends (Rydmark and Berthold 1983). While the axon's juxtaparanodal regions were originally described to have a tapering diameter, more recent studies using freeze-substitution electron microscopy reveal a constant juxtaparanodal diameter, with tapering occurring in the paranodal regions (Okamura and Tsukita 1986; Sosinsky et al. 2005). In this paper, we will refer to these regions as INTER (internode), JUXTA (juxtaparanode), PARA (paranode) and NODE (node itself) as shown in Fig. 1.
Fig. 1.
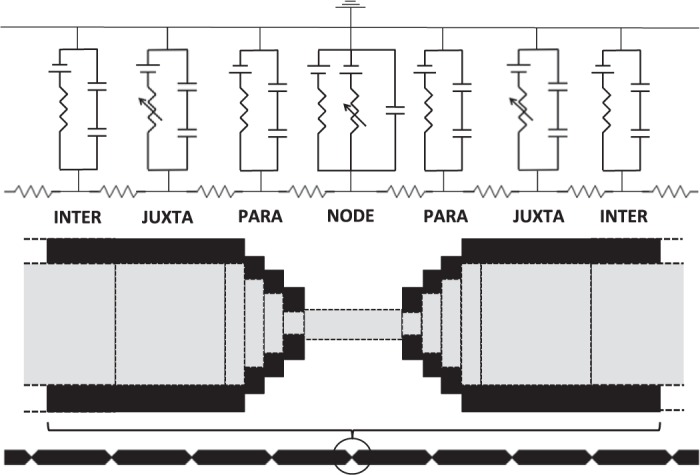
The single-cable model. We simulated a generic axon fiber, consisting of 30 repeating INTER-JUXTA-PARA-NODE-PARA-JUXTA-INTER sections. Nodes contained fixed numbers of sodium channels (5 × 10³, 1.5 × 10⁴, or 2.5 × 10⁴), which have fast Na+ membrane dynamics and a linear leak conductance. JUXTA sections contained fast-gated potassium channels. While all sections contained a membrane capacitance in parallel with their respective conductance, nonnodal regions contained two capacitors in series, one representing the myelin capacitance Cmyelin, and the other representing the membrane capacitance Cmem. The figure is not to scale. INTER, internode; JUXTA, juxtaparanode; PARA, paranode; and NODE, node itself.
Previous studies of electrical phenomena in myelinated nerve fibers have used geometric representations that explicitly defined sections of the axon corresponding to the nodal, paranodal, juxtaparanodal and internodal compartments (Halter and Clark 1993; McIntyre et al. 2002; Okamura and Tsukita 1986; Sosinsky et al. 2005). The geometry of the models in Halter and Clark (1993) and Nygren and Halter (1999) is based on the anatomical data provided in Berthold and Rydmark (1983a). Their models are multicable models, which consider that current flows radially across the axon membrane and the myelin, and longitudinally down the axon, the periaxonal space, and the extracellular space. McIntyre et al. (2002) used a similar double-cable model but without the longitudinal current flow in the extracellular space. Given the large resistance of the myelin, little transmembrane potassium current is conducted across the myelin. Consequently, we replaced the double-cable model in McIntyre et al. (2002) (see their Fig. 1) by a single-cable model with the axon and myelin capacitance in series (Fig. 1), and we accounted for the resistance of the periaxonal space with a reduced potassium conductance per channel.
The resulting single-cable model was implemented using the NEURON software package, version 7.2 (Carnevale and Hines 2006; Hines and Carnevale 1997). NEURON's default implicit integration method was applied with a time-step of 0.5 μs. We designed an axon model consisting of 30 identical axon sections. Each fiber section was composed of a node (NODE), a paranodal region (PARA), a juxtanodal region (JUXTA), and a central internodal region (INTER). These regions were organized in a sequential INTER-JUXTA-PARA-NODE-PARA-JUXTA-INTER structure (Fig. 1). The length of PARA was fixed at 4 μm, JUXTA at 75 μm and the NODE at 1 μm.
To simulate the barrellike shape of the axon in the NODE region, we used the experimental measurements of Rydmark and Berthold (1983) in which the maximum height of the nodal outbulging h was found to vary inversely with respect to nodal diameter Dn. Merging their data for nodes in dorsal and ventral nerve roots, we obtained the least squares fit h/Dn = 0.162·exp(−0.395·Dn). In our simulations, we used this formula to determine h for a given nodal diameter Dn and then modeled the bulge by assigning the NODE region a uniform diameter Dn + 2h. A correlation between the bulging and the nodal diameter was also found in Okamura and Tsukita (1986).
For the tapering of the myelin and the fiber/axonal diameters along the PARA from JUXTA to NODE, we used three different geometries (see Fig. 2A). The first geometry was a linear taper, in which the axon diameter and fiber diameter decreased linearly. The second geometry was a nonlinear taper in which the fiber diameter decreased slowly initially and then more rapidly near the NODE, and the axonal diameter decreased rapidly initially and then more slowly near the NODE. In this case, the fiber diameter in the PARA region was modeled as a sinusoid DfiberPARA(x) = (Dfiber − Dnode)·sin(πx/2LPARA) + Dnode, where x = 0 at the NODE, x = LPARA at the JUXTA-side of PARA, and LPARA = 4 μm. Dfiber is the fiber diameter in the INTER, Dnode is the nodal diameter, and LPARA is PARA length. The corresponding axon diameter was modeled as an exponential function DaxonPARA(x) = Dmin·exp[(x/LPARA)·ln(Daxon/Dmin)], where Dmin is the smallest diameter of the axon next to the NODES (x = 0), and Daxon is the axon diameter in the INTER (x = LPARA). The third geometry was an abrupt steplike narrowing of the axon diameter at the JUXTA:PARA interface. In each of the three different geometries, the myelin thickness along the PARA was taken as the difference between the corresponding fiber diameter and axon diameter, 2ΔmyelinPARA(x) = DfiberPARA(x) − DaxonPARA(x).
Fig. 2.
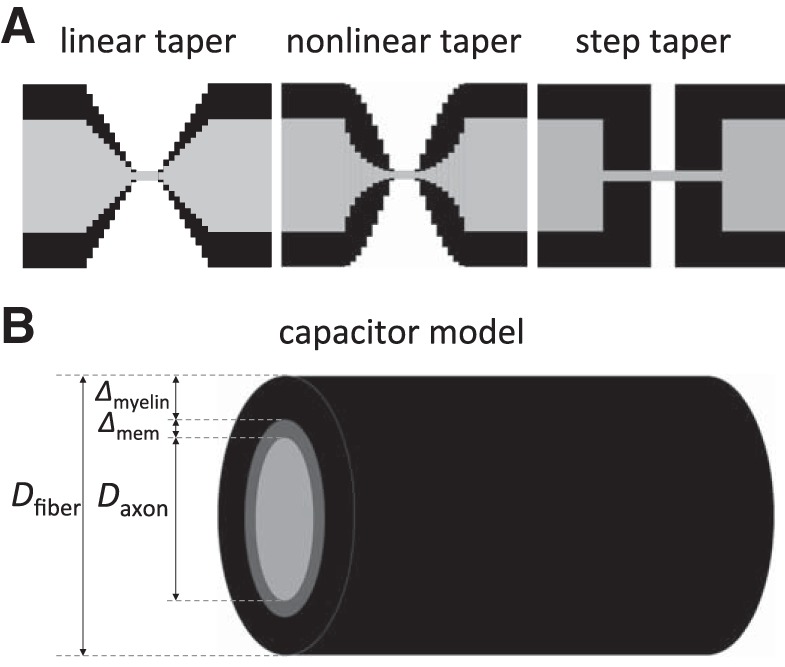
Representation of the node and internode regions. A: the three tapering designs of the axons and the myelin around the nodes of Ranvier used in this study. B: the cylindrical capacitor model for the internode. The axon fiber consists of the axon (the inner core) with diameter Daxon, the membrane with thickness Δmem, and a layer of myelin of thickness Δmyelin generating the outer cylinder. The fiber diameter Dfiber is then determined by Dfiber = Daxon + 2 Δmem + 2 Δmyelin ≈ Daxon + 2 Δmyelin.
The internodal region's capacitance was modeled as an equivalent capacitance for two capacitors in series: one representing the intracellular-to-membrane boundary, and the other representing the membrane-to-myelin boundary (see Fig. 2B). Each region was treated as a cylindrical conductor, whose capacitance per unit length was given by
| (1) |
where Dout is the diameter of the outer cylinder, Din is the diameter of the inner cylinder, ε0 is the permittivity of empty space, and εr is the relative dielectric constant (Griffith 2013).
For the capacitor representing the plasma membrane of the axon, the diameters of the outside and inside cylinders are much larger than their difference, i.e., the membrane thickness Δmem. Expanding the logarithm, i.e., ln(Dout/Din) = ln[(Daxon + 2 Δmem)/Daxon] ≈ 2 Δmem/Daxon, yields then, for the capacitance per length,
| (2) |
and for the specific capacitance of the membrane (capacitance per unit area) cmem = C̃mem/(πDaxon) = εmemε0/Dmem, which for a typical value of εmem gives the commonly used value 1 μF/cm2. We used this value for the specific capacitance of the plasma membrane at the NODE and INTER.
In the INTER, the additional capacitor in series with the membrane capacitor has a capacitance per length given by
| (3) |
where Dfiber is the diameter of the entire fiber (axon and myelin sheath), Daxon is the diameter of the axon (we neglected the membrane thickness), and εmyelin is the relative dielectric constant of the myelin. Reported values for the relative dielectric constant of the myelin range from 5 to 15 (Basser and Roth 1991; Min et al. 2009). In this study we choose εmyelin = 10. The specific capacitance of the myelin, cmyelin, is then given by cmyelin = C̃myelin/(πDfiber).
To determine the diameter of the fiber Dfiber for a given axon diameter, we generated a linear regression of the reported data (Berthold et al. 1983), i.e.
| (4) |
which we used as a lookup table. The corresponding myelin capacitance, C̃myelin, then follows from Eq. 3.
For the computational modeling, we needed the capacitance per length for our double capacitor model (see Fig. 2B). Combining Eqs. 2 and 3, and dividing by the circumference of the fiber, the specific equivalent capacitance is obtained as
| (5) |
where cmyelin and cmem are the specific myelin and membrane capacitances, respectively.
Replacing Dfiber/Daxon using Eq. 3, we finally find
| (6) |
where we have assumed that the specific capacitance of the NODE compartment cnode is equal to the specific capacitance of the membrane capacitor in the INTER. Given the fiber diameter, we used this expression for the specific capacitance of the fiber.
We defined the number of sodium channels as NNa and the number of potassium channels as NK. Then NNa sodium ion channels with a conductance of gNa = 20 pS each were placed in the NODE region, and NK potassium ion channels with a conductance of gK = 20 pS were placed in the JUXTA region (Rasband and Shrager 2000). The conductance and voltage-dependent dynamics were modeled using the Hodgkin-Huxley framework (Hodgkin and Huxley 1952). The sodium and potassium currents are given by
| (7) |
where VNa and VK denote the sodium and potassium reversal potentials, V the membrane potential, and n1, n2, n3 gating variables satisfying the set of differential equations
| (8) |
where αi(V) and βi(V) are defined as in McIntyre et al. (2002).
| (9) |
A leak current density of the form
| (10) |
was added to the nodal compartment, with leak conductance gleak = 0.007 S/cm2 (McIntyre et al. 2002).
RESULTS
We first examined the role of nodal diameter on conduction velocity with the number of ion channels and all other parameters held constant. We used the above-mentioned single-channel conductances and took the number of potassium channels in the JUXTA region to be 250, which is within the range of numbers extracted from previous work (McIntyre et al. 2002). The NODE specific capacitance was chosen to be 1 μF/cm2. A current stimulus, between 1 nA and 5 nA, was then applied in the first NODE region, triggering a healthy action potential, and average conduction velocities were calculated by measuring time for an action potential to pass from node 5 to node 25. Conduction velocity as a function of nodal diameter is shown in Fig. 3 for 5 × 10³ (A), 1.5 × 10⁴ (B), and 2.5 × 10⁴ (C) nodal sodium ion channels, each for a range of fiber diameters (diameter of internodal axon plus myelin sheath) with linear tapering of both the axon and myelin sheath in the PARA. For a given fiber diameter, the conduction velocity increases with increasing nodal diameter until it reaches a maximum velocity and then decreases with increasing nodal diameter. At a fixed nodal diameter, the conduction velocity is invariably larger for larger fiber diameters. The dashed curves in Fig. 3, A–C, denote the conduction velocities for unconstricted axons, i.e., when the internodal and nodal diameters are identical. The thick solid lines are the curves for the maximal velocities, which vary linearly with respect to fiber diameter. This indicates that the optimal nodal diameter increases with increasing fiber diameter. For comparison, we show in Fig. 3D the conduction velocity vs. nodal diameter for three different fiber diameters, keeping the NODE sodium channel density and JUXTA potassium channel density constant so as to yield conductances of gNa = 3 S/cm2 and gK = 1.64 × 10⁻⁴ S/cm2, respectively. The potassium channel conductance was based on the value of gK = 0.08 S/cm2 used in McIntyre et al. (2002), but adjusted to account for the fact that in our model the potassium channels are distributed over a longer and fatter JUXTA (i.e., at a lower density) compared with the NODE. In agreement with the findings in Halter and Clark (1993) for a vanishingly small periaxonal space, we found a monotonic increase in conduction velocity and no optimal nodal constriction.
The emergence of a maximal conduction velocity at an optimal nodal diameter can be explained as follows. For decreasing and vanishingly small nodal diameters, the conduction velocity will decrease to zero because of the increasing intra-axonal resistance. Conversely, for increasing nodal diameters, the total nodal capacitance will increase, resulting in a slower action potential upstroke and hence a smaller conduction velocity. These two opposing trends result in the observed peak for the conduction velocity. In support of this interpretation, we did not observe optimal nodal diameters if we kept the nodal capacitance artificially constant as we increased the nodal diameter (data not shown).
To better quantify the gain in conduction velocity due to axonal constriction at nodes of Ranvier, we calculated the increase in the conduction velocity for a fiber with an optimal nodal constriction compared with an equivalent fiber with no nodal constriction [i.e., when Dnode = Dinternode (dashed lines in Fig. 3, A–C)] and then plotted this increase vs. the fiber diameter (see insets in Fig. 3, A–C). We found that larger fibers exhibit a larger gain in conduction velocity than smaller fibers. For fibers of 20 μm diameter, the gain was 60% in the case of 5 × 10³ nodal sodium channels (see inset in Fig. 3A). Generally, the smaller the number of nodal sodium channels, the larger the velocity gain.
From Fig. 3 we observe that a given conduction velocity can be obtained generally with two different nodal diameters given a specific value of the fiber diameter. This raises the question of what cable morphologies are associated with a given target conduction velocity. To address this, we calculated the isoconduction velocity contour lines in the two-dimensional Cartesian plane of internodal vs. nodal diameters. Such curves are shown in Fig. 4 for target conduction velocities ranging from 10 m/s to 75 m/s and 5 × 10³ (A), 1.5 × 10⁴ (B), and 2.5 × 10⁴ (C) nodal sodium channels. Starting with an unconstricted axon (dashed lines), i.e., when the nodal diameter is equal to internodal diameter, a decrease in the nodal diameter also allows a decrease in the internodal diameter, although by a smaller amount, until a minimum is reached. The minima of the curves in Fig. 4 represent the fiber morphologies that yield a given target conduction velocity with the smallest internodal diameter and hence with the smallest possible fiber diameter. With further decreases in nodal diameter, the required internodal diameter increases again. Thus nodal constrictions allow axons, with a constant number of ion channels, to reduce their volume without any loss in electrical performance (specifically conduction velocity). To quantify the space-savings, we plot in the insets of Fig. 4 the percentage increase in the fiber volume (axon plus myelin sheath), i.e., the spatial cost, that is necessary for an unconstricted axon to achieve the same conduction velocity as an axon with optimal nodal constrictions. The largest benefit of nodal constriction (i.e., the highest spatial cost for an unconstricted axon) is found for the smallest number of nodal sodium channels (compare the insets in Fig. 4, A–C).
Fig. 4.
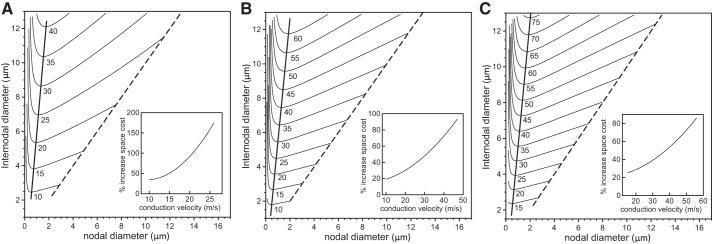
Analysis of space cost using a linear paranodal taper. We show the contour lines of constant conduction velocity on the Cartesian plane of internodal axon diameter vs. nodal diameter for a range of conduction velocities and 5 × 10³ nodal sodium channels (A), 1.5 × 10⁴ nodal sodium channels (B), or 2.5 × 10⁴ nodal sodium channels (C). The numbers below the lines indicate the target conduction velocities. The nodal and internodal diameters are identical on the dashed line. The thick solid lines indicate fiber morphologies with the minimal internodal axon diameter for the given target conduction velocities. The insets indicate the percentage increase in volume (i.e., spatial cost) for an unconstricted axon (internodal diameter = nodal diameter) compared with an axon with optimal nodal constrictions.
The thick solid lines connecting the minima in Fig. 4 indicate optimal fiber morphologies in terms of space usage. Since a minimal internodal diameter in Fig. 4 is the smallest possible internodal diameter for the axons to conduct at a given velocity, this conduction velocity must also be the maximum of the graph in Fig. 3 if plotted for that minimal internodal diameter. In more mathematical terms, if the conduction velocity as a function of nodal diameter x and internodal diameter y is denoted by v(x,y), the contour lines in Fig. 4 are characterized by dv = (∂v/∂x)dx + (∂v/∂y)dy or equivalently y′(x) = −(∂v/∂x)/(∂v/∂y). The maximum of the conduction velocity v as a function of the nodal diameter x at a fixed internodal diameter y occurs when ∂v/∂x = 0, i.e., exactly at the same nodal diameter where the contour lines in Fig. 4 exhibit a minimum. For example, from Fig. 4C we find for a target velocity of 55 m/s an optimal morphology with an internodal diameter of 9 μm and a nodal diameter of 1.5 μm. The corresponding fiber diameter can be obtained from Eq. 4 as Dfiber = 14.2 μm. Consistent with this, we find in Fig. 3C that the maximum conduction velocity of a 14-μm fiber is 55 m/s for a nodal diameter of 1.5 μm. In conclusion, the fiber morphologies that maximize the conduction velocities also minimize the space cost.
The above simulations were obtained assuming an idealized nodal morphology in which the axon and myelin sheath were assumed to taper linearly in the PARA region as described in methods. To explore the effect of deviations from this idealized morphology on the optimal nodal constrictions, we repeated our simulations with a nonlinear tapering in which the axonal diameter in the PARA region decreases according to an exponential function and the fiber diameter in the PARA decreases according to a sine function (see methods). Such tapering better resembles the micrographs in Sosinsky et al. (2005). In Fig. 5A, we show the conduction velocity vs. nodal diameter for a range of fiber sizes and a fixed number of 5 × 10³ nodal sodium channels. While the general behavior is the same as reported in Fig. 3A, the conduction velocities are larger, and the increase in conduction velocity generated by the nodal constriction is smaller. This is due to differences in the capacitance of the myelin in the PARA region. In Fig. 5B we show contour lines of constant conduction velocity. As in Fig. 4, we find that there is one minimal internodal diameter for each target conduction velocity. The extent of constriction at the NODES is, however, smaller. For example, for an axon with an internodal diameter of 9 μm and a fixed number of 5 × 10³ nodal sodium channels, the optimal nodal diameter is about 1.4 μm (i.e., a 6.4-fold constriction) with linear tapering of the axon and sheath in the PARA, and about 1.7 μm (i.e., a 5.3-fold constriction) with nonlinear tapering.
Fig. 5.
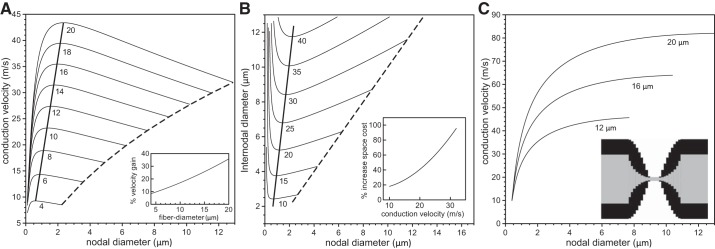
Analysis of velocity gain and space cost for a nonlinear paranodal taper. In A, the conduction velocity is plotted against the nodal diameters for values of fiber diameter ranging from 4 μm to 20 μm (indicated below each line) and 5 × 10³ nodal sodium channels. The dashed lines in A indicate velocities for an unconstricted fiber, i.e., an axon with identical nodal and internodal diameters. The thick solid line indicates the velocities of fibers optimized for maximum conduction velocities. The inset in A indicates the percentage gain in conduction velocity for a range of fiber diameters compared with a fiber with an unconstricted axon. In B, we show contour lines of constant conduction velocity on the Cartesian plane of nodal diameter vs. internodal diameter for conduction velocities ranging from 10 m/s to 40 m/s (indicated below each line) and 5 × 10³ nodal sodium channels. The nodal and internodal axon diameters are identical on the dashed line. The thick solid lines indicate fiber morphologies with the minimal internodal axon diameter for the given target conduction velocities. The insets indicate the percentage increase in volume (i.e., spatial cost) for an unconstricted axon (internodal diameter = nodal diameter) compared with an axon with optimal nodal constrictions. In C, we show the conduction velocity as a function of the nodal diameter for three values of the fiber diameter when the sodium channel density is constant, i.e., when the numbers of nodal sodium channels increase linearly with the nodal diameter. The inset displays the nonlinear tapering of the axon and myelin in the PARA region.
Finally, we considered the case of a step-taper, where the axon diameter decreases abruptly from the internodal diameter to the nodal diameter at the JUXTA:PARA interface and the myelin ends abruptly at the PARA:NODE interface (Fig. 6). The results are qualitatively similar to those for the other tapers. The maximum velocities occur at larger nodal diameters, and the optimal fibers have a larger nodal diameter than for the linear and nonlinear tapers. For the same example as above (i.e., a 9 μm internodal axon diameter and 5 × 10³ sodium channels), the optimal nodal axon diameter is about 2.5 μm, i.e., a 3.6-fold constriction.
Fig. 6.
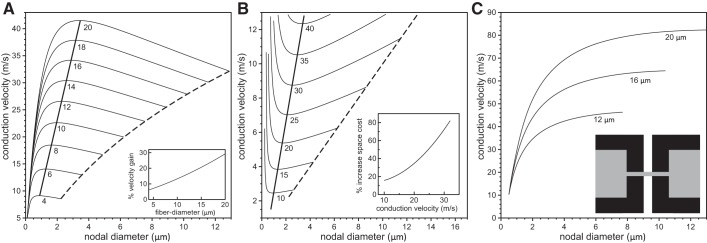
Analysis of velocity gain and space cost for a steplike taper. In A, the conduction velocity is plotted against the nodal diameters for values of fiber diameter ranging from 4 μm to 20 μm (indicated below each line) and 5 × 10³ nodal sodium channels. The dashed lines in A indicate velocities for an unconstricted fiber, i.e., an axon with identical nodal and internodal diameters. The thick solid line indicates the velocities of fibers optimized for maximum conduction velocities. The inset in A indicates the percent gain in conduction velocity for a range of fiber diameters compared with a fiber with an unconstricted axon. In B, we show contour lines of constant conduction velocity on the Cartesian plane of nodal diameter vs. internodal diameter for conduction velocities ranging from 10 m/s to 40 m/s (indicated below each line) and 5 × 10³ nodal sodium channels. The nodal and internodal axon diameters are identical on the dashed line. The thick solid line indicates fiber morphologies with the minimal internodal axon diameter for the given target conduction velocities. The inset indicates the percentage increase in volume (i.e., spatial cost) for an unconstricted axon (internodal diameter = nodal diameter) compared with an axon with optimal nodal constrictions. In C, we show the conduction velocity as a function of the nodal diameter for three values of the fiber diameter when the sodium channel density is constant, i.e., when the numbers of nodal sodium channels increase linearly with the nodal diameter. The inset displays the steplike tapering of the axon and myelin in the PARA region.
What is remarkable about these findings is the sensitivity of the conduction velocity to details of the nodal ultra-structure. For a 20 μm fiber with 5 × 10³ nodal sodium channels, a linear taper promotes a conduction velocity gain of 60% compared with an unconstricted axon, whereas for a nonlinear taper the gain is ∼35% (compare Figs. 3A and 5A). The corresponding conduction velocities for the nonlinear taper are between 5 and 20% higher than for the linear taper, depending on the extent of the nodal constriction.
When the density of nodal sodium channels, instead of the number of nodal sodium channels, is held constant, we again find a monotonic increase in conduction velocity with increasing nodal diameter (Fig. 5C). But here again the nodal morphology is an important influence on the conduction velocity. For example, for a 20-μm fiber with a nodal diameter of 12 μm, the conduction velocity is about 15% larger for a nonlinear taper compared with a linear taper. Thus the precise morphology of the axon and myelin sheath in the PARA has a significant effect on the conduction velocity of myelinated axons.
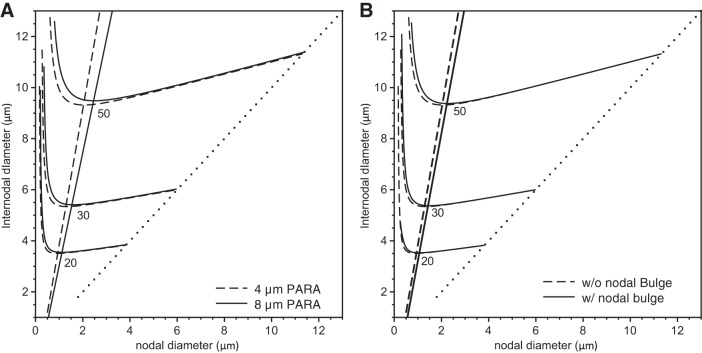
In light of these findings on the sensitivity of the conduction velocity to the shape of the paranodal taper, we investigated if there was also any significant effect of altering the length of these regions. Generally speaking, the PARA region, where the myelin terminates, is considered to be on the order of a few micrometers, but in fact this varies (e.g., Okamura and Tsukita 1986). Thus we repeated our simulations with an extended PARA region length of 8 μm, while still maintaining the same NODE-NODE separation (i.e., INTER length) of 1 mm. The behavior was qualitatively similar to that seen in Figs. 3–6, but for a given fiber diameter, the corresponding optimal nodal diameters were about 15–20% higher. In Fig. 7A, we show the conduction velocity contours at three different conduction velocities for fibers with our standard 4-μm paranodal length compared with fibers having an extended 8-μm paranodal length. The percent increase in the optimal nodal diameters is higher for larger fibers.
Fig. 7.
Analysis of the effects of an extended PARA length or a nodal bulge. We show the contour lines of constant conduction velocity on the Cartesian plane of internodal diameter vs. nodal diameter for conduction velocities of 20 m/s, 30 m/s, and 50 m/s (indicated below each line) and 1.5 × 10⁴ nodal sodium channels. The nodal and internodal diameters are identical on the dotted line. The solid lines represent simulations in the presence of an extended PARA length (A) or a nodal bulge (B), while the dashed lines indicate simulations in their absence.
Given the above findings for the axon and sheath morphology in the PARA region, we also investigated the effect of the slight axonal bulging that has been reported at nodes of Ranvier (Rydmark and Berthold 1983). In Fig. 7B, we compare the conduction velocity contour lines, now with and without a nodal bulge, and find that nodal bulging has an effect similar to that seen when extending the length of the PARA regions, although smaller in magnitude.
In the above simulations, we held the number of sodium channels at the NODES constant when we varied nodal and internodal diameter, but in reality we fully expect that the number will increase with increasing nodal surface area. Therefore, we investigated how the optimal node designs discussed above depend on the number of nodal sodium channels. In Fig. 8, we show the lines of optimal design for 5 × 10³ sodium channels (dot-dashed line), 1.5 × 10⁴ sodium channels (long dashed line) and 2.5 × 10⁴ sodium channels (solid line) for a nonlinear-tapering arrangement. The similarity in the slopes of these lines indicates that the optimal extent of nodal constriction is not very sensitive to the number of sodium channels. This suggests that an increase in nodal sodium channel number with increasing axonal caliber would not be expected to change the optimal morphological design of these fibers significantly.
Fig. 8.
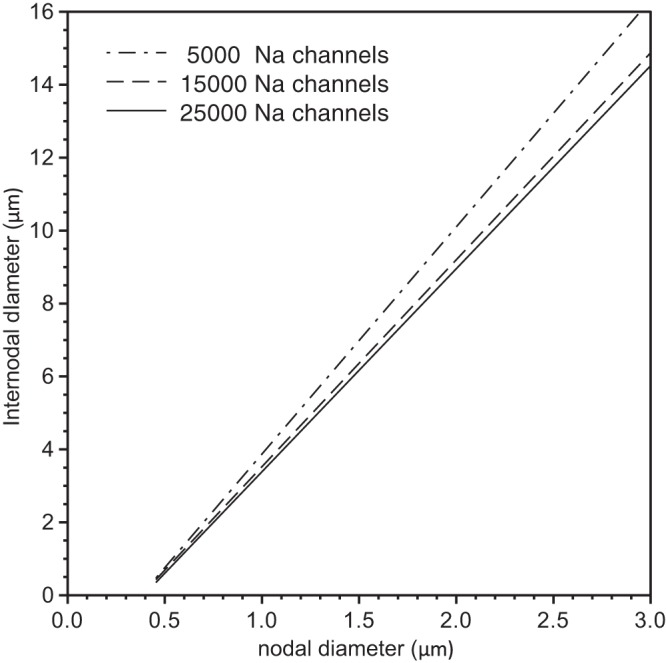
Analysis of the effect of sodium channel number on the optimal fiber morphology. We show the computed lines of optimal fiber morphologies for a nonlinear tapering of the axon and myelin sheath in PARA (see inset Fig. 5C) and 5 × 10³ (dot-dashed line), 1.5 × 10⁴ (dashed line), and 2.5 × 10⁴ (solid line) nodal sodium channels.
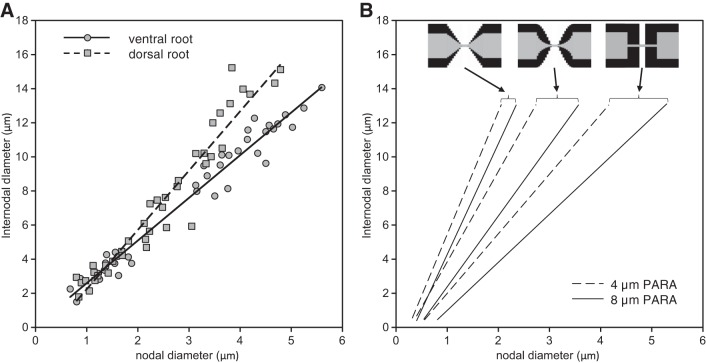
We then compared our optimal designs with “real” myelinated fibers. We used the experimental data of Rydmark (1981) for nodal and internodal diameters in axons of dorsal and ventral cat spinal nerve roots, plotted in Fig. 9A. While there is scatter in the data, in both cases the data can be fitted well with a linear regression line. This shows that the linear relationship between nodal and internodal diameter seen for the optimal fiber morphologies in our simulations is also observed in real axons.
Fig. 9.
Comparison of actual and predicted fiber morphologies. In A, we show morphological data for feline dorsal spinal nerve root (squares) and ventral spinal nerve root (circles) extracted from Figs. 1 and 2 of Rydmark (1981). In B, we show the computed lines of optimal fiber morphologies for a linear tapering of the axon and myelin sheath in the PARA region (left-most solid/dashed lines), for a nonlinear tapering (middle solid/dashed lines), and for an abrupt steplike narrowing of the axon and myelin sheath at the JUXTA:PARA interface (right-most solid/dashed lines). The dashed lines represent fibers having a 4-μm PARA region length, and the solid lines represent fibers having an extended 8-μm PARA region length. The arrows indicate the corresponding tapering method used.
We note that the slope of the lines relating nodal and internodal diameter in Fig. 9A are different in dorsal nerve roots (which are composed of sensory axons) and ventral nerve roots (which are composed of motor axons). In view of the insensitivity of the optimal fiber designs with respect to numbers of ion channels and the sensitivity of these designs to the nodal and paranodal morphology, we investigated whether these differences could be accounted for by differences in the morphology of the paranodal regions. The results are shown in Fig. 9B. The slope of the line representing the optimal fiber design is largest for a linear taper (left-most solid/dashed lines), and smallest for an abrupt steplike taper (right-most solid/dashed lines), with the slopes for a nonlinear tapering design somewhere in between (middle solid/dashed lines). As shown above, for each tapering morphology the slope was lower for 8-μm-long PARA regions (solid lines) than for 4-μm-long PARA regions (dashed lines). Moreover, the range of these slopes (about 2.6-fold) is more than the difference between the dorsal and ventral nerve root axons (about 1.4-fold). Thus the difference in the slope of the linear relation between nodal and internodal diameter for dorsal and ventral nerve roots could be explained by differences in local structure of the axons and their myelin sheaths near the nodes of Ranvier without changing the number of required nodal sodium channels.
While the above analysis indicates that the optimal fiber morphology at nodal constrictions is relatively insensitive to changes in the number of sodium channels, increasing the number of sodium channels does increase the axonal conduction velocity. Thus we investigated how many additional nodal sodium channels would be required to match the effect of nodal constrictions. In Fig. 10B, we plot the internodal axon diameter required to generate a conduction velocity of 25 m/s vs. nodal sodium channel number for axons with no nodal constrictions (“uniform cable”; top curve) and for axons with optimal nodal constrictions (“constricted cable”; bottom curve). The horizontal difference between the two curves represents the number of additional channels needed for a given axon diameter (vertical axis). For example, for an internodal diameter of 7 μm, an axon with no nodal constrictions would require 3,900 nodal sodium channels in addition to the 5,000 channels for the optimal cable, an increase of 76%. For smaller fibers, the horizontal distance between the curves increases, indicating that more additional channels are required to attain the same conduction velocity. To address how the required number of additional channels depends on the target conduction velocity, we plot in Fig. 10A the conduction velocity vs. the number of nodal sodium channels for an axon with an internodal diameter of 12.9 μm and optimal nodal constrictions (“constricted cable”; top curve) or no nodal constrictions (“uniform cable”; bottom curve). As above, the horizontal distance between the curves depicts the numbers of additional channels required for an axon with no nodal constrictions to generate the same conduction velocity. For example, 6,000 additional channels are needed for a conduction velocity of about 45 m/s, an increase of 120%. At larger conduction velocities, the horizontal distance between the curves increases, indicating that even more sodium channels are required to attain the same conduction velocity. Thus, in addition to increasing the conduction velocity for a given internodal axon diameter, nodal constrictions also reduce substantially the number of required sodium channels for a target conduction speed.
Fig. 10.
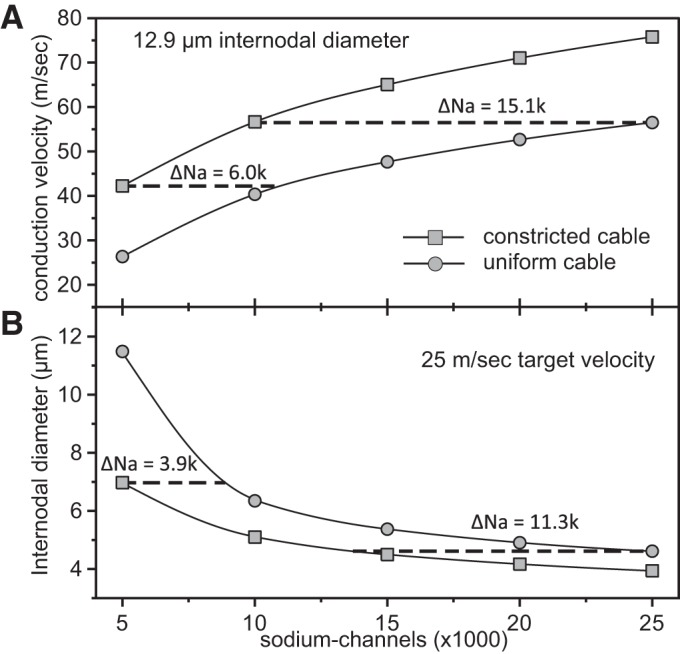
Analysis of the number of additional nodal sodium channels required to match the conduction velocity gains resulting from optimal nodal constrictions. A: the conduction velocity of a 20 μm fiber (12.9 μm internodal diameter) is plotted vs. the number of nodal sodium channels for an optimal (constricted) cable and an unconstricted (uniform) cable. For a specified conduction velocity (vertical axis), the horizontal distance between the two curves represents the number of additional sodium channels needed for the uniform cable. B: the necessary internodal diameter for a conduction speed of 25 m/s is shown as a function of the number of nodal sodium channels for the optimal cable and the uniform cable. For a specified internodal diameter (vertical axis), the horizontal distance between the curves represents the number of additional sodium channels needed for the uniform cable to conduct with the same speed of 25 m/s.
DISCUSSION
The fact that myelinated axons in the peripheral nervous system are constricted at nodes of Ranvier has been recognized for more than a century (Cajal 1899; Hess and Young 1952), but only a few studies have addressed its physiological significance. Dun (1970) appears to have been the first to speculate that these constrictions may influence nerve conduction. Moore et al. (1978) investigated this using computational modeling and concluded that nodal conduction is insensitive to nodal constriction, but Halter and Clark (1993) showed that, when the detailed ultrastructure of nodes and their flanking regions is taken into account, nodal constrictions are predicted to increase axonal conduction velocity for a given fiber diameter, and there is an optimal extent of constriction at which the conduction velocity is maximal. However, as we noted in the Introduction, the latter study did not reveal the sole influence of nodal morphology on conduction velocity because the number of nodal sodium channels was varied linearly with nodal diameter.
In the present study, we extended the analysis of Halter and Clark by investigating the influence of nodal morphology on conduction velocity for a fixed number of sodium channels per node. We confirmed that for any given axon there is an optimal extent of nodal constriction that minimizes the internodal caliber required to achieve a give target velocity, and we found that this is relatively insensitive to the number of sodium channels. However, in contrast to Halter and Clark (1993), these finding were independent of assumptions about the size and the organization of the periaxonal space. For nodal diameters larger or smaller than the optimal value, the conduction velocity decreased. While linear cable theory (Koch 2004) does not apply directly to heterogeneous cables, it suggests that the cause of this decrease may be an increase in nodal capacitance because conduction velocity is inversely proportional to membrane capacitance (for a recent review on axon physiology, see Debanne et al. 2011). We verified this assertion through computer simulations for a nodal capacitance held artificially constant as we increased the nodal diameter (data not shown).
To explore the benefit of nodal constrictions for axonal physiology, we compared the conduction velocities of fibers with optimal nodal constrictions to the conduction velocities of fibers with the same internodal diameter but with no nodal constrictions. The difference between these two conduction velocities represents the conduction velocity “gain” attributable to the nodal constriction. We found that the gain in conduction velocity increased with increasing fiber diameter and could be very substantial. The magnitude of the gain in conduction velocity depended on the number of nodal sodium channels, i.e., for small numbers of sodium channels, we found a larger gain in conduction velocity. Hence, nodal constrictions have the greatest benefit for the largest axons with low numbers of nodal sodium channels.
The longest axons in the peripheral nervous system can represent more than 99.9% of the neuronal cytoplasmic volume (Cleveland 1996), and thus axons can represent a major metabolic drain on neuronal metabolism. While one effect of axonal constriction at nodes of Ranvier is to increase the axonal conduction velocity, our analyses highlight another and perhaps even more important benefit, which is to minimize the fiber volume. In this way, nodal constrictions reduce the metabolic investment required to form and maintain their processes. Our analyses indicate that this cost reduction is realized in multiple ways, including a decrease in the volume of axonal cytoplasm (due to a decrease in the internodal axon caliber required to attain a given target conduction velocity), a corresponding decrease in myelin sheath thickness (due to the constant ratio between axon diameter and the myelin sheath thickness; see Eq. 4), and a decrease in the number of nodal sodium channels (due to the decrease in nodal volume).
Remarkably, the curves of all optimal fiber morphologies corresponding to a fixed given number of sodium and potassium channels showed a linear relationship within the accuracy of our computations (see solid lines in Fig. 4, A–C, and Fig. 5B). Each point on these straight lines represents an optimal fiber morphology, but for a different target conduction velocity. While the linearity held over a wide range of numbers of nodal sodium channels (as far as tested), the slopes of the lines changed only slightly (see Fig. 8). Such a linear relationship between internodal and nodal diameter has also been shown in experimental studies (Rydmark 1981), as shown in Fig. 9A. It is not valid to compare our simulations directly with this experimental data because we do not know that our model faithfully describes the precise morphology and physiology in those axons, but it is nonetheless noteworthy that the slopes are comparable (compare Figs. 9A and 9B). In other words, the extent of nodal constriction in real axons (∼2- to 4-fold, based on the slopes in Fig. 8A) is similar to the optimum constrictions predicted by our model (∼2- to 6-fold, depending on the paranodal geometry). Thus, while we cannot say that the nodal morphology in real axons is optimal, we can say that real axons appear to follow the general design principles predicted by our model.
We noted in the results that the slope of the linear relationship between the internodal and nodal diameter in the data of Rydmark and Berthold (Rydmark 1981) was different for axons in dorsal roots compared with ventral roots. While such differences in slope could in principle result from (large) differences in the numbers of nodal sodium channels in these axons, there could be other factors. We thus investigated factors that influence the slopes of the lines of optimal fiber morphology in our computational model. The optimal morphologies were sensitive to the choice of nodal capacitance (data not shown), but this was determined by the specific capacitance of the membrane only, which is not expected to vary much. However, the optimal morphologies were also very sensitive to the precise geometry of the axon and myelin taper in the paranodal region, which could well vary considerably. For example, while the relationship between the nodal and internodal diameters of the optimal fiber designs was linear for all tapering morphologies examined, the slopes were ∼100–130% greater for the linear tapers compared with the steplike tapers, and ∼50% greater for the nonlinear tapers (Fig. 9B). This sensitivity results from the fact that the characteristic time constant associated with the effective paranodal capacitance is determined by the geometry of the entire paranodal structure, and this influences the voltage experienced by the sodium channels concentrated in the node. Thus it is possible that the difference in the slope of internodal vs. nodal diameter between axons in dorsal and ventral roots noted above was due to differences in the morphology of the axon and sheath flanking the node. A detailed ultrastructural mapping of the morphology and electrical parameters of nodes and paranodes in dorsal and ventral nerve roots would be required to test this hypothesis.
To summarize, we conclude that the constriction of myelinated axons at nodes of Ranvier is a biological adaptation to minimize fiber caliber for a given target conduction velocity. The fact that these constrictions can influence fiber caliber so dramatically is quite remarkable in view of the short length of the nodal and paranodal regions (a few μm) compared with the long length of internodes, which can exceed 1,000 μm for large axons. The significance of reducing fiber caliber is that it reduces the metabolic cost to the neuron for axonal growth and maintenance, in addition to reducing overall body volume. The metabolic cost is realized not just by a reduction in the number of channels and pumps required to maintain the membrane potential and excitability of the axon, but also by a reduction in the myriad cellular processes that are required to support axonal cytoplasm and their myelinating cells. Thus nodal constrictions can have significant selective benefits for organisms that myelinate their axons.
GRANTS
This work was supported by collaborative National Science Foundation Grants IOS 1146809 and IOS 1146789 to A. Brown and P. Jung.
DISCLOSURES
No conflicts of interest, financial or otherwise, are declared by the author(s).
AUTHOR CONTRIBUTIONS
Author contributions: C.J., W.R.H., A.B., and P.J. conception and design of research; C.J. performed experiments; C.J. analyzed data; C.J., W.R.H., and P.J. interpreted results of experiments; C.J. prepared figures; C.J. and P.J. drafted manuscript; C.J., W.R.H., A.B., and P.J. edited and revised manuscript; C.J., W.R.H., A.B., and P.J. approved final version of manuscript.
REFERENCES
- Arroyo EJ, Scherer SS. On the molecular architecture of myelinated fibers. Histochem Cell Biol 113: 1–18, 2000. [DOI] [PubMed] [Google Scholar]
- Basser PJ, Roth BJ. Stimulation of a myelinated nerve axon by electromagnetic induction. Med Biol Eng Comput 29: 261–268, 1991. [DOI] [PubMed] [Google Scholar]
- Berthold CH. Ultrastructure of the node-paranode region of mature feline ventral lumbar spinal-root fibres. Acta Soc Med Ups 73, Suppl 9: 37–70, 1968. [PubMed] [Google Scholar]
- Berthold CH, Nilsson I, Rydmark M. Axon diameter and myelin sheath thickness in nerve fibres of the ventral spinal root of the seventh lumbar nerve of the adult and developing cat. J Anat 136: 483–508, 1983. [PMC free article] [PubMed] [Google Scholar]
- Berthold CH, Rydmark M. Electrophysiology and morphology of myelinated nerve fibers. VI. Anatomy of the paranode-node-paranode region in the cat. Experientia 39: 964–976, 1983a. [DOI] [PubMed] [Google Scholar]
- Berthold CH, Rydmark M. Electron microscopic serial section analysis of nodes of Ranvier in lumbosacral spinal roots of the cat: ultrastructural organization of nodal compartments in fibres of different sizes. J Neurocytol 12: 475–505, 1983b. [DOI] [PubMed] [Google Scholar]
- Bertram M, Schröder JM. Developmental changes at the node and paranode in human sural nerves: morphometric and fine-structural evaluation. Cell Tissue Res 273: 499–509, 1993. [DOI] [PubMed] [Google Scholar]
- Cajal SR. Comparative Study of the Sensory Areas of the Human Cortex. Boston, MA: Harvard University, 1899. [Google Scholar]
- Carnevale T, Hines M. The Neuron Book. Cambridge, UK: Cambridge University Press, 2006. [Google Scholar]
- Cleveland DW. Neuronal growth and death: order and disorder in the axoplasm. Cell 84: 663–666, 1996. [DOI] [PubMed] [Google Scholar]
- Debanne D, Campanac E, Bialowas A, Carlier E, Alcaraz G. Axon physiology. Physiol Rev 91: 555–602, 2011. [DOI] [PubMed] [Google Scholar]
- Dun FT. The length and diameter of the node of Ranvier. IEEE Trans Biomed Eng 17: 21–24, 1970. [DOI] [PubMed] [Google Scholar]
- Griffith DJ. Introduction to Electrodynamics (4th Ed). Boston, MA: Pearson, 2013. [Google Scholar]
- Halter JA, Clark JW. The influence of nodal constriction on conduction velocity in myelinated nerve fibers. Neuroreport 4: 89–92, 1993. [DOI] [PubMed] [Google Scholar]
- Harris JJ, Jolivet R, Attwell D. Synaptic energy use and supply. Neuron 75: 762–777, 2012. [DOI] [PubMed] [Google Scholar]
- Hartline DK, Colman DR. Rapid conduction and the evolution of giant axons and myelinated fibers. Curr Biol 17: R29–R35, 2007. [DOI] [PubMed] [Google Scholar]
- Hess A, Young JZ. The nodes of Ranvier. Proc R Soc Lond B Biol Sci 140: 301–320, 1952. [DOI] [PubMed] [Google Scholar]
- Hines ML, Carnevale NT. The NEURON simulation environment. Neural Comput 9: 1179–1209, 1997. [DOI] [PubMed] [Google Scholar]
- Hodgkin AL, Huxley AF. A quantitative description of membrane current and its application to conduction and excitation in nerve. J Physiol 117: 500–544, 1952. [DOI] [PMC free article] [PubMed] [Google Scholar]
- Koch C. Biophysics of Computation. Oxford, UK: Oxford University Press, 2004. [Google Scholar]
- McIntyre CC, Richardson AG, Grill WM. Modeling the excitability of mammalian nerve fibers: influence of afterpotentials on the recovery cycle. J Neurophysiol 87: 995–1006, 2002. [DOI] [PubMed] [Google Scholar]
- Min Y, Kristiansen K, Boggs JM, Husted C, Zasadzinski JA, Israelachvili J. Interaction forces and adhesion of supported myelin lipid bilayers modulated by myelin basic protein. Proc Natl Acad Sci U S A 106: 3154–3159, 2009. [DOI] [PMC free article] [PubMed] [Google Scholar]
- Moore JW, Joyner RW, Brill MH, Waxman SD, Najar-Joa M. Simulations of conduction in uniform myelinated fibers. Relative sensitivity to changes in nodal and internodal parameters. Biophys J 21: 147–160, 1978. [DOI] [PMC free article] [PubMed] [Google Scholar]
- Nygren A, Halter JA. A general approach to modeling conduction and concentration dynamics in excitable cells of concentric cylindrical geometry. J Theor Biol 199: 329–358, 1999. [DOI] [PubMed] [Google Scholar]
- Okamura Y, Tsukita S. Morphology of freeze-substituted myelinated axon in mouse peripheral nerves. Brain Res 383: 146–158, 1986. [DOI] [PubMed] [Google Scholar]
- Poliak S, Peles E. The local differentiation of myelinated axons at nodes of Ranvier. Nat Rev Neurosci 4: 968–980, 2003. [DOI] [PubMed] [Google Scholar]
- Rasband MN, Shrager P. Ion channel sequestration in central nervous system axons. J Physiol 525: 63–73, 2000. [DOI] [PMC free article] [PubMed] [Google Scholar]
- Rydmark M. Nodal axon diameter correlates linearly with internodal axon diameter in spinal roots of the cat. Neurosci Lett 24: 247–250, 1981. [DOI] [PubMed] [Google Scholar]
- Rydmark M, Berthold CH. Electron microscopic serial section analysis of nodes of Ranvier in lumbar spinal roots of the cat: a morphometric study of nodal compartments in fibres of different sizes. J Neurocytol 12: 537–565, 1983. [DOI] [PubMed] [Google Scholar]
- Salzer JL, Brophy PJ, Peles E. Molecular domains of myelinated axons in the peripheral nervous system. Glia 56: 1532–1540, 2008. [DOI] [PubMed] [Google Scholar]
- Sosinsky GE, Deerinck TJ, Greco R, Buitenhuys CH, Bartol TM, Ellisman MH. Development of a model for microphysiological simulations: small nodes of ranvier from peripheral nerves of mice reconstructed by electron tomography. Neuroinformatics 3: 133–162, 2005. [DOI] [PubMed] [Google Scholar]
- Swärd C, Berthold CH, Nilsson-Remahl I, Rydmark M. Axonal constriction at Ranvier's node increases during development. Neurosci Lett 190: 159–162, 1995. [DOI] [PubMed] [Google Scholar]


