

Abstract
Routine therapeutic efficacy monitoring to measure the response to antimalarial treatment is a cornerstone of malaria control. To correctly measure drug efficacy, therapeutic efficacy studies require genotyping parasites from late treatment failures to differentiate between recrudescent infections and reinfections. However, there is a lack of statistical methods to systematically classify late treatment failures from genotyping data. A Bayesian algorithm was developed to estimate the posterior probability of late treatment failure being the result of a recrudescent infection from microsatellite genotyping data. The algorithm was implemented using a Monte Carlo Markov chain approach and was used to classify late treatment failures using published microsatellite data from therapeutic efficacy studies in Ethiopia and Angola. The algorithm classified 85% of the Ethiopian and 95% of the Angolan late treatment failures as either likely reinfection or likely recrudescence, defined as a posterior probability of recrudescence of <0.1 or >0.9, respectively. The adjusted efficacies calculated using the new algorithm differed from efficacies estimated using commonly used methods for differentiating recrudescence from reinfection. In a high-transmission setting such as Angola, as few as 15 samples needed to be genotyped in order to have enough power to correctly classify treatment failures. Analysis of microsatellite genotyping data for differentiating between recrudescence and reinfection benefits from an approach that both systematically classifies late treatment failures and estimates the uncertainty of these classifications. Researchers analyzing genotyping data from antimalarial therapeutic efficacy monitoring are urged to publish their raw genetic data and to estimate the uncertainty around their classification.
INTRODUCTION
Prompt and effective treatment for malaria is one of the pillars of malaria control, the global effort to reduce the burden of this parasitic disease responsible for 627,000 deaths annually (1). However, the malaria parasite has historically shown a tendency to develop resistance to antimalarial drugs. The emergence of resistance to virtually all antimalarial drugs, including quinine, chloroquine, sulfadoxine-pyrimethamine, mefloquine, and recently, artemisinins, has been documented (2–4). As a result, the World Health Organization (WHO) recommends that all countries in which malaria is endemic routinely retest the efficacy of first- and second-line antimalarials to monitor for early signs of resistance and to aid in the development of revised treatment guidelines (5).
The main tool for surveillance of antimalarial resistance is the biennial in vivo therapeutic efficacy study that follows a standard WHO protocol (5). These are typically small clinical outcome studies that administer directly observed therapy of an antimalarial agent to patients presenting to health facilities with uncomplicated malaria. Patients not adequately clearing the infection within 4 days are classified as early treatment failures. If clearance of the infection within 4 days is verified, the patients are then followed up weekly over a follow-up period, typically 28 or 42 days, to observe for clinical and laboratory signs of treatment failure.
One unique characteristic of antimalarial efficacy studies in areas of higher endemicity is that study participants are typically still at risk of acquiring a new malaria infection during the follow-up period. Therefore, the presence of asexual parasites in the follow-up period can be caused either by ineffective clearance of the original infection, called a recrudescent infection, or by an entirely new infection, termed reinfection. Because reinfection can inflate the apparent treatment failure rate by increasing the number of patients with parasitemia during the follow-up period, the main outcome of in vivo studies is the adjusted efficacy, defined as the proportion of treatment successes over the number of patients enrolled in or completing the study, excluding those with reinfection.
As a result, differentiating between recrudescence and reinfection is an integral part of routine malarial drug efficacy monitoring. Traditionally, parasites from day 0, the start of treatment, and from the day of failure are genotyped, and the genotypes are compared. If the parasites are deemed to be genetically identical, then the infection is classified as a recrudescence. Traditionally, genotyping has been done through amplification and fragment size analysis of the msp1, mps2, and glurp genes (6). An alternative is neutral microsatellite genotyping, where a genotype is defined by the fragment lengths of multiple neutral loci (7). Using these methods, an infection is considered a recrudescence if the day 0 and day-of-treatment-failure parasites share alleles at all loci, and it is considered a reinfection otherwise.
Independent of which genotyping method is used, misclassification of recrudescence and reinfection is a risk under many conditions. In the absence of diversity in a parasite population, as is often the case in low-transmission areas, there is a high probability that a true reinfection will have the same genotype as the original infection, so true reinfection can be misclassified as recrudescence. Similarly, in high-transmission areas, with high rates of infections and multiple parasite genomes present (multiplicity of infection [MOI] >1), there can be a high probability that any two infections will share at least one allele at all loci, due to the large number of possible comparisons between infections with a high MOI (8). On the other hand, in areas of high endemicity, the risk of misclassifying true recrudescence as reinfection also exists because, in infections with an MOI >1, low-frequency alleles might not be observed for a particular locus (9). In classification algorithms that require shared alleles for all loci, this might result in true recrudescence being erroneously classified as reinfection.
Because the adjusted efficacy, the main outcome reported by in vivo studies, can be significantly biased by misclassification of recrudescence and reinfection (10, 11), some have argued to deemphasize this indicator and instead focus on the unadjusted efficacy (12). World Health Organization guidelines mention the need to statistically correct efficacy estimates for possible misclassification (6), and various groups have proposed different statistical methods to minimize the risk of misclassification (8). However, no systematic statistical method has been proposed for analyzing microsatellite data to differentiate recrudescence from reinfection. Moreover, no currently used method for classifying late treatment failures estimates the uncertainty of the classification.
Here, a novel, Bayesian approach to interpreting microsatellite data from treatment failures to classify infections as recrudescence or reinfection is described. The classifying algorithm is applied to data sets from two published in vivo studies that performed microsatellite genotyping on treatment failures.
MATERIALS AND METHODS
Data sources.
Data from two in vivo studies that published the full microsatellite data from treatment failures were accessed. Data from the first study represent 81 treatment failures from a 2009 in vivo therapeutic efficacy study of chloroquine (CQ) and artemether-lumefantrine (AL) for treatment of Plasmodium vivax in children and adults in Oromia regional state, central Ethiopia (13). For each treatment failure, data for eight neutral microsatellites from day 0 and the day of treatment failure were analyzed.
The second source of data is a set of 24 treatment failures from a 2013 in vivo therapeutic efficacy study of AL and dihydroartemisin-piperaquine (DP) in children with uncomplicated P. falciparum malaria in Zaire and Uíge provinces in Angola (14). There were 24 late treatment failures observed in three of the study arms: AL in Zaire, AL in Uíge, and DP in Zaire. Samples from day 0 and the day of treatment failure for each treatment failure had been genotyped using seven neutral microsatellites. In addition to the previously published microsatellite data from the treatment failures, all remaining day-0 samples from all 398 enrolled patients in both Angolan sites using six of the seven original loci were analyzed, following the methods from the original paper (14).
Algorithm.
A Bayesian algorithm was developed to sample from the posterior probability of each treatment failure being a recrudescence, P(Ri = 1|D), given the observed microsatellite data, D. Here, Ri = 1 represents the hypothesis that treatment failure i is a recrudescence. Using Bayes' formula, this probability can be expressed as a function of the likelihood of observing the data given that treatment failure i is a recrudescence (Ri = 1) or reinfection (Ri = 0).
| (1) |
If all alleles for each locus are observed, the full likelihood of the data for treatment failure i given the case of reinfection can be written as the product of the frequencies of the alleles at each of the n loci for day 0 and the day of treatment failure, assuming no linkage disequilibrium between loci:
| (2) |
Here, denotes the length of the kth allele for the jth locus in the day 0 sample for treatment failure i, and , the equivalent for the day of treatment failure. The terms and represent the MOI for day 0 and the day of treatment failure, respectively, for treatment failure i. These are defined as the maximum number of alleles at any locus for a sample. The function θj(x) returns the population frequency of an allele with fragment length x for locus j.
For the likelihood of the data for recrudescent infections, the terms representing the frequencies of the recrudescing alleles (denoting r0 as the recrudescing allele on day 0 and rf on the day of failure) are replaced by , defined as the probability of the same allele being measured to have a fragment length difference of . In essence, this is the error intrinsic to the method used to measure fragment lengths. Because there are and possible pairs of recrudescent alleles, the likelihood is adjusted to account for these multiple comparisons. The likelihood of the data given treatment failure i is a recrudescence can then be written as:
| (3) |
Due to allelic suppression, where not all alleles for all loci are likely to be detected during genotyping, it is common to find less than MOI alleles for certain loci. To be able to calculate the likelihood, one can introduce unobserved alleles, denoted as D̃, and multiply the likelihood by qmi, where q is a parameter denoting the probability of an allele being not observed, and mi is the number of unobserved alleles for treatment failure i. To allow for infections in which two strains share alleles, D̃ is not restricted to be the different from D. If the unobserved allele matches an observed allele, the likelihood is not multiplied by q.
The advantage of using a Bayesian approach is the ability to jointly estimate the posterior distributions of probability of recrudescence as well as the unknown functions and parameters θ, Δ, and q, and the hidden (unobserved) alleles D̃. The posterior and prior distributions for the θ, Δ, and q, parameters were chosen to be conjugate distributions to improve the efficiency of the algorithm. The population frequencies, θj, for each locus are modeled to follow a Dirichlet distribution. An uninformative prior for θj, following a Dirichlet distribution with all α = 0, is assumed. The function Δ is parameterized as a geometric distribution with parameter δ. The posterior distribution for δ is a beta distribution, and its uninformative prior is a beta distribution with α = 0 and β = 0. The probability of an allele being unobserved, q, is modeled as following a beta distribution, with its prior also following a beta distribution with α = 0 and β = 0. The prior probability of recrudescence, P(Ri = 1), is set at 0.5.
The algorithm uses Gibbs sampling (15) to sequentially sample from the posterior distributions of the probability of recrudescence, the parameters θ, δ, and q, and the unobserved alleles D̃. The parameters θ, δ, and q are sampled directly due to having conjugate priors, and the probability of recrudescence and the unobserved alleles D̃ are sampled by comparing likelihood ratios at each update step.
Application of algorithm.
The algorithm was used to sample from the posterior probabilities of recrudescence for the 81 treatment failures from the Ethiopia data set and the 24 treatment failures from the Angola data set. Convergence was judged by inspection of plots of the posterior values over the iterations of the algorithm. The means and interquartile ranges for the sampled values of δ and q were calculated. The sampled values of θ were used to calculate Simpson's diversity index (16), averaged for all loci. Histograms showing the distribution of the posterior probabilities of recrudescence were plotted for all treatment failures.
On the basis of the number of treatment successes (ns), the number of early treatment failures (netf), and the number of late treatment failures (nltf) reported from both studies, the adjusted 42-day (for Ethiopia) and 28-day (for Angola) efficacies were calculated. The Markov chain was run for 100,000 iterations, and a subset of M = 10,000 samples of Ri, were used to calculate the efficacy using the formula:
| (4) |
The 95% credible intervals were calculated on the basis of the sampled efficacies. In this way, the adjusted efficacy estimate took into account the uncertainties related to the classification of the late treatment failures.
These results were compared to efficacy estimates adjusted using two commonly used classification algorithms. In the first method, denoted as all-loci-identical, each treatment failure is classified as recrudescence if the day 0 and the day-of-failure samples share at least one allele at each locus. Otherwise, it is classified as reinfection. The second method, denoted as all-but-one-locus-identical, is similar, except that recrudescent infections are allowed to differ in at most one locus to partially account for the possibility of allelic suppression (17). Alleles were considered identical if their fragment lengths differed by two or fewer base pairs.
Because the likelihood calculations underlying the algorithm are sensitive to the population frequencies of the alleles, the true population frequencies were estimated from the microsatellite genotyping data from all 398 Angolan day 0 isolates. The probability of recrudescence for the Angolan treatment failures was estimated by directly calculating the likelihood on the basis of the fixed, true population frequencies. Treatment failures for which P(Ri = 1|D) was greater than 0.5 were classified as recrudescence; otherwise, they were classified as reinfection. This classification, using the fixed population frequencies, was considered to be the gold standard classification.
To investigate the accuracy of the algorithm in classifying treatment failures as a function of the number of samples analyzed, m (ranging from 1 to 24) treatment failures were sampled without replacement from the 24 Angolan treatment failures 100 times each. The classification algorithm was then run on the subsample of treatment failures, and the classifications (defining recrudescence, as above) were compared to the true classifications. The mean and 95% credible interval of the proportion of correct classifications were calculated for each value of m.
Similarly, the effect of the number of loci on the accuracy of the algorithm was analyzed. The classification algorithm was run 100 times for all 24 treatment failures from Angola but on a random subset of the loci, for n ranging from 1 to 6. As before, the accuracy of the algorithm was defined as the proportion of classifications matching the gold standard classification.
All analysis was run in R version 3.1.1 (R Foundation for Statistical Computing, Auckland, New Zealand). Scripts and example data sets are available from the authors.
RESULTS
The distribution of the posterior probabilities of recrudescence, P(Ri = 1|D), had a bimodal distribution for both the Ethiopia and the Angola data sets (Fig. 1). For the Ethiopian data set, 12 (15%) treatment failures had intermediate values (between 0.1 and 0.9) of the probability of recrudescence, with all other treatment failures being classified with high confidence as either recrudescence or reinfection. For the Angolan data set, only one treatment failure (5%) had an intermediate posterior probability of recrudescence, likely due to an average higher diversity of alleles in the population (Table 1). The posterior probability of an allele being suppressed, q, and the parameter controlling the error rate of measuring the fragment length, δ, were similar for both data sets, likely due to the similarity in the laboratory protocols used for the genotyping.
FIG 1.
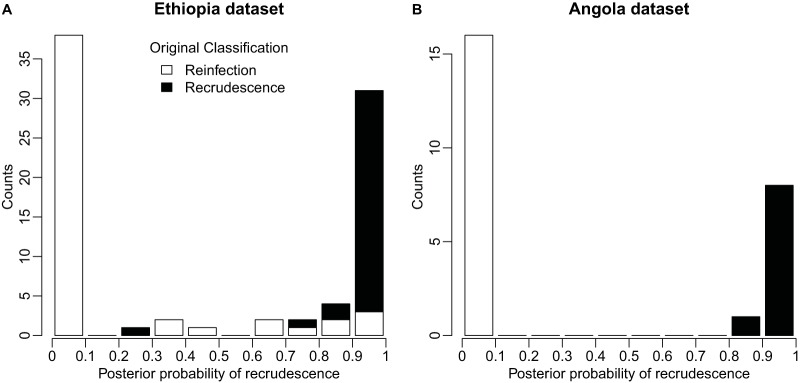
Histogram of the distribution of posterior probabilities of recrudescence for Ethiopia treatment failures (A) and Angola treatment failures (B). Values close to 1 represent likely recrudescent infections, and values close to 0 represent likely reinfections. The original classifications by the original studies' authors are denoted by color, with black representing recrudescences and white representing reinfections.
TABLE 1.
Mean and interquartile range for selected statistics
| Statistic | Mean (interquartile range) of: |
|
|---|---|---|
| Ethiopia data set | Angola data set | |
| q | 0.25 (0.24–0.26) | 0.18 (0.17–0.19) |
| δ | 0.77 (0.75–0.79) | 0.85 (0.83–0.88) |
| Average Simpson's index per locus | 0.23 (0.18–0.26) | 0.12 (0.10–0.14) |
For both data sets, the final number of infections classified as recrudescence and reinfection using the algorithm differed in meaningful ways from standard methods of interpreting microsatellite data. For the Ethiopian data set, the algorithm classified a total of 31 treatment failures in both arms as likely [P(Ri = 1|D > 0.90)] recrudescence, as opposed to 32 in the original paper, which used the all-loci-identical classification algorithm. With one exception (sample no. 3127) all treatment failures originally classified as recrudescence had a posterior probability of recrudescence of >0.5 (Fig. 1A). Taking into account the uncertainty of the classification, the algorithm resulted in an adjusted 42-day efficacy of 77.7% (95% credible interval, 67% to 86%) in the AL arm compared to 81.5% (95% confidence interval, 71% to 89%) using the all-loci-identical classification and 67.3% (95% confidence interval, 57% to 76%) using the all-but-one-loci-identical classification (Table 2). For the CQ arm, the trend was similar, with a 78.9% (95% credible interval, 69% to 86%) efficacy using the algorithm described here compared to efficacies of 81.1% (95% confidence interval, 71% to 88%) and 73.0% (95% confidence interval, 63% to 81%) using the alternate methods.
TABLE 2.
Adjusted efficacies for different classification algorithms
| Data set | Adjusted efficacy % (95% confidence or credible interval)a |
||
|---|---|---|---|
| All loci identical | All but one loci identical | Novel classification algorithm | |
| AL Ethiopia | 81.5 (71–89) | 67.3 (57–76) | 77.7 (67–86) |
| CQ Ethiopia | 81.1 (71–88) | 73.0 (63–81) | 78.9 (69–86) |
| AL Uíge, Angola | 98.6 (92–100) | 97.3 (90–100) | 97.3 (91–99) |
| AL Zaire, Angola | 91.0 (81–96) | 88.4 (78–95) | 88.6 (79–94) |
| DP Zaire, Angola | 100 (94–100) | 100 (94–100) | 100 (95–100) |
Confidence intervals are given in the “All loci identical” and “All but one loci identical” columns, and credible intervals are given in the “Novel classification algorithm” column.
For the Angola data set, the efficacy estimated by the classification algorithm matched the all-loci-identical and all-but-one-locus-identical algorithms for the DP Zaire arm. However, for the AL Uíge arm, the estimated efficacy of 97.3% (95% credible interval, 91% to 99%) differed from the 98.6% (95% confidence interval, 92% to 100%) efficacy resulting from the all-loci-identical classification algorithm, but it matched the efficacy resulting from the all-but-one-loci-identical classification algorithm, which had been used in the original publication. Similarly, for the AL Zaire arm, the estimated efficacy of 88.6% (95% credible interval, 79% to 94%) was lower than the all-loci-identical estimate of 91.0% (95% confidence interval, 81% to 96%) but matched the all-but-one-loci-identical estimate.
The accuracy of the algorithm is dependent on its ability to accurately estimate the population frequencies, a function of the number of samples analyzed. Considering the classification obtained by using the population frequencies estimated from all 398 day 0 isolates as the “true” classification for the Angola treatment failures, the algorithm on average correctly classified 68% of treatment failures analyzed one by one (Fig. 2A). The average accuracy improved to 87% when 5 treatment failures were considered at a time and reached and stayed at nearly 100% for sample sizes greater than 15. As expected for a robust, unbiased estimator, the accuracy of the algorithm also increased as a function of the number of loci analyzed (Fig. 2B).
FIG 2.
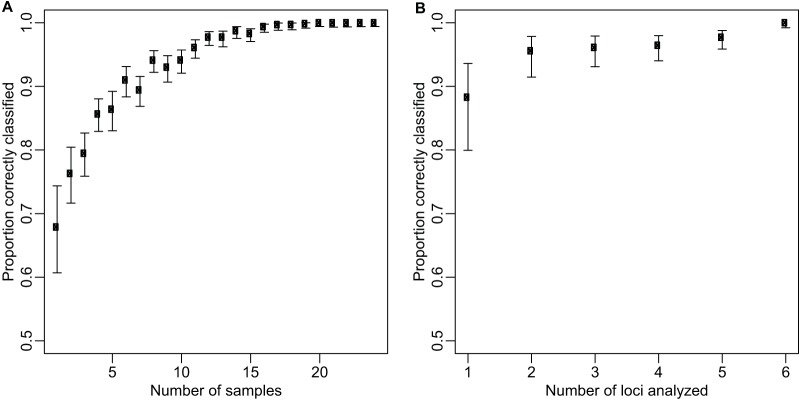
The probability of the algorithm correctly classifying 24 late treatment failures from Angola by varying the number of samples analyzed at a given time and fixing the number of loci at 6 (A) and by varying the number of loci analyzed and fixing the number of samples at 24 (B). Bars represent 95% confidence intervals.
DISCUSSION
By jointly estimating the probabilities of recrudescence and parameters such as the population frequencies, the probability of allelic suppression, and the error rate of measurement of fragment length, the algorithm described here is able to adjust the final efficacy to account for the uncertainty in these parameters. One principal assumption underlying the algorithm, a limitation of the algorithm, is that the loci are independent, which allows calculation of the likelihood as a product of terms for each locus. Although microsatellite loci are chosen to not be under selection and sufficiently far apart in the genome that the assumption of independence holds for well-mixed populations, real-world parasite populations sampled during therapeutic efficacy studies likely exhibit population structure due to the spatial nature of malarial disease dynamics. However, accounting for dependence between n loci would require the estimation of a further n(n – 1)/2 parameters, unfeasible for the limited numbers of samples typically genotyped in the context of therapeutic efficacy studies.
The algorithm classified treatment failures as recrudescence or reinfection with high certainty for two real-world data sets (Fig. 1). Moreover, it is likely that, for many settings, few samples are needed to estimate the population frequencies that underlie the calculations of the likelihood, although this depends on the distribution of alleles in the population. For the Angola data set, as few as 15 genotyped samples were sufficient to consistently classify treatment failures correctly as recrudescence or reinfection.
Together, this confirms the potential utility of including microsatellite genotyping as a standard component of in vivo studies. However, the results highlight the importance of carefully analyzing microsatellite data. The results suggest that classifying as recrudescence infections for which all loci have matching alleles can substantially overestimate efficacy. In the Ethiopia data set, the 42-day adjusted efficacies of 77.7% for AL and 78.9% for CQ using the algorithm described here are lower than those originally reported (13). Similarly, had the all-loci-identical classification algorithm been used in Angola, the efficacy of AL in Zaire would have been 91.0%, whereas the analysis reported here suggests that it is 88.6%.
The effect of incorrect classification of recrudescence and reinfection can have a large impact on the interpretation of in vivo efficacy data. While relative efficacies in studies looking at more than one drug might still be valid, since the risk of misclassification is likely to be unrelated to treatment arm, the absolute efficacies of the drugs can be biased, as is shown for the case of the Ethiopia in vivo study. A biased estimate can have potentially large policy implications. For example, the WHO recommends that antimalarials be switched if efficacy falls below 90%, and our current analysis suggests that the efficacy of AL in Zaire province, Angola, is below this threshold. However, had the all-loci-identical algorithm been used to classify late treatment failures, the efficacy would have been above this threshold.
Due to these risks, it is recommended that microsatellite data for in vivo studies be analyzed in a way that avoids arbitrary and investigator-specific definitions for recrudescence and that an effort be made both to systematically classify treatment failures and to calculate and report the uncertainty around these classifications. In vivo study authors are also encouraged to routinely publish full molecular data for all treatment failures, regardless of the genotyping method used, to allow readers to interpret the adjusted efficacy in the context of the genotyping data.
ACKNOWLEDGMENTS
This work was supported by the Centers for Disease Control and Prevention and the President's Malaria Initiative.
We declare no commercial or other associations that might pose a conflict of interest.
REFERENCES
- 1.World Health Organization. 2013. World malaria report. World Health Organization, Geneva, Switzerland. [Google Scholar]
- 2.Mita T, Tanabe K, Kita K. 2009. Spread and evolution of Plasmodium falciparum drug resistance. Parasitol Int 58:201–209. doi: 10.1016/j.parint.2009.04.004. [DOI] [PubMed] [Google Scholar]
- 3.Wongsrichanalai C, Pickard AL, Wernsdorfer WH, Meshnick SR. 2002. Epidemiology of drug-resistant malaria. Lancet Infect Dis 2:209–218. doi: 10.1016/S1473-3099(02)00239-6. [DOI] [PubMed] [Google Scholar]
- 4.Dondorp AM, Nosten F, Yi P, Das D, Phyo AP, Tarning J, Lwin KM, Ariey F, Hanpithakpong W, Lee SJ. 2009. Artemisinin resistance in Plasmodium falciparum malaria. N Engl J Med 361:455–467. doi: 10.1056/NEJMoa0808859. [DOI] [PMC free article] [PubMed] [Google Scholar]
- 5.World Health Organization. 2009. Methods for surveillance of antimalarial drug efficacy. World Health Organization, Geneva, Switzerland. [Google Scholar]
- 6.World Health Organization. 2008. Methods and techniques for clinical trials on antimalarial drug efficacy: genotyping to identify parasite populations. World Health Organization, Geneva, Switzerland. [Google Scholar]
- 7.Anderson T, Su X, Bockarie M, Lagog M, Day K. 1999. Twelve microsatellite markers for characterization of Plasmodium falciparum from finger-prick blood samples. Parasitology 119:113–125. doi: 10.1017/S0031182099004552. [DOI] [PubMed] [Google Scholar]
- 8.Greenhouse B, Dokomajilar C, Hubbard A, Rosenthal PJ, Dorsey G. 2007. Impact of transmission intensity on the accuracy of genotyping to distinguish recrudescence from new infection in antimalarial clinical trials. Antimicrob Agents Chemother 51:3096–3103. doi: 10.1128/AAC.00159-07. [DOI] [PMC free article] [PubMed] [Google Scholar]
- 9.Greenhouse B, Myrick A, Dokomajilar C, Woo JM, Carlson EJ, Rosenthal PJ, Dorsey G. 2006. Validation of microsatellite markers for use in genotyping polyclonal Plasmodium falciparum infections. Am J Trop Med Hyg 75:836–842. [PMC free article] [PubMed] [Google Scholar]
- 10.Stepniewska K, White NJ. 2006. Some considerations in the design and interpretation of antimalarial drug trials in uncomplicated falciparum malaria. Malar J 5:127. doi: 10.1186/1475-2875-5-127. [DOI] [PMC free article] [PubMed] [Google Scholar]
- 11.Slater M, Kiggundu M, Dokomajilar C, Kamya MR, Bakyaita N, Talisuna A, Rosenthal PJ, Dorsey G. 2005. Distinguishing recrudescences from new infections in antimalarial clinical trials: major impact of interpretation of genotyping results on estimates of drug efficacy. Am J Trop Med Hyg 73:256–262. [PubMed] [Google Scholar]
- 12.Juliano JJ, Gadalla N, Sutherland CJ, Meshnick SR. 2010. The perils of PCR: can we accurately correct antimalarial trials? Trends Parasitol 26:119–124. doi: 10.1016/j.pt.2009.12.007. [DOI] [PMC free article] [PubMed] [Google Scholar]
- 13.Hwang J, Alemayehu BH, Reithinger R, Tekleyohannes SG, Teshi T, Birhanu SG, Demeke L, Hoos D, Melaku Z, Kassa M. 2013. In vivo efficacy of artemether-lumefantrine and chloroquine against Plasmodium vivax: a randomized open label trial in central Ethiopia. PLoS One 8:e63433. doi: 10.1371/journal.pone.0063433. [DOI] [PMC free article] [PubMed] [Google Scholar]
- 14.Plucinski MM, Talundzic E, Morton L, Dimbu PR, Macaia AP, Fortes F, Goldman I, Lucchi N, Stennies G, MacArthur JR, Udhayakumar V. 2015. Efficacy of artemether-lumefantrine and dihydroartemisinin-piperaquine for the treatment of uncomplicated malaria in children in Zaire and Uíge Provinces, Angola. Antimicrob Agents Chemother 59:437–443. doi: 10.1128/AAC.04181-14. [DOI] [PMC free article] [PubMed] [Google Scholar]
- 15.Gelfand AE, Hills SE, Racine-Poon A, Smith AF. 1990. Illustration of Bayesian inference in normal data models using Gibbs sampling. J Am Stat Assoc 85:972–985. doi: 10.1080/01621459.1990.10474968. [DOI] [Google Scholar]
- 16.Simpson EH. 1949. Measurement of diversity. Nature 163:688. doi: 10.1038/163688a0. [DOI] [Google Scholar]
- 17.Shaukat AM, Gilliams EA, Kenefic LJ, Laurens MB, Dzinjalamala FK, Nyirenda OM, Thesing PC, Jacob CG, Molyneux ME, Taylor TE. 2012. Clinical manifestations of new versus recrudescent malaria infections following anti-malarial drug treatment. Malar J 11:207. doi: 10.1186/1475-2875-11-207. [DOI] [PMC free article] [PubMed] [Google Scholar]