. 2015 Aug 6;4:e06414. doi: 10.7554/eLife.06414

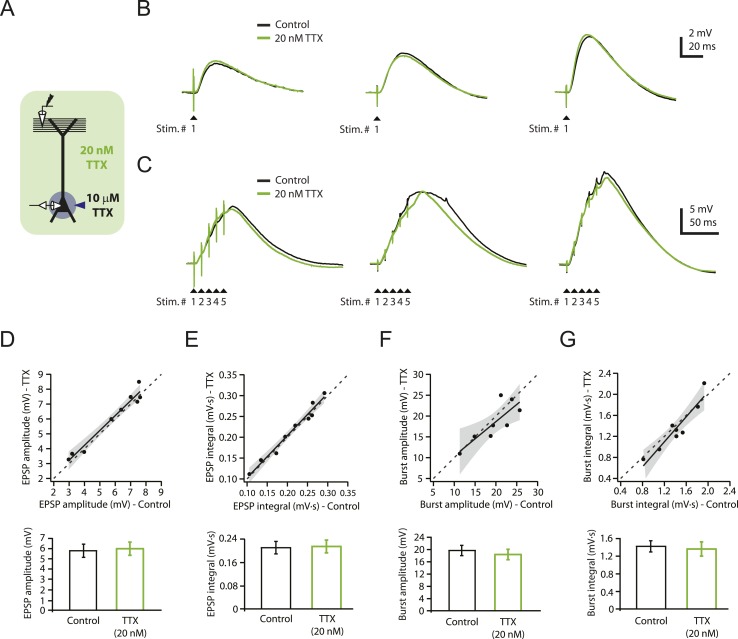
Figure 1. Reducing Nav channel availability with 20 nM TTX does not affect synaptic transmission at PP → CA1tuft synapses.

(A) Experimental configuration showing somatic whole-cell recording with presynaptic stimulation of the perforant pathway (PP), 10 µM TTX locally applied to the soma, and bath application of 20 nM TTX. (B, C) Representative traces of somatically recorded voltage in response to single-shock stimulation (B) or high-frequency burst stimulation (5 stimuli at 100 Hz; C) in control and 20 nM TTX. Traces are from three different cells. (DG) Summary of effects of 20 nM TTX on EPSP amplitude and integral (D, E, single-shock, n = 9; F, G, burst, n = 8). Top. Scatter plots of the amplitude or integral of responses in 20 nM TTX vs control. Each point represents data from one cell. Solid lines represent a linear fit to data points, with shaded areas representing the 95% confidence band of the fit. Dashed lines are the unity line. Bottom. Bar graphs of the amplitude or integral of responses in control and 20 nM TTX.

DOI: http://dx.doi.org/10.7554/eLife.06414.003

Figure 1—source data 1. Source data for Figure 1.
elife06414s001.xlsx (720.6KB, xlsx)
DOI: 10.7554/eLife.06414.004
Figure 1—source data 2. Source data for Figure 1—figure supplement 1.
elife06414s002.xlsx (6.5MB, xlsx)
DOI: 10.7554/eLife.06414.005

Figure 1.

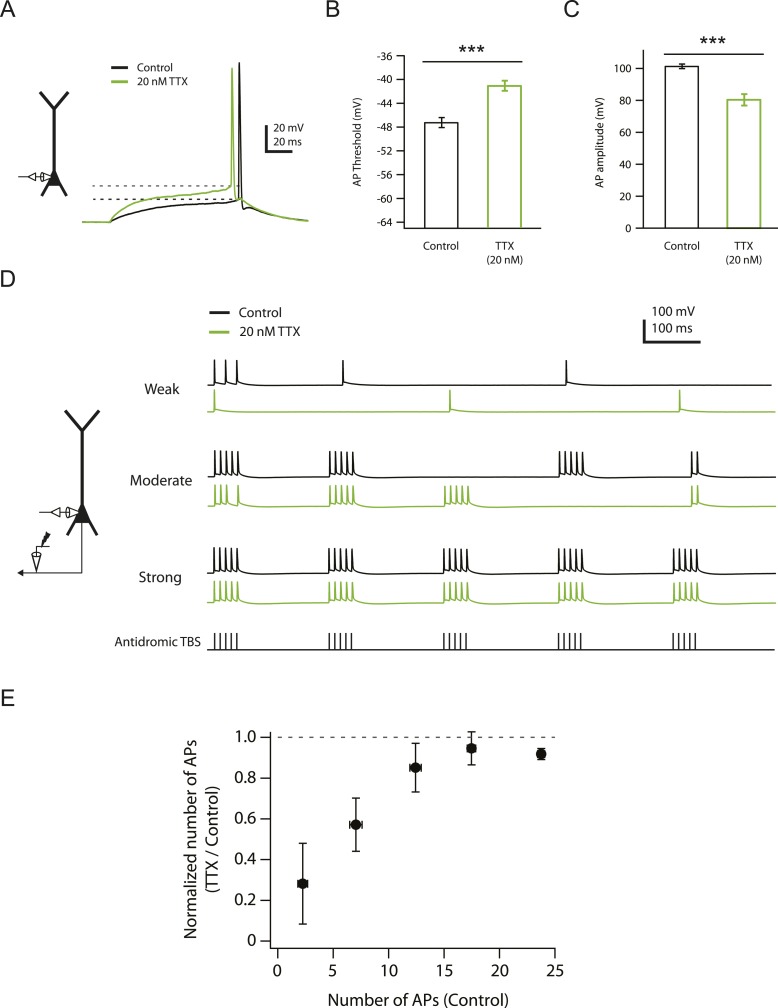
Figure 1—figure supplement 1. Effects of reducing Nav channel availability with 20 nM TTX on somatic action potentials.

Figure 1—figure supplement 1.

(A) Left, experimental configuration showing somatic whole-cell recording. Right, representative traces of somatically recorded voltage in response to a current step (100 ms) at the level of action potential (AP) threshold (rheobase) injected at the soma in control and 20 nM TTX. Dashed lines indicate the apparent voltage threshold of the APs. (B, C) Summary of effects of 20 nM TTX on somatic action potentials (n = 8). ***p < 0.001 by Student's paired t-test. (D) Left, experimental configuration showing somatic whole-cell recording with antidromic stimulation of CA1 axons. Right, representative traces of somatically recorded voltage in response to antidromic TBS (the same temporal pattern as used for LTP induction; see ‘Materials and methods’) at different stimulus intensities in control and 20 nM TTX. (E) Summary of effects of 20 nM TTX on antidromic action potentials (n = 7).