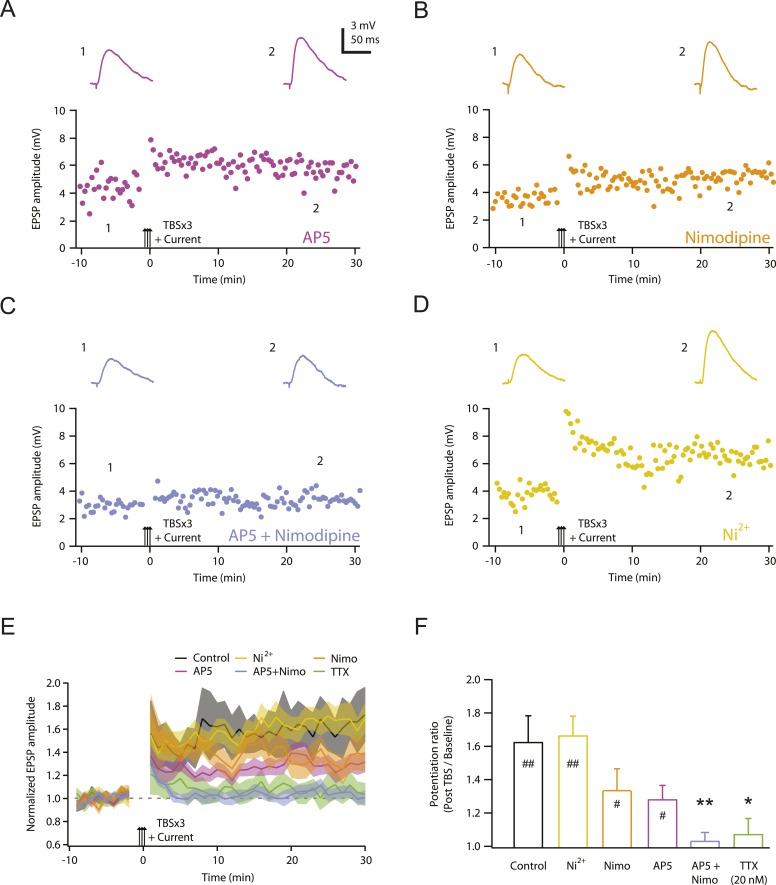
Figure 4. NMDAR and L-Cav channels mediate TBS-induced LTP at PP → CA1tuft synapses.
(A–D) Representative time course of EPSP amplitude before and after TBSx3+Current was delivered (arrows) in 50 µM AP5 (A), 10 µM nimodipine (B), 50 µM AP5 and 10 µM nimodipine (C), or 50 µM Ni2+ (D). Drugs were applied via the bath during the entire experiment. Top, representative traces (single trials) of EPSP before (1) and 25 min after (2) TBSx3+Current was delivered. The scale bar in A applies to all panels. (E) Summary of the LTP experiments in AP5, nimodipine (Nimo), AP5 and nimodipine (AP5+Nimo), and Ni2+, shown along with the data in control and 20 nM TTX (Figure 3) for comparison. EPSP amplitude is normalized to the average EPSP amplitude before LTP induction. Solid lines and shaded areas represent mean and S.E.M., respectively. (F) Potentiation ratio in different experimental conditions (Control, n = 9; AP5, n = 11; Nimo, n = 9; AP5+Nimo, n = 11; Ni2+, n = 9; 20 nM TTX, n = 8). ##p < 0.01, #p < 0.05 for the effect of time on EPSP amplitude by one-way repeated measures ANOVA. **p < 0.01, *p < 0.05 (all compared to control) by one-way ANOVA with post-hoc means comparison using Tukey's test.
DOI: http://dx.doi.org/10.7554/eLife.06414.016


