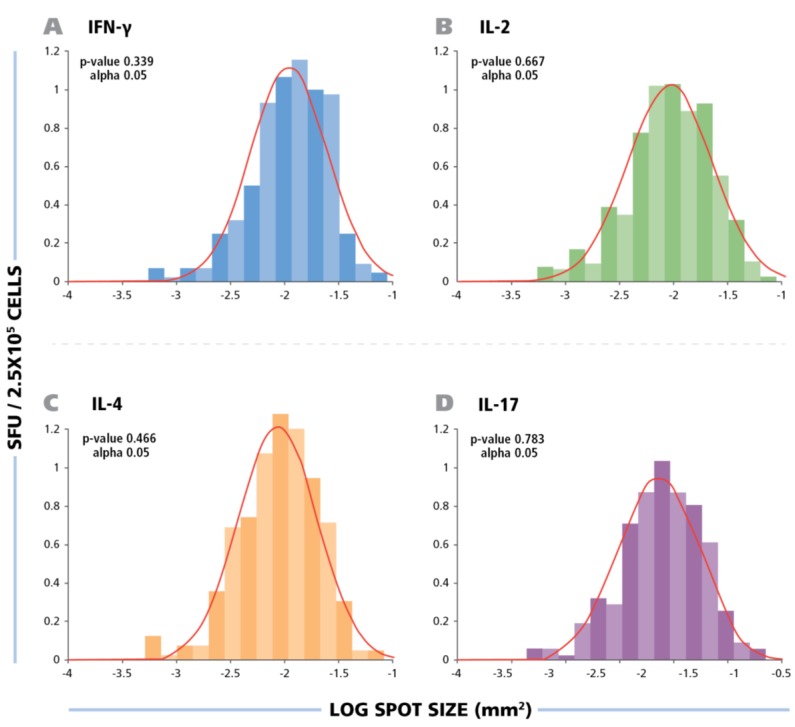
Figure 2.
The spot size distribution for different cytokines follow Log Normal distribution. The experimental size distribution of typical recall responses are shown as histograms for the specific cytokines (IFN-g, IL-2, IL-4, and IL-17) with the theoretical Log Normal distribution curve overlaid in red. To test for normality, Kolmogorov-Smirnov goodness of fit was used.

