Abstract
Osteocytes reside as three-dimensionally (3D) networked cells in the lacunocanalicular structure of bones and regulate bone and mineral homeostasis. Despite of their important regulatory roles, in vitro studies of osteocytes have been challenging because: (1) current cell lines do not sufficiently represent the phenotypic features of mature osteocytes and (2) primary cells rapidly differentiate to osteoblasts upon isolation. In this study, we used a 3D perfusion culture approach to: (1) construct the 3D cellular network of primary murine osteocytes by biomimetic assembly with microbeads and (2) reproduce ex vivo the phenotype of primary murine osteocytes, for the first time to our best knowledge. In order to enable 3D construction with a sufficient number of viable cells, we used a proliferated osteoblastic population of healthy cells outgrown from digested bone chips. The diameter of microbeads was controlled to: (1) distribute and entrap cells within the interstitial spaces between the microbeads and (2) maintain average cell-to-cell distance to be about 19 µm. The entrapped cells formed a 3D cellular network by extending and connecting their processes through openings between the microbeads. Also, with increasing culture time, the entrapped cells exhibited the characteristic gene expressions (SOST and FGF23) and nonproliferative behavior of mature osteocytes. In contrast, 2D-cultured cells continued their osteoblastic differentiation and proliferation. This 3D biomimetic approach is expected to provide a new means of: (1) studying flow-induced shear stress on the mechanotransduction function of primary osteocytes, (2) studying physiological functions of 3D-networked osteocytes with in vitro convenience, and (3) developing clinically relevant human bone disease models.
Introduction
Osteocytes reside as three-dimensionally (3D) networked cells in the lacunocanalicular structure of bones. 3D-networked osteocytes are known to function as master regulators of homeostatic bone remodeling.1–3 They are also known to play a role in the metabolic regulation of minerals4 and in the hematopoiesis process.5 Despite of their important regulatory roles, the mechanistic understanding of how osteocytes interact with bone marrow cells is still rather limited due to: (1) in vivo and ex vivo difficulties in accessing and characterizing osteocyte networks deeply embedded within hard bone structures; (2) technical challenges in isolating and culturing primary osteocytes while maintaining their in vivo phenotype and functions6,7; and (3) lack of osteocyte cell lines that sufficiently capture the phenotypic features of terminally differentiated, nonproliferating mature osteocytes.
In regard to the use of cell lines for clinically relevant applications, there is a growing concern about the current practice of immortalizing primary cells into cell lines by gene transfection which perturbs the cells’ gene expression profiles and cellular physiology.8 For example, commonly used murine osteocytic cell lines such as MLO-Y4 and MLO-A5 do not or insufficiently express important genes of mature osteocytes such as SOST and FGF23 (which produce sclerostin and fibroblast growth factor 23 proteins, respectively) during conventional 2D culture.9,10 Sclerostin is a major signaling molecule that keeps neighboring osteoblasts in a quiescent state when bone remodeling is not needed.11,12 Also, this protein has been identified as an important new drug target13 for treating osteoporosis14 and osteolytic lesions caused by bone metastases.15 Although it has been reported that 3D culture of Ocy454 cells with a porous polystyrene scaffold can be used to increase SOST and FGF23 expressions,16 this approach could not replicate cell-to-cell distance and spatial cell density in bone tissues. These geometrical features are known to be important for influencing cell–cell signaling pathways associated with osteocyte process growth and the 3D cellular network’s sensitivity for mechanotransduction.2,3
For the culture of primary osteocytes, there is currently no in vitro method that has shown to reproduce ex vivo the physiological phenotype of osteocytes harvested from animal and human bones, to our best knowledge. It has been observed that primary osteocytes differentiate back to osteoblasts within several days during conventional 2D culture.17,18 Also, in vitro differentiation of primary osteoblasts to SOST-expressing mature osteocytes through 3D cell culture has not been achieved, except for the work by Boukhechba et al.18 They reported that human primary osteoblasts cultured with biphasic calcium phosphate (BCP) microparticles could be used to produce SOST-expressing osteocyte-like cells after 4-week culture. However, their 3D culture produced random cell aggregates between interstitial spaces of 40–80 μm BCP particles and therefore did not replicate the spatial features of the in vivo 3D osteocyte network.
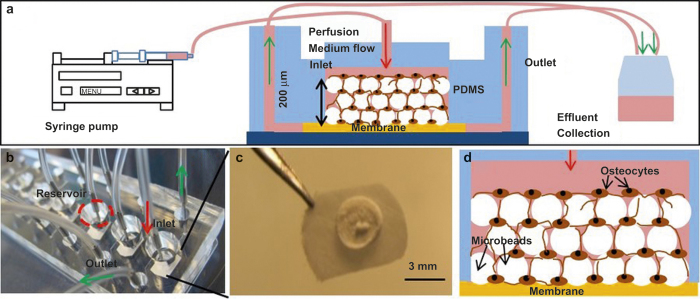
We recently reported19 that early osteocytes from a murine cell line (MLO-A5) could be assembled and cultured with BCP microbeads of 20–25 µm to guide the 3D cellular network formation of MLO-A5 cells within the physical confinement of a microfluidic perfusion culture chamber (Figure 1). We found that the microbead size of 20–25 µm was effective in: (1) allowing a single cell to be placed within the interstitial space between the microbeads, (2) mitigate the proliferation of the entrapped cell due to its physical confinement in the interstitial site, and (3) control cell-to-cell distance to be 20 µm as observed in murine bones.19 The entrapped cells formed a 3D cellular network by extending and connecting their processes through openings between the microbeads within 3 days of culture. The entrapped cells produced significant mineralized extracellular matrix (ECM) to fill up the interstitial spaces, resulting in the formation of a significantly denser and mechanically connected bone-like tissue structure during the course of the 3-week culture period. We also found that the time-dependent osteocytic transitions of the cells exhibited trends consistent with in vivo observations, particularly SOST gene expression.
Figure 1.
(a) Schematic illustration of perfusion culture system, (b) Picture of the microfluidic device with 8 culture chambers, (c) Picture of a reconstructed tissue sample harvested at Day 14, and (d) Schematic illustration of microbeads-guided 3D-network formation of osteocytes.
The results from our previous study suggested that the biomimetic 3D culture approach can be used to recapitulate the native microenvironments from which primary bone cells are harvested. With this new insight, the goal of this investigation was to further explore this biomimetic approach as a means of: (1) constructing ex vivo the 3D cellular network of primary murine osteocytes and (2) reproducing their genotypic and phenotypic features as SOST-expressing and nonproliferating cells. The specific aims were to: (1) isolate primary bone cells from digested bone chips from older (18–20 weeks) B10.BR/Jrep mice; (2) study the viability, differentiation, and proliferation of “outgrown” cells migrated out of the bone chips from the perspective of optimizing 3D construction procedures; and (3) investigate the effects of 3D perfusion culture on the viability, differentiation, and proliferation of the 3D-reconstructed cells.
Materials and methods
BCP microbeads
Spray-dried and sintered BCP microbeads were purchased from CaP Biomaterials, LLC, WI, USA. They were composed of 68% of hydroxyapatite and 32% of β-tricalcium phosphate according to the supplier. The microbeads were sieved to a size range of 20–25 μm and coated with collagen type I (Sigma-Aldrich, MO, USA) using a collagen/acetic acid solution (0.15 mg·mL−1) for 2 h. They were then washed with phosphate buffered saline (PBS) three times and stored for further use.
Preparation of bone cells outgrown from bone chips
Bones for cell isolation were obtained from 18 to 20 weeks old male and female B10.BR-H-2k H2-T18a/SgSnJ mice (The Jackson Laboratory, Bar Harbor, ME). The particular strain of mice was chosen due to its availability at Hackensack University Medical Center. Mice were bred and housed at the Department of Biological Resources Facility located at Hackensack University Medical Center, NJ, USA (Animal Welfare Assurance Number: A4278-01), under the direction of a trained veterinarian. Mice were kept in microisolator cages (5 mice per cage) connected to a passive ventilation system (Optimice). Water and food were accessible to the animals ad libitum. A total of 40 mice were used to complete all experiments. Hackensack University Medical Center Institutional Animal Care and Use Committees approved the animal protocol used for the conducted experiments. Mice were euthanized by CO2 inhalation as recommended by the Panel of Euthanasia of the American Veterinary Medical Association using a TT-8100 Table Top Chamber with a SMARTBOX mini controller (Euthanex, Palmer, PA, USA).
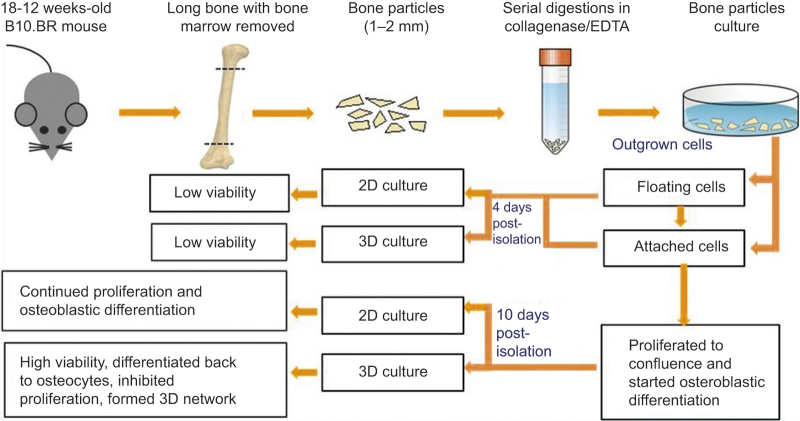
As shown in Figure 2, long bones from four mice per experiment were harvested, cleaned, and diced into small pieces of 1–2 mm long and 1 mm wide. Bone cells were isolated from the bone chips using the procedures previously developed by Stern et al.20 In brief, the bone fragments were digested using a collagenase solution (300 active U·mL−1 in α-MEM) and an ethylenediamine-tetraacetic acid solution of 5 mmol·L−1 in 1% bovine serum albumin (BSA). A total of seven consecutive digestions (25 min for each digestion) were performed. Cells migrated out of the post-digested bone chips were cultured in collagen-coated six-well plates using osteogenic α-minimal essential medium (α-MEM) containing 3 mmol·L−1 β-lycerophosphate, 50 µg·mL−1 L-ascorbic acid, 10% fetal bovine serum (FBS), and 1% penicillin/streptomycin (P/S) under the incubator conditions of 37 °C and 5% CO2. After 1 and 4 days of culture, non and slightly adherent cells were pipetted out from the wells and stained with trypan blue to count dead cells using a microscope.
Figure 2.
Summary of cell isolation and preparation procedures, 3D and 2D culture experiments, and major experimental observations.
Time-lapsed microscopy during outgrown cell culture
To perform real-time imagining, bone chips were placed in the middle of a collagen-coated six-well plate in modified osteogenic α-MEM with 10 mmol·L−1 4-(2-hydroxyethyl)-1-piperazineethanesulfonic acid (HEPES, Sigma-Aldrich) to adjust pH in the medium. The six-well plate was then placed on an automated stage of a fluorescent microscope (Nikon Ti-E, Nikon Instruments, Inc., NY, USA). The microscope stage was housed in an environmental chamber (In Vivo Scientific, CA, USA) and maintained at 37 °C and >90% humidity. In order to monitor the migration of cells from bone chips, images were taken every 10 min to generate 16-h time-lapse videos.
Immunostaining of outgrown cells
Outgrown cells cultured for 3, 7, and 10 days were used to analyze protein production. Prior to immunostaining, the medium was removed from the culture wells. Cells were then washed two times using PBS, followed by fixation with 4% paraformaldehyde (PFA) for 10 min. After fixation, cells were incubated with 0.02 mg·mL−1 phycoerythrin (PE) anti-mouse podoplanin (E11) antibody (BioLegend, CA, USA) for 20 min and washed with PBS three times. For sclerostin and alkaline phosphatase (ALP) staining, the fixed cells were permeabilized using 0.1% triton x-100 for 10 min. To block unspecific antibody binding, cells were incubated in 3% BSA for 1 h at room temperature. After blocking cells were then incubated overnight at 4 °C with a goat anti-mouse sclerostin antibody (affinity purified polyclonal antibody, RnD systems, MN, USA) or ALP antibody (RnD systems) followed by secondary staining with a fluorescence-conjugated antibody (rhodamine AffiniPure rabbit anti-goat IgG, Jackson ImmunoResearch Laboratories, PA, USA). ALP expression was also tested by TRACP&ALP double-stain Kit (TaKaRa, Shiga, Japan). In this staining, ALP-positive cells presented with a light purple stain. Early osteocytic cell line (MLO-A5) used as ALP-positive/sclerostin-negative control. Normal goat IgG (RnD systems) was used as negative control.
Microbeads-guided 3D cellular network construction during perfusion culture
A polydimethylsiloxane (PDMS)-based microfluidic culture device, which consisted of eight culture chambers, was used (Figure 1b). As described elsewhere in detail,21 soft-lithography was used to fabricate a PDMS layer containing hexagonal patterns of 6 mm × 12 mm with 200 μm thick. About 3-mm holes were then punched in the middle of patterns to form culture chambers. The PDMS housing was then bonded to a glass slide while placing a filter membrane layer (MF, Millipore, MA, USA) of 6 mm in diameter and 200 μm in thickness between the PDMS layer and the glass slide.
Outgrown cells were physically removed from the well-plate wells by pipetting after 4 days of culture or by trypsinization when cells were cultured for 10 days. Removed cells were mixed thoroughly with BCP microbeads at concentrations of 107 cells per mL and 107 microbeads per mL in the osteogenic α-MEM medium with 10% (v/v) FBS, 50 μg·mL−1 ascorbic acid (Sigma-Aldrich), 3 mmol·L−1 β-glycerophosphate (Sigma-Aldrich), and 1% (v/v) P/S. About 10 μL of the mixture was placed using a micropipette onto the top of the membrane in each culture chamber to form a ∼200-μm thick tissue sample (Figure 1a and 1d). After waiting for 12 h to attach cells to the surface of microbeads, the microfluidic chamber was sealed from the top by inserting a PDMS cap into the chamber (Figure 1a). The space between the bottom of the cap and the tissue sample surface was kept at ∼1 mm.
The device was placed inside of a conventional CO2 incubator and cultures were perfused using the detailed procedures described previously.21 The long-term cell culture inside the incubator was supported by the use of PDMS commercially due to its permeability to O2 and CO2.22 Osteogenic α-MEM was supplied to the culture chambers using syringe pumps (KDS230; KD Scientific, MA, USA) located outside of the incubator via polyethylene tubing. The reconstructed tissue samples were cultured up to 42 days at a flow rate of 0.8 μL·min−1. For 2D culture control, cells were seeded into 24-well plates at a concentration of 10 000 cells per well. Culture medium was replaced every 1–2 days. After 7 days culture, the 3D tissue samples were harvested from the perfusion chambers and stained with live/dead viability/cytotoxicity kit (Life Technologies, CA, USA). The stained 3D tissue was dissociated into single cells with a tissue grinder. Live (green) and dead (red) cells were counted and averaged from 10 different randomly selected fields with 20–50 cells per field.
RT-PCR
RT-PCR quantification of gene expression of outgrown cells was performed on Days 1, 4, and 7 after culture following digestion procedures. RNA was isolated using a RNA Mini kit (Ambion, NY, USA) as per manufacturer’s instructions. For the 3D-constructed cells, RNA was isolated after 8 days and 14 days. Also, RNA was extracted from the cells prior to 3D culture as control and from the cells in 2D control culture. One microgram of the total extracted RNA from each sample was used for cDNA synthesis as follows: 3 μL of 10 mmol·L−1 Oligo-dT solution (Sigma-Aldrich) was added to 16.5 μL of the RNA solution, heated at 75 °C for 5 min, and cooled on ice. A total of 30 μL reaction solution was prepared by adding 1 μL RNasin ribonuclease inhibitor (Promega, WI, USA), 1.5 μL dNTp (Promega), 2 μL reverse transcriptase (Promega), and 6 μL reverse transcriptase buffer (Promega). cDNA was prepared by incubating the reaction solution for 1.5 h at 37 °C in a water bath. To stop the reaction process samples were heated at 95 °C for 3 min and immediately placed on ice. For RT-PCR, a final volume of the 20 μL reaction solution, consisting of 2 μL of the cDNA template, 1 μL of the primer, 10 μL of RT-PCR master mix (Taqman, CA, USA), and 7 μL of DEPC-treated water, was prepared for quantitative RT-PCR assay (StepOnePlus, Applied Biosystems, CA, USA). Amplification conditions were as follows: 95 °C, 20s; 95 °C, 1 s, 60 °C, 20 s, 40 cycles.
Target gene expression was normalized to GAPDH and fold changes in expression relative to untreated control were determined using the 2-(Ct(target gene)-Ct(GAPDH)). The following genes were analyzed ALPL (encoding alkaline phosphatase, an osteoblast marker), E11 (encoding podoplanin, a preosteocyte marker), DMP1 (encoding dentin matrix acidic phosphoprotein 1, a preosteocyte marker), SOST (encoding sclerostin, a mature osteocyte marker), and FGF23 (encoding fibroblast growth factor 23, a mature osteocyte marker). All primers for gene expression were purchased from Taqman and are summarized in Table 1.
Table 1. Primers used in RT-PCR.
| Target gene | Taqman gene expression assay primer | Amplicon length/bp |
|---|---|---|
| ALPL | Mm00475834_ml | 65 |
| PDPN (E11) | Mm01348912_gl | 120 |
| DMP1 | Mm01208363_ml | 74 |
| FGF23 | Mm00445621_ml | 98 |
| SOST | Mm00470479_ml | 55 |
Immunohistology and scanning electron microscopy
After culturing cells for 7 and 14 days, the 3D culture samples were removed from the culture chambers and fixed with 4% PFA. Fixed samples were not decalcified and sent to the Histology Core Facility at the New Jersey Medical School of Rutgers University for paraffin embedding and sectioning. The samples were cut into histological sections of 10-μm thick. Sections were stained with hematoxylin and eosin (H&E, Sigma-Aldrich) and 4′,6-diamidino-2-phenylindole (DAPI, Sigma-Aldrich) to examine cell distribution under a fluorescent microscope (Nikon Ti). Parallel samples were used for sclerostin and ALP immunostainings as described above. Some of the samples were dehydrated in sequential ethanol solutions with increasing concentrations from 50% to 100% with gold-coating and directly visualized under a scanning electron microscope (SEM, Zeiss Auriga FIB-SEM, CA, USA).
Statistics
The live/dead viability assay was performed in triplicate culture samples. The RT-PCR analysis of the outgrown cells was performed in duplicate culture samples. The RT-PCR analysis of 3D-constructed cells was conducted in duplicate culture samples and that of the 2D-cultured cells was performed in triplicates. Immunostaining of outgrown cells and immunohistology of the 3D-constructed cells were performed with duplicate culture samples. For multiple comparisons (>2 groups), one-way repeated measures ANOVA was conducted followed by Tukey’s multiple comparison test on individual pairs to determine significant differences among groups when ANOVA test was statistically significant. Student t test was used when comparing two groups. A P < 0.05 was considered significant. GraphPad software was used to perform analyses.
Results
A small population of outgrown cells remained viable, proliferated, and differentiated to become osteoblastic during 2D culture
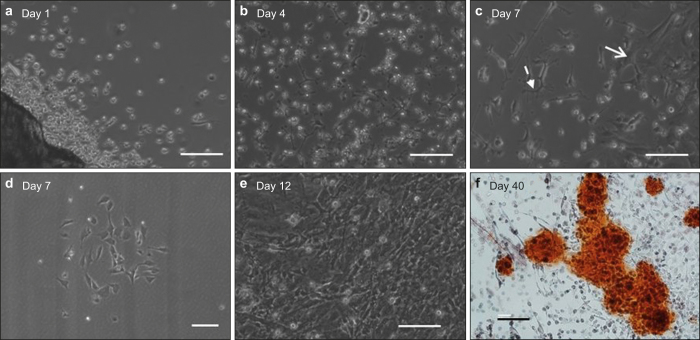
The movement of cells migrated out of digested bone chips was monitored using time-lapse microscopy. A 16-h video (Supplemental Movie 1) shows that the outward migration of cells started as early as 1 h after the last digestion step and continued throughout the entire duration of the video. Most of the cells were round and floating in the medium when they just came out of the bone chips (Figure 3a). Some cells settled down, and attached to the well surface, while other cells did not attach or spread. The viability of the unattached cells was determined to be 87% ± 6% after 1 day of culture and 54.2% ± 7% (P < 0.05) after 3 days (Supplemental Figure 1). These unattached cells eventually underwent apoptosis. In contrast, the attached cells began to spread and grew very short dendritic processes within the first day of culture (Figure 3a). By Day 4, the cells formed longer processes (Figure 3b). By Day 7, two populations among the attached cells began to appear: (1) wider and spread cells and (2) smaller and elongated cells as shown in Figure 3c. By Day 7, many colonies of the wider and spread cells could be observed (Figure 3d). The rapid growth of these colonies dominated the culture wells after 12 days (Figure 3e), which was followed by the visible formation of significant ECM with mineralization production after 40 days (Figure 3f).
Figure 3.
Time-lapsed micrographs showing the morphological changes of cells migrated out of bone chips: (a) mostly round and floating cells with some attached cells forming short dendrite processes at Day 1, (b) attached cells forming longer dendrite processes at Day 4, (c) development of wide/spread cells (solid arrow) and elongated cells (dash arrow) at Day 7, (d) colony formation by wide/spread cells at Day 7, (e) domination of wide/spread cell colonies at Day 12, and (f) alizarin red staining showing significant mineral production at Day 40. Scale bar: 100 µm.
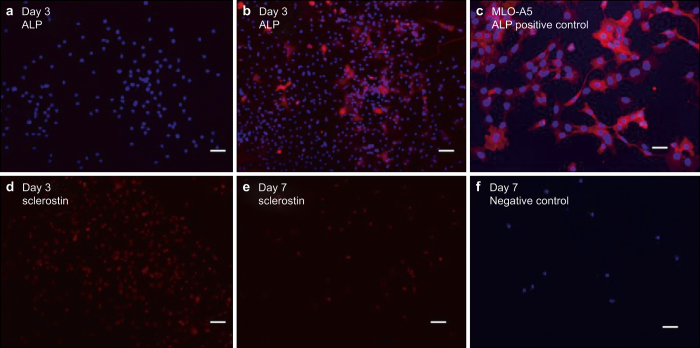
In order to determine the osteocytic and osteoblastic nature of the attached outgrown cells, immunostaining of ALP as an osteoblast marker, E11 as a preosteocyte marker, and sclerostin as a mature osteocyte marker were performed on Days 3, 7, and 10.23–25 The ALPstaining data in Figure 4a and 4b suggested that most cells were ALP-negative at Day 3 but developed positive ALP expression by Day 7. As shown in Supplemental Figure 2, most cells expressed E11 by Day 7 along with the apparent development of stellate cell shape and dendritic processes. Also, the image shows that the wide and spread cells were ALP-positive and the small and elongated cells were ALP-negative. The sclerostin staining data in Figure 4d and 4e suggested that most cells were sclerostin-positive between Days 3 and 7.
Figure 4.
Immunostaining images of outgrown cells at Day 3 and Day 7: (a, b) ALP, (c) MLO-A5 cells used as ALP-positive control, (d, e) sclerostin, and (f) normal goat IgG as negative control. Nuclei stained by DAPI (blue), ALP (red), and sclerostin (red). Scale bar: 50 µm.
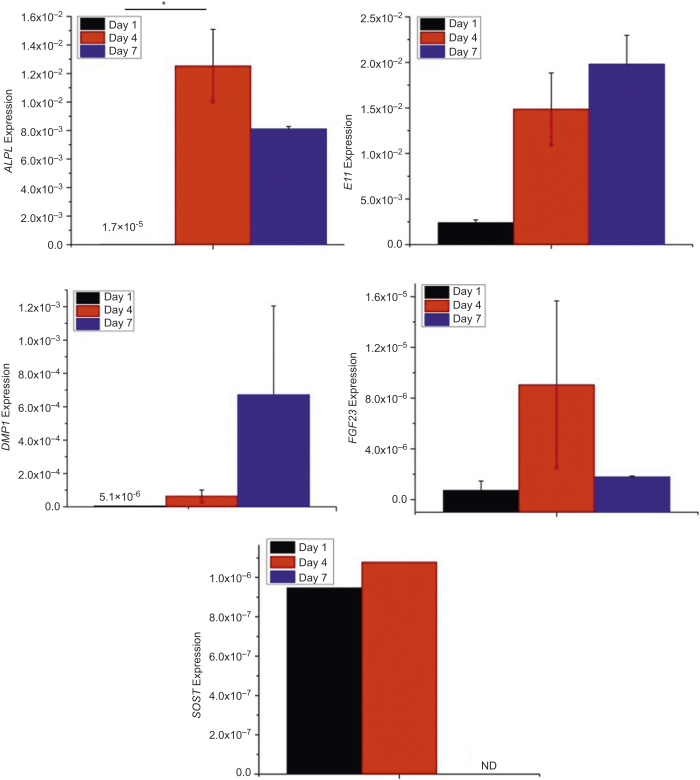
The RT-PCR results in Figure 5 suggested that ALPL expression was quite low on Day 1 (1.7 × 10⁻⁵ ± 7 × 10⁻⁷), significantly increased by Day 4 (1.3 × 10⁻² ± 3 × 10⁻³, P < 0.05), and then decreased slightly by Day 7 (8.1 × 10⁻³ ± 0.2 × 10⁻⁴). As shown in Figure 5, E11 and DMP1 gene expressions increased with time. FGF23 expression remained very low even at later time points. SOST expression was detected at very low levels in one out of two wells on Days 1 and 4 but was undetectable on Day 7.
Figure 5.
ALPL, E11, DMP1, FGF23, and SOST gene expressions of outgrown cells during 2D culture. *P < 0.05. The data presented are the result from cell isolation with four mice. Cells were cultured in duplicate culture wells. Each bar graph is the average of the two samples. SOST expression was only detected in one of the two wells at Days 1 and 4.
Taken together, the above results suggested that: (1) the digestion procedures substantially damaged cell populations present inside the bone chips and (2) the attached population of relatively healthy outgrown cells were mostly osteocytic at the beginning of 2D culture but differentiated to become osteoblastic and proliferated during culture.
Construction of viable 3D cellular network was possible using differentiated and proliferated outgrown cells.
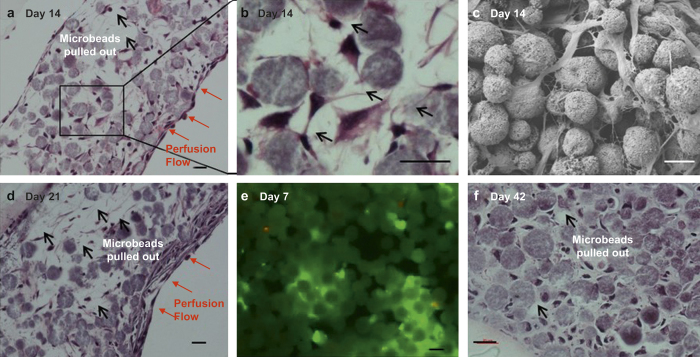
We first investigated the effect of post-digestion culture time of outgrown cells in well plates on the viability of 3D-reconstructed cells with BCP microbeads upon subsequent culture in the perfusion chambers. The best results were obtained with outgrown cells that become attached, differentiated, and proliferated after culture for 10 days in well plates. Figure 1c shows that a mechanically integrated 3D tissue structure could be produced after 14 days of culture in the microfluidic perfusion chamber. The H&E-stained histologic images in Figure 6a and 6d show that cells were relatively well distributed in the interstitial spaces between microbeads with about 89% and 82% interstitial site occupancy after 14 and 21 days, respectively. Also, about 82% of the cells were found to be live by live/dead staining after 7 days (Figure 6e). As shown in the SEM image (Figure 6c), cells were attached to and spread on microbead surface. In some areas, neighboring cells became interconnected through their processes and form a 3D cellular network (Figure 6b).
Figure 6.
Histologic and SEM images and after 3D culture of 10-day-old outgrown cells: (a, b, d, f) H&E staining, (c) SEM image, and (e) live/dead staining. Scale bar: 20µm.
The production of ECM by the entrapped cells was not apparent during the first 21-day culture period (Figure 6a and 6c). Because of this reason, the tissue samples were still relatively fragile to preserve their “true” spatial information during histological procedures as evidenced by significant microbeads pullouts. However, appreciable ECM formation was observed after 42 days of culture (Figure 6f). With a relatively dense structure was formed at Day 42, we were able to measure the average cell-to-cell distance to be about 19 μm and the interstitial site occupancy to be about 90%.
In comparison, when we used mostly floating outgrown cells after 4 days of culture in well plates, most cells did not survive through subsequent 2D culture and 3D perfusion culture. Although in 2D culture, most cells were not viable after 1 day culture and became debris (Supplemental Figure 3a and 3b), some surviving cells proliferated significantly by Day 4 and Day 8 (Supplemental Figure 3c). In contrast, most cells did not survive 3D culture (Supplemental Figure 4a and 4b). These results suggested that floating cells were significantly damaged by the digestion procedures and could not recover to remain viable during 3D and 2D culture. Taken together, the 3D construction culture was feasible with the use of healthy but differentiated cells that were proliferated from the attached population of outgrown cells.
3D-constructed cells differentiated to osteocytes and did not proliferate during perfusion culture
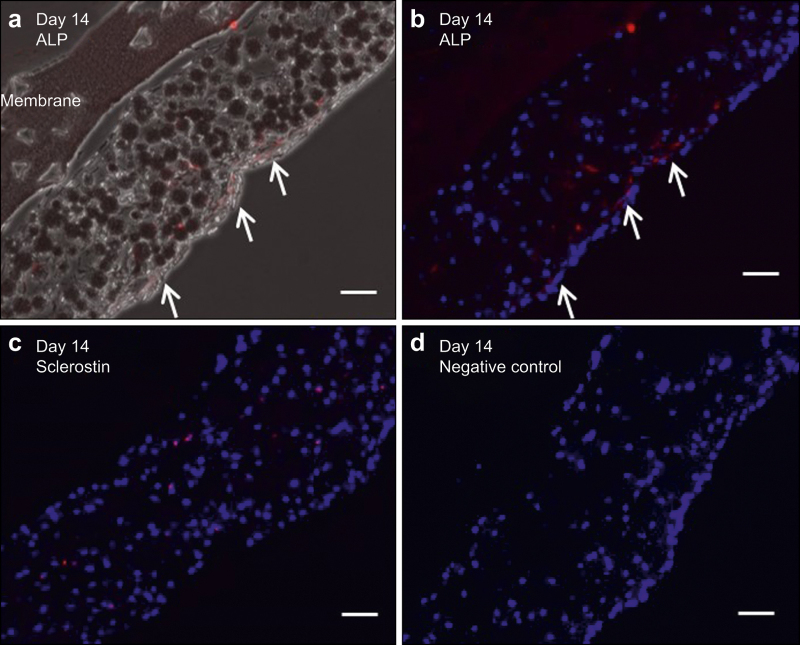
The histologic immunostaining data (Figure 7) show that 3D-constructed cells after 14 days of culture can produce sclerostin or ALP, depending on their location. Sclerostin-positive cells were found within the tissue structure (Figure 7c), whereas ALP-positive cells were mainly located at the surface of the 3D tissue sample (Figure 7a and 7b). In comparison, outgrown cells that were continuously cultured in 2D remained ALP-positive and sclerostin-negative.
Figure 7.
Immunohistology images after 14 days of 3D culture of 10-day old outgrown cells: (a) ALP (red), (b) ALP (red) and DAPI (blue), (c) sclerostin (red) and DAPI (blue), and (d) normal goat IgG as negative control. Scale bar: 50 µm.
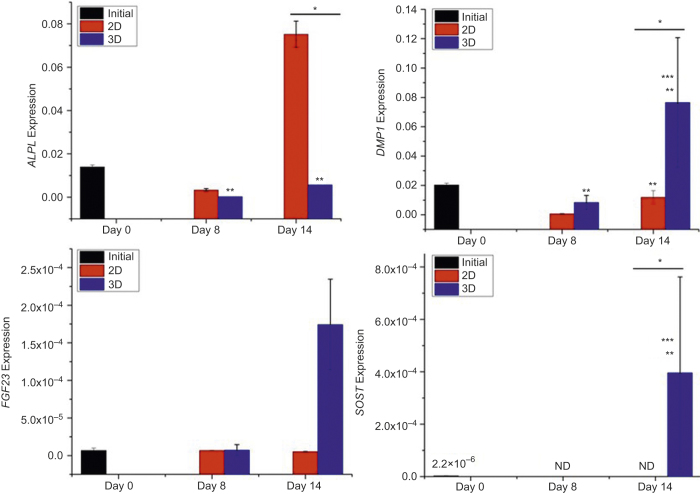
The RT-PCR data (Figure 8) show that ALPL expression of 3D-constructed cells was significantly decreased upon perfusion culture. In contrast, ALPL expression in 2D culture was significantly increased by Day 14. DMP1 expression increased with time during 3D culture and was significantly higher than that in 2D culture after 14 days. Because cells were osteoblastic prior to 3D construction, SOST expression was very low at the beginning of 3D culture but became significant after 14 days. In contrast, SOST expression became undetectable in 2D culture. FGF23 gene expression was initially detected in both 2D and 3D. FGF23 gene expression was significantly increased in 3D after 14 days but remained at a similar level in 2D.
Figure 8.
Osteocytic and osteoblastic gene expressions of 3D- and 2D-cultured outgrown cells. The data presented are the result from cell isolation with four mice. Cells were cultured in duplicate culture wells. Each bar graph is the average of the two samples. *Significant difference between 2D and 3D. **Significant difference compared to Day 0. ***Significant difference compared to previous time point. P < 0.05.
As shown in Figure 6a, 6d, and 6f, entrapped cells at the interstitial spaces between microbeads did not proliferate with culture time. In contrast, cells resided on the surface of the 3D tissue sample proliferated to form one or two layers of cells at Day 14 (Figure 6a) and 4 or more layers by Day 21 (Figure 6d). In comparison, outgrown cells, that were re-plated and cultured in 2D, proliferated rapidly to reach confluence in 5 days and continued to grow and form colonies (Supplemental Figure 3d–3f). By Day 14, several layers of cells were found in 2D culture. The results suggested the inhibitory effect of microbeads-induced physical entrapment on cell proliferation.
Discussion
Our results in Figure 3a and 3b show that the digestion procedures substantially damaged outgrown cells as evidenced by the appearance of round and floating cells. Most of these cells did not attach and consequently died during 2D culture. However, a small population of relatively healthy cells became attached, spread, and began to form dendritic processes within 1–3 days of culture. Most of these attached cells were appeared to be osteocytic at the beginning of culture (Figures 3, 4, 5). Subsequently, these cells differentiated to become osteoblastic, proliferated significantly, and produced mineralized ECM over 10 days of culture. These results were consistent with prior observations reported by other investigators.20,26,27 For example, Stern et al.20 reported that about 85% of outgrown cells from murine bone chips were identified by immunostaining to be ALPL-negative and therefore osteocyte-like cells. Also, Torreggiani et al.27 observed that outgrown cells differentiated to become osteoblastic and proliferated during 2D ex vivo culture.
It was interesting to observe that attached cells were immunostained as sclerostin-positive at Days 3 and 7 (Figure 4d and 4e), but their SOST gene expression was not detected by RT-PCR (Figure 5). This discrepancy may be explained by a possibility that the cells quickly lost the SOST gene expression, but previously produced sclerostin molecules remained within the cells. This conjecture may be supported by prior observations that outgrown cells can quickly lose their in vivo gene expressions. For example, Torreggiani et al.27 reported that outgrown cells from DMP1-GFP mice were initially florescence positive for GFP but quickly lost fluorescence immediately after migrating out of bones. Furthermore, the observed rapid loss of SOST expression by outgrown cells is consistent with the previous observation by Stern et al.20 They reported that outgrown cells had much lower SOST expression after 7 days of isolation compared to the expression measured from the bone lysate of the same mouse.
The histologic images in Figure 6 show that the construction of the 3D cellular network of osteocytes was possible with the use of osteoblastic cells proliferated from attached outgrown cells. The microbead size of 20–25 µm was effective in allowing a single cell to be placed within the interstitial space between the microbeads. Many of the entrapped cells formed a 3D cellular network by extending their processes through openings between the microbeads. Also, the cell-to-cell distance could be controlled to be 19 µm. The observed control of cell-to-cell distance is noteworthy since cell–cell signaling is associated with osteocyte process growth and the 3D network’s sensitivity for mechanotransduction.2,3
The images in Figure 6 also show that 3D-reconstructed cells entrapped by microbeads did not proliferate. In contrast, cells located on the surface of the 3D tissue sample proliferated significantly to form multiple layers of cells by Day 21. Also, cells cultured in 2D continued to proliferate significantly (Supplemental Figure 3). The inhibited proliferation of entrapped primary cells at the interstitial sites is consistent with our previous observation with MLO-A5 cells.19 This inhibited proliferative behavior of 3D-reconstructed cells is important since proliferation can lead to the formation of disordered, random cell aggregates as previously observed by: (1) Boukhechba et al.17 during MLO-A5 cell culture with 40–80 μm BCP particles and (2) Mulcahy et al.28 during MLO-Y4 cell culture with matrigel. The production of ECM by entrapped outgrown cells was not evident from the H&E images shown in Figure 6 until 21 days but became significant after 42 days. In comparison, we previously observed19 that entrapped MLO-A5 cells (early osteocytic cell line) produced significant amounts of mineralized ECM, resulting in the development of a very dense tissue structure within 10 days.
The immunostaining results in Figure 7 showed that cells located on the surface of the 3D tissue structure tended to be osteoblastic while cells resided in the interstitial sites between microbeads were osteocytic. These results suggested that 3D entrapment of the cells by microbeads induced their differentiation to osteocytes. Also, the RT-PCR results in Figure 8 support that 3D-constructed cells differentiated to osteocytes, as evidenced by significantly increased DMP1, SOST, and FGF23 expressions during 3D perfusion culture. In contrast, the results in Figure 8 suggested that 2D-cultured cells became more osteoblastic in nature as suggested by significantly increased ALPL expression and undetectable SOST expression. Interestingly, the transition gene (DMP1) associated with mineralization was higher for 3D-reconstructed cells than for 2D-cultured cells at Days 8 and 14. This could be explained by prior observations29 that DMP1 is expressed more in osteocytic cells than in osteoblastic cells.
Taken together, the above results supported that the 3D construction approach was effective at reproducing the in vivo state of terminally proliferated and SOST- and FGF23-expressing osteocytes upon subsequent microfluidic culture. We also observed similar time-dependent osteocytic transition of 3D-constructed MLO-A5 cells, particularly with significantly increased SOST gene expression during microfluidic culture.19 The high SOST expression of 3D-constructed cells suggests that our approach can be used to investigate the mechanotransduction function of primary osteocytes with in vitro convenience and in a high-throughput manner. For example, in combination of perfusion culture, the effects of flow-induced shear stress on the SOST gene expression of 3D-constructed osteocytes as well as the role of their cellular network could be systematically studied. Also, the biomimetic approach could be extended for use with primary outgrown cells harvested discarded human bones from orthopedic implant surgeries.
These future developments may ultimately enable the use of 3D-constructed human osteocytes as in vitro bone tissue models for the preclinical evaluation of new drugs such as sclerostin and Dkk1 antibodies for treating osteoporosis and bone metastasis. This projection is consistent with a rapidly growing recognition for critical importance of developing microphysiological relevant human 3D tissue models30 as a new means for preclinical drug evaluation to reduce our reliance on animal models that have limited relevance to humans and therefore often poorly correlate with clinical outcomes. From this perspective, this investigation provides an initial framework associated with the development of microphysiological human bone tissue and disease models.
Conclusions
We used a 3D perfusion culture approach to: (1) construct the 3D cellular network of primary murine osteocytes by biomimetic assembly with microbeads and (2) reproduce ex vivo the phenotypic state of the primary osteocytes. Primary osteocytes were isolated from long bones of 20-week-old mice by collagenase digestion. Most cells outgrown from digested bone chips were significantly damaged and consequently did not survive during 2D culture. However, a small population of relatively healthy cells became attached, differentiated to become osteoblastic, proliferated significantly, and produced mineralized ECM over 10 days of 2D culture. In order to enable 3D construction with a sufficient number of viable cells, we used the osteoblastic cells proliferated from the small population of healthy outgrown cells after 10 days of post isolation. The diameter of microbeads was controlled to: (1) distribute and entrap cells within the interstitial spaces between the microbeads and (2) maintain average cell-to-cell distance to be 19 µm. The entrapped cells formed a 3D cellular network by extending and connecting their processes through openings between the microbeads. Also, with increasing culture time, the entrapped cells exhibited the characteristic gene expressions (SOST and FGF23) and nonproliferative behavior of mature osteocytes. In contrast, 2D-cultured cells continued their osteoblastic differentiation and proliferation. The inhibited proliferation of the entrapped cells was attributed to their physical confinement within the interstitial sites. Also, 3D confinement of the cells appeared to enable their differentiation to osteocyte phenotype.
Acknowledgments
Research in this publication was supported by grants from: (1) the National Institute of Arthritis and Musculoskeletal and Skin Diseases of the National Institutes of Health (1R21AR065032 to W.Y.L and J.Z.) and (2) the National Science Foundation (DMR 1409779 to W.Y.L and J.Z.). The content is solely the responsibility of the authors and does not necessarily represent the official views of the National Institutes of Health and the National Science Foundation. We would like to thank Prof. Lynda Bonewald at University of Missouri, Kansas City for kindly providing us with the MLO-A5 cells. We also thank Prof. Peter Tolias at the Stevens Institutes of Technology for useful discussions during this study.
Footnotes
The authors declare no conflict of interest.
Time lapse video for outgrown cells migrating out from bone chip. Duration: 16 hours.
References
- Dallas SL, Prideaux M, Bonewald LF. The osteocyte: an endocrine cell and more. Endocr Rev 2013; 34: 658–690. [DOI] [PMC free article] [PubMed] [Google Scholar]
- Loiselle AE, Jiang JX, Donahue HJ. Gap junction and hemichannel functions in osteocytes. Bone 2013; 54: 205–212. [DOI] [PubMed] [Google Scholar]
- Franz-Odendaal TA, Hall BK, Witten PE. Buried alive: how osteoblasts become osteocytes. Dev Dyn 2006; 235: 176–190. [DOI] [PubMed] [Google Scholar]
- Bonewald LF. The amazing osteocyte. J Bone Miner Res 2011; 26: 229–238. [DOI] [PMC free article] [PubMed] [Google Scholar]
- Asada N, Katayama Y, Sato M et al. Matrix-embedded osteocytes regulate mobilization of hematopoietic stem/progenitor cells. Cell Stem Cell 2013; 12: 737–747. [DOI] [PubMed] [Google Scholar]
- Kalajzic I, Matthews BG, Torreggiani E, Harris MA, Divieti Pajevic P, Harris SE. In vitro and in vivo approaches to study osteocyte biology. Bone 2013; 54: 296–306. [DOI] [PMC free article] [PubMed] [Google Scholar]
- Guo XE, Takai E, Jiang X et al. Intracellular calcium waves in bone cell networks under single cell nanoindentation. Mol Cell Biomech 2006; 3: 95–107. [PubMed] [Google Scholar]
- Lorsch JR, Collins FS, Lippincott-Schwartz J. Cell Biology. Fixing problems with cell lines. Science 2014; 346: 1452–1453. [DOI] [PMC free article] [PubMed] [Google Scholar]
- Yang W, Harris MA, Heinrich JG, Guo D, Bonewald LF, Harris SE. Gene expression signatures of a fibroblastoid preosteoblast and cuboidal osteoblast cell model compared to the MLO-Y4 osteocyte cell model. Bone 2009; 44: 32–45. [DOI] [PMC free article] [PubMed] [Google Scholar]
- Papanicolaou SE, Phipps RJ, Fyhrie DP, Genetos DC. Modulation of sclerostin expression by mechanical loading and bone morphogenetic proteins in osteogenic cells. Biorheology 2009; 46: 389–399. [DOI] [PubMed] [Google Scholar]
- Klein-Nulend J, Nijweide PJ, Burger EH. Osteocyte and bone structure. Curr Osteoporos Rep 2003; 1: 5–10. [DOI] [PubMed] [Google Scholar]
- Heino TJ, Hentunen TA, Väänänen HK. Osteocytes inhibit osteoclastic bone resorption through transforming growth factor-beta: enhancement by estrogen. J Cell Biochem 2002; 85: 185–197. [DOI] [PubMed] [Google Scholar]
- Rachner TD, Khosla S, Hofbauer LC. Osteoporosis: now and the future. Lancet 2011; 377: 1276–1287. [DOI] [PMC free article] [PubMed] [Google Scholar]
- Burge R, Dawson-Hughes B, Solomon DH, Wong JB, King A, Tosteson A. Incidence and economic burden of osteoporosis-related fractures in the United States, 2005–2025. J Bone Miner Res 2007; 22: 465–475. [DOI] [PubMed] [Google Scholar]
- Roodman GD. Mechanisms of bone metastasis. Discov Med 2004; 350: 1655–1664. [DOI] [PubMed] [Google Scholar]
- Pajevic PD, Spatz JM, Garr J, Adamson C, Misener L. Osteocyte biology and space flight. Curr Biotechnol 2013; 2(3): 179–183 [DOI] [PMC free article] [PubMed] [Google Scholar]
- van der Plas A, Aarden EM, Feijen JH et al. Characteristics and properties of osteocytes in culture. J Bone Miner Res 1994; 9: 1697–1704. [DOI] [PubMed] [Google Scholar]
- Boukhechba F, Balaguer T, Michiels JF et al. Human primary osteocyte differentiation in a 3D culture system. J Bone Miner Res 2009; 24: 1927–1935. [DOI] [PubMed] [Google Scholar]
- Gu Y, Zhang W, Sun Q, Hao Y, Zilberberg J, Lee WY. Microbeads-guided reconstruction of 3D osteocyte network during microfluidic perfusion culture. J Mater Chem B 2015; 3: 3625–3633. [DOI] [PMC free article] [PubMed] [Google Scholar]
- Stern AR, Stern MM, Van Dyke ME, Jähn K, Prideaux M, Bonewald LF. Isolation and culture of primary osteocytes from the long bones of skeletally mature and aged mice. Biotechniques 2012; 52: 361–373. [DOI] [PMC free article] [PubMed] [Google Scholar]
- Lee JH, Wang H, Kaplan JB, Lee WY. Microfluidic approach to create three-dimensional tissue models for biofilm-related infection of orthopaedic implants. Tissue Eng Part C Methods 2011; 17: 39–48. [DOI] [PubMed] [Google Scholar]
- Merkel TC, Bondar VI, Nagai K, Freeman BD, Pinnau I. Gas sorption, diffusion, and permeation in poly(dimethylsiloxane). J Polym Sci B: Polym Phys 2000; 38: 415–434. [Google Scholar]
- Mikuni-Takagaki Y, Kakai Y, Satoyoshi M et al. Matrix mineralization and the differentiation of osteocyte-like cells in culture. J Bone Miner Res 1995; 10: 231–242. [DOI] [PubMed] [Google Scholar]
- Zhang K, Barragan-Adjemian C, Ye L et al. E11/gp38 selective expression in osteocytes: regulation by mechanical strain and role in dendrite elongation. Mol Cell Biol 2006; 26: 4539–4552. [DOI] [PMC free article] [PubMed] [Google Scholar]
- Dallas SL, Bonewald LF. Dynamics of the transition from osteoblast to osteocyte. Ann NY Acad Sci 2010; 1192: 437–443. [DOI] [PMC free article] [PubMed] [Google Scholar]
- Gu G, Nars M, Hentunen TA, Metsikkö K, Väänänen HK. Isolated primary osteocytes express functional gap junctions in vitro. Cell Tissue Res 2006; 323: 263–271. [DOI] [PubMed] [Google Scholar]
- Torreggiani E, Matthews BG, Pejda S et al. Preosteocytes/osteocytes have the potential to dedifferentiate becoming a source of osteoblasts. PLoS One 2013; 8: e75204. [DOI] [PMC free article] [PubMed] [Google Scholar]
- Mulcahy LE, Taylor D, Lee TC, Duffy GP. RANKL and OPG activity is regulated by injury size in network of osteocyte-like cells. Bone 2011; 48: 182–188. [DOI] [PubMed] [Google Scholar]
- Ling Y, Rios HF, Myers ER, Lu Y, Feng JQ, Boskey AL. DMP1 depletion decreases bone mineralization in vivo: an FTIR imaging analysis. J Bone Miner Res 2005; 20: 2169–2177. [DOI] [PMC free article] [PubMed] [Google Scholar]
- Huh D, Hamilton GA, Ingber DE. From 3D cell culture to organs-on-chips. Trends Cell Biol 2011; 21: 745–754. [DOI] [PMC free article] [PubMed] [Google Scholar]
Associated Data
This section collects any data citations, data availability statements, or supplementary materials included in this article.
Supplementary Materials
Time lapse video for outgrown cells migrating out from bone chip. Duration: 16 hours.


