Abstract
The mammalian hippocampal formation (HF) provides neuronal representations of environmental location, but the underlying mechanisms are unclear. We report a class of cells with spatially periodic firing patterns composed of plane waves (or bands) drawn from a discrete set of orientations and wavelengths. The majority of cells recorded in parasubicular and medial entorhinal cortices of freely moving rats belonged to this class. Grids cells form an important subset, corresponding to hexagonal configurations of bands, and having the most stable firing. Occasional changes between hexagonal and non-hexagonal firing patterns imply a common mechanism underlying the various spatial patterns. Our results indicate a Fourier-like spatial analysis underlying neuronal representations of location, and suggest that path integration is performed by integrating displacement along a restricted set of directions.
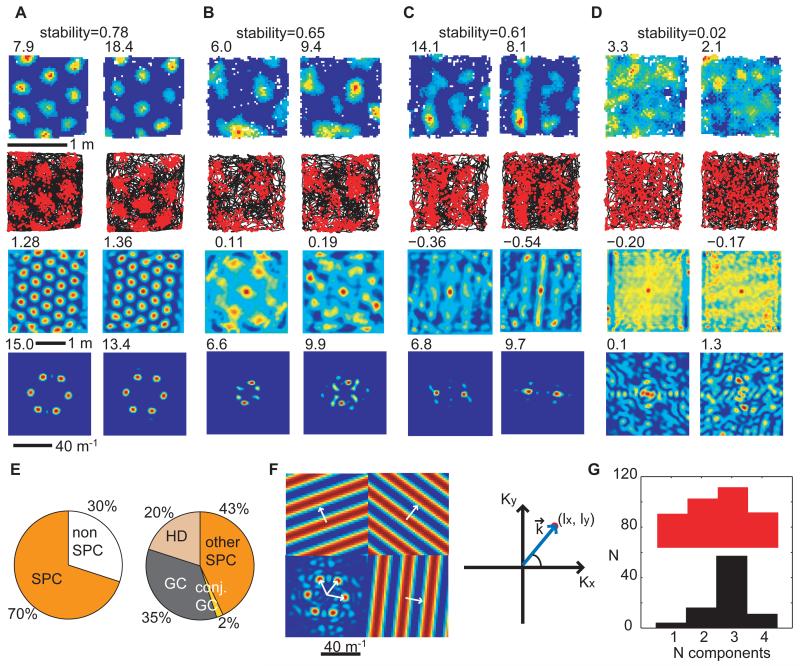
Place cells in the hippocampus represent the animal’s location by firing in discrete environmental locations(1), whereas grid cells are active in multiple locations that form a hexagonally symmetric array covering the entire environment(2), and are found in one of the main inputs to the hippocampus(3, 4), the medial entorhinal cortex (mEC)(2, 5), and also in pre- and parasubiculum (PaS)(5). The spatially periodic firing of grids cells may provide the spatial metric for the hippocampal cognitive map(6, 7), with place cell firing thought to reflect a summation of grid cell inputs(8–11). However, it is unclear how the hexagonal symmetry is generated, whether it represents an entirely unique pattern or one end of a continuum, and whether it is required for spatial representation or reflects other properties such as stability(12) or coding efficiency(13). To examine the spatial periodicity of cells in the parahippocampal region, we recorded 351 cells from superficial layers (II and III) of the medial part of dorsocaudal mEC (5 implants) and adjacent PaS (2 implants) in 7 adult male rats while they foraged for food in a square enclosure (1.3m2; fig. S1). From visual inspection, many of these showed the regular hexagonal pattern characteristic of grid cells (26% passed the standard “gridness” measure(2); Fig. 1A), but a surprisingly large portion of other cells (44%) had stable multi-peaked patterns lacking grid cells’ hexagonal symmetry (Fig. 1B,C).
Fig. 1.
Spatial periodicity of neuronal firing patterns. (A-D) Firing rate maps (top row), trajectory (black) with spike positions (red) (second row), spatial autocorrelograms (third row) and 2D Fourier spectrograms (bottom row) for two successive trials of the same cell in a 1.3×1.3m2 enclosure. (A-C) Spatially periodic cells. The cell in (A) qualifies as a grid cell, the cell in (B) fires in an irregular grid, (C) has a more band-like firing pattern. (D) A non-spatially periodic cell. Peak firing rate, gridness and maximum Fourier power shown (top left of the corresponding plots). Rate map stability between trials is indicated above. (E) Distribution of cell types in dorsal mEC and adjacent PaS. Left: all cells, divided into spatially periodic (SPC) and non-spatially periodic (nonSPC) cells. Right: spatially periodic cells only, divided into grid cells (GC), conjunctive grid cells (conj. GC), SPCs with a head-direction correlate (HD) and other SPCs. (F) Two dimensional Fourier analysis. Left: the centred two dimensional Fourier spectrogram of the rate map shown in (A, left), with significant Fourier components shown at the sides with corresponding wave vectors (white arrows). Right: the spectrogram shows the power corresponding to plane waves (wave vector k) at (lx, ly) from the centre. The periodic bands in the plane wave are oriented perpendicular to the wave vector k and their wavelength is inversely proportional to its length. (G) Distribution of the number of significant Fourier components across spatially periodic cells (non-grid cells in red, grid cells in black).
Two-dimensional Fourier spectral analysis was used to identify cells whose spatial firing patterns showed significant spatial periodicity(14), being predominantly composed of a small number of Fourier components (i.e. periodic spatial bands with different wavelengths and orientations which sum to produce the firing rate map; Fig. 1F). A cell was categorised as spatially periodic if its strongest Fourier component exceeded a significance level of P<0.05 calculated from spatially shuffled data (fig. S3). Overall 70% of cells were spatially periodic (Fig. 1E, all cells in fig. S12). Of these, 37% were grid cells, usually described by three significant Fourier components oriented at multiples of 60° to each other and having similar wavelengths (Fig. 1F-G, figs. S4-S6). The remaining spatially periodic cells were described by a superposition of one to four significant Fourier components with a greater range of orientations and wavelengths (Fig. 1G upper in red, figs. S5-S7). Many cells with one or two significant Fourier components (e.g. Fig. 1C, fig. S7) were reminiscent of the band cells postulated as inputs to grid cells in some computational models(12, 15), see also Refs(11, 16, 17).
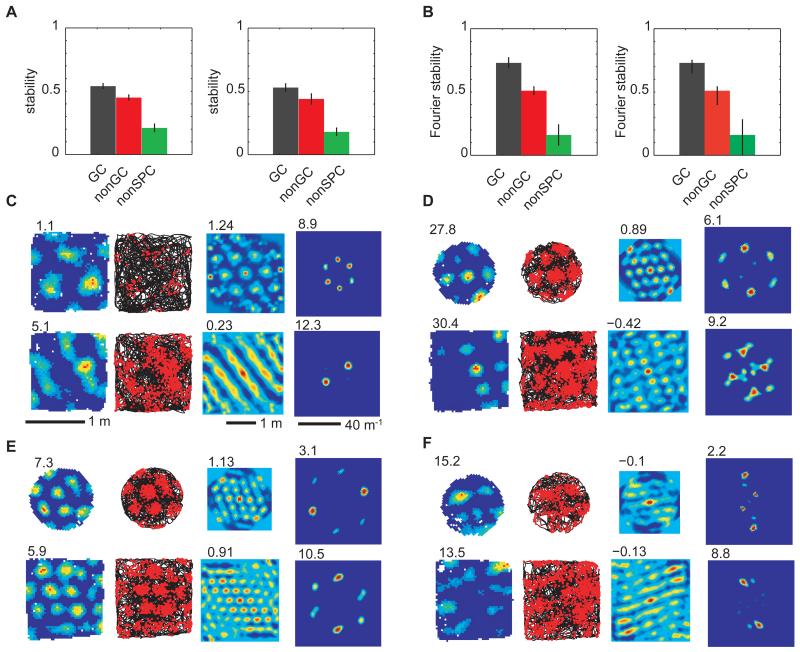
We further examined the properties of the spatially periodic non-grid cells in order to determine whether they could provide a consistent metric for an environment comparable to the grid cells. First, we looked at the stability of their firing patterns in familiar environments, between successive trials on the same day and between trials on different days. Spatially periodic non-grid cells were significantly more stable than chance (r=0.45 within and 0.44 across days). However, grid cells were even more stable than spatially periodic non-grid cells and both were superior to non-spatially periodic cells within the same day and across days (Figs. 1A-D & 2A). The greater spatial stability of grid cells relative to spatially periodic non-grid cells corresponded to a greater stability in the orientations of their Fourier components (Fig. 2B), suggesting a causal relationship between the two.
Figure 2.
Stability of spatially periodic cell firing. (A) Rate maps of grid cells, GC, were more stable than spatially periodic non-grid cells, nonGC, and both were superior to non-spatially periodic cells, nonSPC, both between sessions on the same day in the same environment (left, GC:r=0.54±0.02 (mean ± s.e.m.), nonGC: r=0.45±0.02, nonSPC: r=0.21±0.03, P(GC>nonGC)=0.015, P(GC>nonSPC)=0.65e-012, P(nonGC>nonSPC)=1.69e-010, paired t-tests, one-tailed) and across days (right, GC:r =0.53±0.03, nonGC:r =0.44±0.04, nonSPC: r =0.18±0.03, P(GC>nonGC)=0.049, P(GC>nonSPC)=1.39e-005, P(nonGC>nonSPC)=3.14e-004; paired t-tests, one-tailed). (B) Fourier polar component stability mirrored rate map stability inter-session (left, GC>nonGC: r=0.73±0.04> r= 0.51+0.03, P=3.24e-005, paired t-tests, one-tailed) and inter-day (right: 0.70+0.06 vs. 0.47+0.07, P= 0.015, paired t-tests, one-tailed). Occasionally, cell firing altered between grid and non-grid patterns between trials, (C), in the same environment or (D), in different environments. More often, the structure of grids, (E), and spatially periodical non-grids, (F), was maintained across environments.
A small number of spatially periodic cells (11%) changed their firing patterns between trials in the same environment, changing from grids to non-grids or vice versa (table S1, fig. S8). Figure 2C shows an example of a cell whose firing pattern changed from grid-like to band-like (while a simultaneously recorded grid cell remained a grid cell, see fig. S9 for further details). We ruled out the possibility that such transitions could reflect the unidirectional drift of the grid-like pattern by using a sliding time-window spatial autocorrelation analysis (fig. S10). The fact that spatially periodic cells can change their firing pattern (e.g. between grid-like and band-like) across trials suggests that they are drawn from a continuous population whose differing firing fields reflect different combinations of a small set of elemental periodic band-like inputs.
A significantly larger number of spatially periodic cells (32%) changed their firing patterns between grids and non-grids when animals were moved between different environments (a 1.3m2 square enclosure and a 1m diameter circular enclosure; Fig. 2D, table S1), although the majority did not change category (Figs. 2E-F). When they occur, these transitions between firing patterns correspond to changes in the combination of periodic band-like inputs driving firing. They do not reflect any of the simpler transformations previously reported for grid cells after environmental manipulations (rotations and translations(18), rescaling(19) or expansions(20)). This suggests that the subset of periodic band-like inputs that drives the firing of a given spatially periodic cell can change over time, and that the shape or size of the environment can influence the composition of this subset.
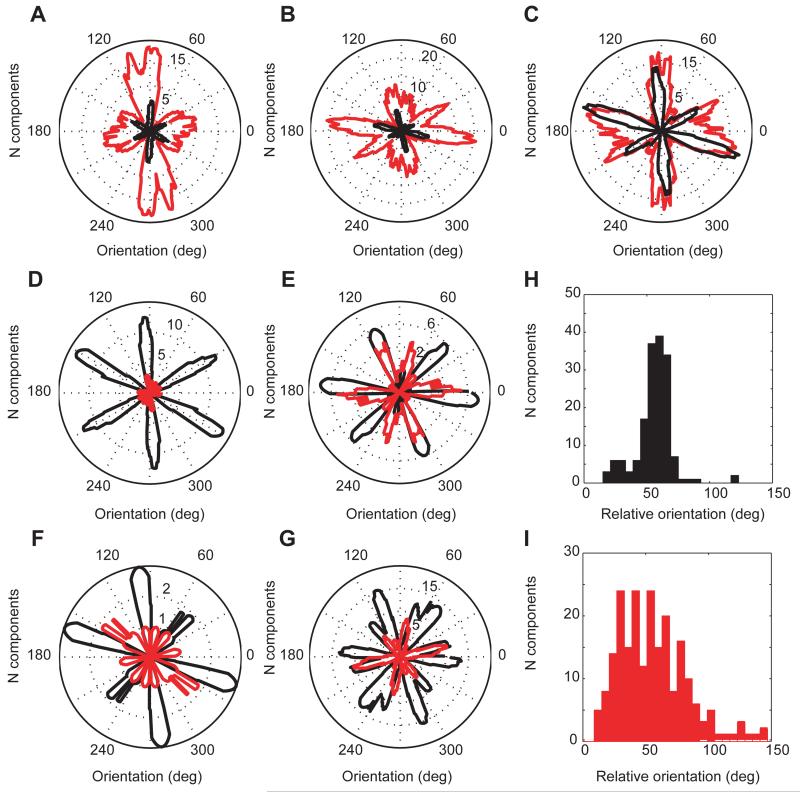
Next we asked whether the population of spatially periodic cells within the same animal are all composed from the same basic set of band-like components. The spatially periodic cells in each animal all tend to have Fourier components clustered around a small number of orientations. As expected, grid cell components were aligned(21) and oriented at 60° to each other (Fig. 3A-G, Rayleigh vector R0=0.58±0.14 for clustering modulo 60°, P<0.01). This clustering in grid cells was corroborated by a clustering of the angular separation of neighbouring components within each cell around 60° (Fig. 3H, Rayleigh vector R0=1.1, P<0.001, N=163). The orientations of components of spatially periodic non-grid cells tended to align with the orientations of components of grid cells (Fig. 3A-G, fig. S5; mean correlation coefficient 0.54±0.08, P<0.01 from shuffled data), but included a wider range of relative orientations (Fig. 3I).
Fig. 3.
Orientations of significant Fourier components within each animal. (A-G) Histograms of the orientations of significant Fourier components of the spatially periodic cells recorded in each animal (in a 1.3×1.3m2 enclosure; non-grid cells in red; grid cells in black). (A-B) cells in PaS; (C-G) cells in mEC (A: r1682; B: r1738; C: r1728; D: r1709; E: r1737; F: r1739; G: r1710). Distribution of the relative orientations of Fourier components of all grid cells, (H), and all spatially periodic non-grid cells, (I).
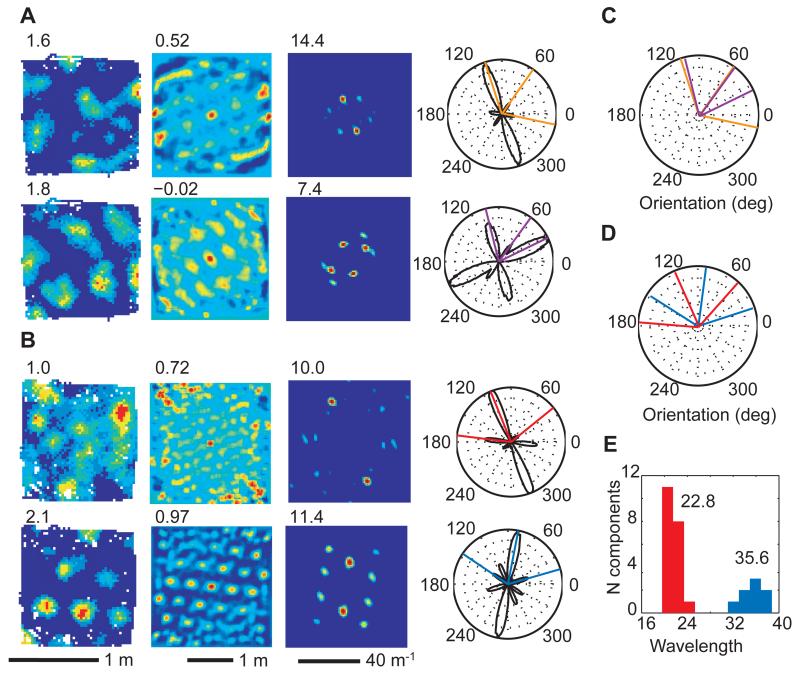
In some cases, grid and non-grid spatially periodic cells differed by a ~30° shift in the orientation of only one of their Fourier components (Fig. 4A,C). Furthermore, two simultaneously recorded subsets of grid cells were observed with orientations rotated by ~30° to each other and different wavelengths (Fig. 4B,D, all cells in fig. S6). The 30° orientation difference may reflect a self-organised selection of band-like inputs, which can lead to stable coexistence of two subpopulations of grids oriented at 30° from each other(12).
Fig. 4.
Different subsets of spatially periodic cells co-exist within the same animal. (A) Simultaneously recorded grid cell (top) and spatially periodic non-grid cell (bottom) with one Fourier component misaligned between the two (r1738). (B) Simultaneously recorded grid cells of different scale and orientation (r1737). Left to right: firing rate map, spatial autocorrelogram, 2D Fourier spectrogram with peak firing rate, gridness score and maximum Fourier power indicated on the top left of the corresponding plots. (C) The orientations of the significant Fourier components in (A) superimposed (colours as in (A)). (D) The mean orientations of the significant Fourier components (Fig. S6) in (B) (colours as in (B)). (E) Wavelength distribution of Fourier components of simultaneously recorded grid cells with the same orientations as the cell in (B), top (red) and the cell in (B), bottom (blue). The mean wavelength for each module is indicated above. Their ratio is ~1.57.
Finally, we asked whether there were differences in the proportions of grid and spatially periodic non-grid cells in both anatomical regions investigated. Although the overall percentage of all spatially periodic cells in mEC was lower (156/239, 65% in mEC; 89/112, 79% in PaS), the proportion of grid cells was much higher in mEC (75/156 or 48%) than in PaS (16/89 or 18%) despite the close anatomical proximity of these regions (fig. S1). This supports the notion that these two regions, with very distinct afferent and efferent connectivity(5, 22, 23), can both generate spatially periodic cells, albeit with major differences in the prevalence of pure 60° symmetry. In both regions, cell firing shows strong theta modulation: 67% of all spatially periodic cells were theta-modulated in PaS (mean frequency 9.2±0.1Hz; 65% of all cells were theta-modulated), and 56% in mEC (with similar mean frequency; 47% of all cells were theta-modulated), pointing to a common characteristic of spatially periodic cells regardless of their anatomical location (fig. S11).
The abrupt increase in the proportion of grid cells as one goes from PaS to the adjacent mEC suggests that mEC has micro-circuitry or anatomical inputs organized to prefer components at 60° angles, which in turn provides the most stable inputs to the hippocampus. In contrast, PaS, with a higher proportion of spatially periodic cells, but more varied and less stable firing patterns, receives its major afferents from the hippocampus and heavily projects to the superficial layers of mEC(22, 24), which may imply that it needs more flexible circuitry to adjust to the hippocampal feedback, or that it represents an intermediate stage in constructing stable grids from periodic bands.
The range of spatially periodic firing patterns reported here could reflect a common process of self-organisation acting on inputs from putative periodic band cells(12, 15). The most stable outcome of such a process will be hexagonal grids(15), while mixtures of orientations organised at multiples of around 30° and 60° can also be stable(12) and may support multi-scale representation(7, 25). What could be the mechanism underlying the putative periodic band-like inputs? The predominantly theta-modulated firing of the spatially periodic cells is reminiscent of the idea that theta rhythmicity controls the scale of spatial representations(26–28) and suggests that interference between theta oscillations integrates self-motion information along specific directions to produce band-like firing patterns which drive grid cell firing(11, 15, 16). These band cells might correspond to phase modulated firing from “theta cells” in the septohippocampal circuit(17) or they could be generated via one dimensional ring attractors(12, 29). In the alternative attractor model(7, 30, 31) recurrent interactions between grid cells produce a grid-like firing pattern across a sheet of cells, which translates into grid-like spatial firing as the animal moves. Interestingly, other “Turing” patterns are also possible in this model, including stripes(30, 32). It is unclear whether our non-grid patterns could be Turing patterns. If they could, our simultaneously recorded grid and non-grid cells could reflect a single large Turing pattern, including grids in some areas and non-grids in other areas. In this model, transitions between grid and non-grid patterns would correspond to a shift of the whole firing pattern across the sheet of cells. However, at first glance, this model would not predict a small set of common orientations for the disparate grid and non-grid parts of the pattern, and could not account for firing patterns changing in some cells but not in other simultaneously recorded cells.
In summary, the firing patterns of the majority of cells recorded in parasubicular and medial entorhinal cortices showed a stable spatial periodicity described by a weighted sum of a small number (up to four) of elemental periodic band-like components. The components within each animal are drawn from a discrete set of orientations and wavelengths. Grid cells correspond to hexagonal configurations of band-like components and form the most stable sub-set of spatially periodic cells. Our results suggest that path integration is performed by integrating displacement along a restricted set of directions, mediated by planar periodic representations (bands) of differing scale along each direction, and that a common mechanism of self-organisation of band-like inputs underlies the formation of all spatially periodic cells in the parahippocampal region.
Supplementary Material
Acknowledgments
Supported by the E.U. Framework 7 (SPACEBRAIN) grant, the U.K. Medical Research Council, the Gatsby Charitable Foundation, and the Wellcome Trust. JK received support from a CoMPLEX studentship. The authors would like to thank M. Bauza, T. Wills, C. Barry, F. Cacucci and M. Witter for useful discussions; S. Burton for help with histology. Work was conducted according to institutional and national ethical guidelines in accordance with the UK Animals (Scientific Procedures) Act, 1986.
References and Notes
- 1.O’Keefe J, Dostrovsky J. The hippocampus as a spatial map. Preliminary evidence from unit activity in the freely-moving rat. Brain Research. 1971;34:171–175. doi: 10.1016/0006-8993(71)90358-1. [DOI] [PubMed] [Google Scholar]
- 2.Hafting T, Fyhn M, Molden S, Moser M-B, Moser EI. Microstructure of a spatial map in the entorhinal cortex. Nature. 2005;436:801–806. doi: 10.1038/nature03721. [DOI] [PubMed] [Google Scholar]
- 3.Witter MP, Van Hoesen GW, Amaral DG. Topographical organization of the entorhinal projection to the dentate gyrus of the monkey. The Journal of Neuroscience. 1989;9:216–228. doi: 10.1523/JNEUROSCI.09-01-00216.1989. [DOI] [PMC free article] [PubMed] [Google Scholar]
- 4.Witter MP, Amaral DG. Entorhinal cortex of the monkey: V. Projections to the dentate gyrus, hippocampus, and subicular complex. The Journal of Comparative Neurology. 1991;307:437–459. doi: 10.1002/cne.903070308. [DOI] [PubMed] [Google Scholar]
- 5.Boccara CN, et al. Grid cells in pre- and parasubiculum. Nat Neurosci. 2010;13:987–994. doi: 10.1038/nn.2602. [DOI] [PubMed] [Google Scholar]
- 6.O’Keefe J, Nadel, Lynn . The Hippocampus as a Cognitive Map. Oxford University Press; 1978. [Google Scholar]
- 7.Fiete IR, Burak Y, Brookings T. What Grid Cells Convey about Rat Location. The Journal of Neuroscience. 2008;28:6858–6871. doi: 10.1523/JNEUROSCI.5684-07.2008. [DOI] [PMC free article] [PubMed] [Google Scholar]
- 8.Burgess N, Barry C, Jeffery KJ, O’Keefe J. A Grid & Place Cell Model of Path Integration Utilizing Phase Precession Versus Theta. 2005.
- 9.Solstad T, Moser EI, Einevoll GT. From grid cells to place cells: A mathematical model. Hippocampus. 2006;16:1026–1031. doi: 10.1002/hipo.20244. [DOI] [PubMed] [Google Scholar]
- 10.Cash S, Yuste R. Linear Summation of Excitatory Inputs by CA1 Pyramidal Neurons. Neuron. 1999;22:383–394. doi: 10.1016/s0896-6273(00)81098-3. [DOI] [PubMed] [Google Scholar]
- 11.Burgess N. Grid cells and theta as oscillatory interference: Theory and predictions. Hippocampus. 2008;18:1157–1174. doi: 10.1002/hipo.20518. [DOI] [PMC free article] [PubMed] [Google Scholar]
- 12.Mhatre H, Gorchetchnikov A, Grossberg S. Grid cell hexagonal patterns formed by fast self - organized learning within entorhinal cortex. Hippocampus. 2012;22:320–334. doi: 10.1002/hipo.20901. [DOI] [PubMed] [Google Scholar]
- 13.Sreenivasan S, Fiete I. Grid cells generate an analog error-correcting code for singularly precise neural computation. Nat Neurosci. 2011;14:1330–1337. doi: 10.1038/nn.2901. [DOI] [PubMed] [Google Scholar]
- 14.Materials and methods are available as supporting material on Science Online.
- 15.Burgess N, Barry C, O’Keefe J. An oscillatory interference model of grid cell firing. Hippocampus. 2007;17:801–812. doi: 10.1002/hipo.20327. [DOI] [PMC free article] [PubMed] [Google Scholar]
- 16.Hasselmo ME. Grid cell mechanisms and function: Contributions of entorhinal persistent spiking and phase resetting. Hippocampus. 2008;18:1213–1229. doi: 10.1002/hipo.20512. [DOI] [PMC free article] [PubMed] [Google Scholar]
- 17.Welday AC, Shlifer IG, Bloom ML, Zhang K, Blair HT. Cosine Directional Tuning of Theta Cell Burst Frequencies: Evidence for Spatial Coding by Oscillatory Interference. The Journal of Neuroscience. 2011;31:16157–16176. doi: 10.1523/JNEUROSCI.0712-11.2011. [DOI] [PMC free article] [PubMed] [Google Scholar]
- 18.Fyhn M, Hafting T, Treves A, Moser M-B, Moser EI. Hippocampal remapping and grid realignment in entorhinal cortex. Nature. 2007;446:190–194. doi: 10.1038/nature05601. [DOI] [PubMed] [Google Scholar]
- 19.Barry C, Hayman R, Burgess N, Jeffery KJ. Experience-dependent rescaling of entorhinal grids. Nat Neurosci. 2007;10:682–684. doi: 10.1038/nn1905. [DOI] [PubMed] [Google Scholar]
- 20.Barry C, O’Keefe J, Burgess N. Effect of novelty on grid cell firing. SfN abstract. 2009 [Google Scholar]
- 21.Doeller CF, Barry C, Burgess N. Evidence for grid cells in a human memory network. Nature. 2010;463:657–661. doi: 10.1038/nature08704. [DOI] [PMC free article] [PubMed] [Google Scholar]
- 22.van Groen T, Wyss JM. The connections of presubiculum and parasubiculum in the rat. Brain Research. 1990;518:227–243. doi: 10.1016/0006-8993(90)90976-i. [DOI] [PubMed] [Google Scholar]
- 23.Burgalossi A, et al. Microcircuits of functionally identified neurons in the rat medial entorhinal cortex. Neuron. 2011;70:773–786. doi: 10.1016/j.neuron.2011.04.003. [DOI] [PubMed] [Google Scholar]
- 24.Köhler C. Intrinsic projections of the retrohippocampal region in the rat brain. I. The subicular complex. The Journal of Comparative Neurology. 1985;236:504–522. doi: 10.1002/cne.902360407. [DOI] [PubMed] [Google Scholar]
- 25.Blair HT, Welday AC, Zhang K. Scale-Invariant Memory Representations Emerge from Moiré Interference between Grid Fields That Produce Theta Oscillations: A Computational Model. The Journal of Neuroscience. 2007;27:3211–3229. doi: 10.1523/JNEUROSCI.4724-06.2007. [DOI] [PMC free article] [PubMed] [Google Scholar]
- 26.Maurer AP, VanRhoads SR, Sutherland GR, Lipa P, McNaughton BL. Self - motion and the origin of differential spatial scaling along the septo - temporal axis of the hippocampus. Hippocampus. 2005;15:841–852. doi: 10.1002/hipo.20114. [DOI] [PubMed] [Google Scholar]
- 27.Geisler C, Robbe D, Zugaro M, Sirota A, Buzsáki G. Hippocampal Place Cell Assemblies Are Speed-Controlled Oscillators. PNAS. 2007;104:8149–8154. doi: 10.1073/pnas.0610121104. [DOI] [PMC free article] [PubMed] [Google Scholar]
- 28.O’Keefe J, Recce ML. Phase relationship between hippocampal place units and the EEG theta rhythm. Hippocampus. 1993;3:317–330. doi: 10.1002/hipo.450030307. [DOI] [PubMed] [Google Scholar]
- 29.Blair HT, Gupta K, Zhang K. Conversion of a phase - to a rate - coded position signal by a three - stage model of theta cells, grid cells, and place cells. Hippocampus. 2008;18:1239–1255. doi: 10.1002/hipo.20509. [DOI] [PMC free article] [PubMed] [Google Scholar]
- 30.McNaughton BL, Battaglia FP, Jensen O, Moser EI, Moser M-B. Path integration and the neural basis of the “cognitive map”. Nat Rev Neurosci. 2006;7:663–678. doi: 10.1038/nrn1932. [DOI] [PubMed] [Google Scholar]
- 31.Fuhs MC, Touretzky DS. A Spin Glass Model of Path Integration in Rat Medial Entorhinal Cortex. The Journal of Neuroscience. 2006;26:4266–4276. doi: 10.1523/JNEUROSCI.4353-05.2006. [DOI] [PMC free article] [PubMed] [Google Scholar]
- 32.Borckmans P, et al. Diffusive instabilities and chemical reactions. Int. J. of Bifurcat. Chaos. 2002;12:2307–2332. [Google Scholar]
Associated Data
This section collects any data citations, data availability statements, or supplementary materials included in this article.


