Abstract
Grid cells represent an animal’s location by firing in multiple fields arranged in a striking hexagonal array1. Such a profound and constant regularity prompted suggestions that grid cells represent a universal and environment-invariant metric for navigation1,2. Originally the properties of grid-patterns were believed to be independent of the shape of the environment and this notion has dominated all mainstream theoretical grid cell models3–6. Nonetheless several studies indicate that environmental boundaries influence grid-firing7–10 though the strength, nature and longevity of this effect is unclear. Here, we show that grid orientation, scale, symmetry and homogeneity are strongly and permanently affected by environmental geometry. We found that grid-patterns orient to the walls of polarised enclosures such as squares but not circles. Furthermore, the hexagonal grid symmetry is permanently broken in highly polarised environments such as trapezoids, the pattern being more elliptical and less homogeneous. Our results provide compelling evidence for the idea that environmental boundaries compete with the internal organisation of the grid cell system to drive grid firing. Importantly, grid cell activity is more local than previously thought and as a consequence cannot provide a universal spatial metric in all environments.
Navigation is performed on the basis of information about self-motion and external cues, including enclosure geometry, the latter dominating non-geometric information such as visual landmarks, textures and smells11–13. In mammals the hippocampal formation is required for spatial navigation14 and its neurons encode the animal’s position (place cells15 and grid cells1), head direction (head direction cells16) and proximity to boundaries (boundary cells17,18). The spatial activity of boundary and place cells is known to be affected by environmental geometry17–19. Grid cells may also be influenced by changes to boundaries, in particular reflecting distortions of a familiar enclosure by rescaling in the same direction7. These changes ameliorate with time and cells tend to return towards their canonical patterns, reinforcing the idea that internal processes at the individual cell or network level predominantly determine the grid-pattern2. Here we demonstrate that environmental geometry exerts an important and permanent influence on grid-cell firing. Under certain circumstances, it can overcome internal network processes and lead to profound distortions of the grid-pattern.
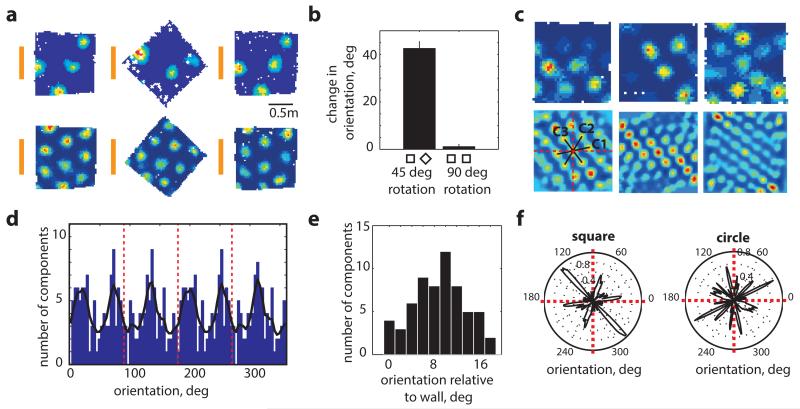
In geometrically symmetrical enclosures such as circles, distal cues control the orientation of grid-patterns which follow cue rotation1. In contrast we found that in geometrically polarised enclosures, such as squares, greater control is exercised by the arena. 45° rotation of the arena commensurately rotates the grid pattern despite prominent distal cues remaining stationary (Fig. 1a–b, mean grid rotation ±42.5°±2.9°, n=5 rats/modules, 19 grid cells, not different from 45°, p=0.44, t=−0.85, n=5, df=4, one-sample t-test). Importantly, no changes were observed for 90° rotations for which geometry remains unchanged but local cues such as smells and textures move (mean grid orientation 1.1°±0.9° not different from 0°, p=0.29, t=1.21, n=5, df=4, one-sample t-test).
Figure 1. Grid-orientation aligns to walls in squares.
a-b, 45 °rotation of a square (middle) rotates the grid pattern by the same amount (2 typical grid-cells from 2 rats, distal cue card in orange, p=0.44, t=−0.85, n=5, df=4, one-sample t-test). c, 3 typical grid-cell rate maps (top) and their spatial autocorrelograms (bottom) (3 rats). Orientations of the three main grid components in black, vertical and horizontal walls in red. d, Distribution of grid-orientations for 62 grid modules (41 rats) in squares, (e) is clustered at 8.8°±0.6° (mean+s.e.m.) from the vertical or horizontal walls (p=0.015, Z=4.2, Rayleigh test), and (f) significantly more clustered in square (12 modules) than circle (11 modules) in the same 7 rats (p=0.025, t=2.4, df=21; two-sample t-test).
We explored which aspects of the grid-pattern were affected by environmental geometry, beginning with the influence of the enclosure walls over grid-orientation. 275 grid cells (62 modules, 41 rats) were recorded while animals foraged in square enclosures (Fig. 1c and Extended Data Figs. 1-2). Across rats, the orientation of the grids aligned at a mean angle of 8.8°±0.6° to the enclosure walls (Fig. 1d&e; p=0.015, Z=4.2, Rayleigh test for non-uniformity; p=0.04 vs. shuffled data, see SI and Extended Data Fig. 3). In unpolarised circular environments grid-orientations were less clustered than in the square (Fig. 1f; p=0.025, t=2.4, df=21; two-sample t-test). Importantly, clustering did not arise from behavioural biases: the distribution of velocities and directional headings were not different between squares and circles (p=0.34, t=0.98, df=21 for headings; p=0.89, t=0.15, df=21 for velocity; two-sample t-test; Extended Data Fig. 4) suggesting that grid-patterns align to the walls in polarised enclosures due to the direct influence of environmental geometry and not through changes in behaviour.
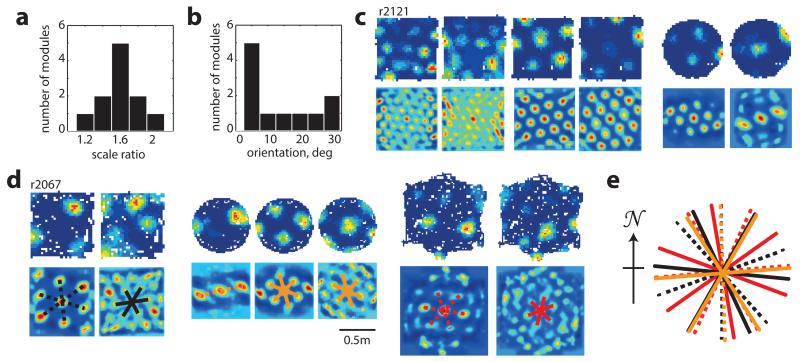
This tendency of grid-patterns to orient relative to walls should affect the relative orientations of different grid modules (grid cells cluster into modules differing in orientation and scale)7,10. Namely, alignment at ~8.8° to vertical or horizontal walls in a square is compatible only with relative orientations of ~0° or ~30° between modules. Examining data from simultaneously recorded grid modules in the square enclosure (11 pairs, 11 rats, mean scale ratio7,8,10 between modules 1.56 or ~ π/2, Fig. 2a) we found that relative orientations were significantly clustered around 0° and 30° albeit with a few intermediate values (Fig. 2b left; p=0.02; Binomial test). To what extent was the observed clustering across modules a product of the square environment? Previous reports indicate that grid-patterns from different modules can rotate independently10. This suggests that in a circle modules will assume relative orientations unrelated to those in a square. Conversely, in a hexagon they should align even if they were aligned to different (vertical or horizontal) walls in a square (Extended Data Fig. 5). Surprisingly, neither was the case: the relative orientation of simultaneously recorded modules was preserved across all three different environmental geometries (square, circle and hexagon; Fig. 2c-d; Extended Data Fig. 5; mean difference in relative orientation across all testing conditions 3.6°±2.5°; in 3 rats, 6 modules, 18 cells; p<0.001; Binomial test; SI Table 1). Relative alignment by other sensory cues was excluded (enclosures were located in different rooms and animals were disoriented before entering each room) as were non-spatial factors such as the Earth’s magnetic field (Fig. 2e). This demonstrates that grid modules located anatomically close together in dorsal mEC can act coherently.
Figure 2. Relationship between different grid-modules across geometrically different enclosures.
a, Ratio between scales of simultaneously recorded grid-modules, mean scale ratio 1.56, n=11 rats.b, Relative orientations of simultaneously recorded grid-modules peaks at 0° and 30° but includes intermediates (p=0.02; Binomial test). c-d, Simultaneously recorded grid-cells from two different modules maintained their relative orientation in squares, circles and a hexagon.e, Preserved relative orientations were not due to Earth’s magnetic field. Colours as in the lower part of (d). Dashed lines, larger grid-modules; solid, smaller scale.
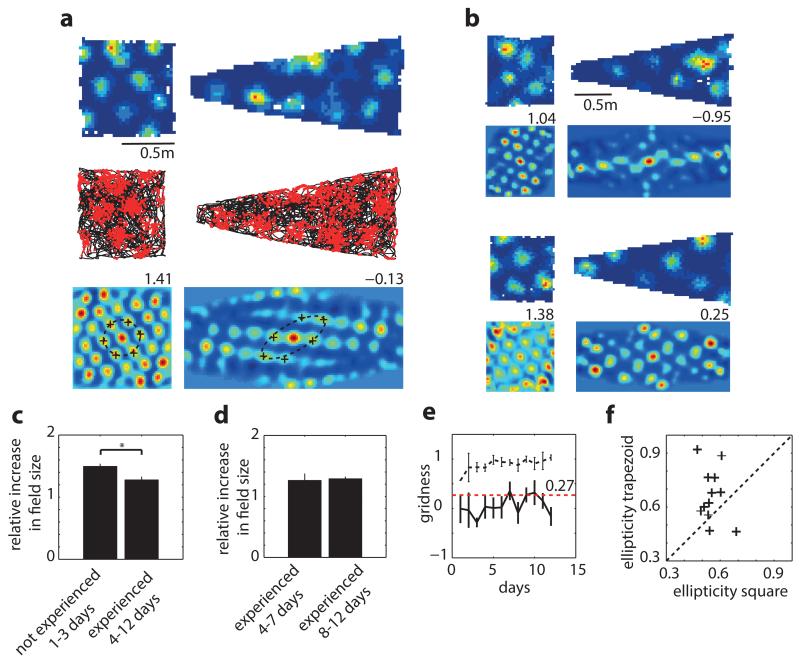
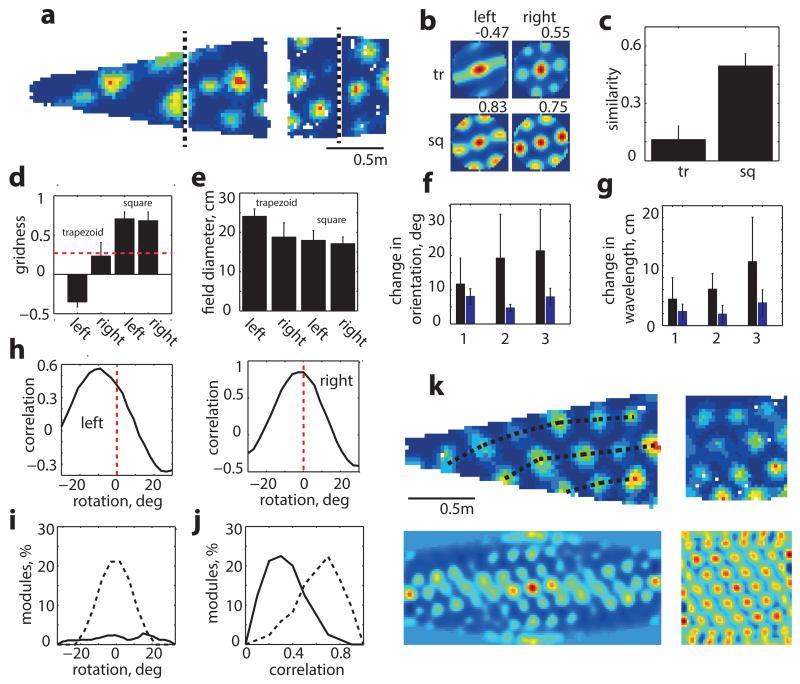
Does environmental geometry only affect grid orientation or are other properties such as symmetry, scale and homogeneity impacted? To address this question we recorded the same grid cells in a square and trapezoid, an environment with highly polarised geometry (38 grid cells, 8 rats, 12 modules, Fig. 3a-b). As previously reported20 grid-patterns expanded during initial exposure to the novel trapezoid enclosure (Fig. 3c). To eliminate novelty effects our analyses were limited to data recorded after patterns had stabilised (>4 days experience; Fig. 3c-d). Interestingly, in the trapezoid even after four days (>2.6 hours of exposure) stable firing fields were 20-30% larger than in the concurrently recorded and equally familiar square (ratio of field diameter in the trapezoid to the square was 1.29, p=1.65*10−6, t=14.7, df=7; one-sample t-test). Grid-patterns also exhibited a permanent decrease in hexagonality (measured by gridness score; Fig. 3e) which resulted from 2 factors: the pattern was more elliptical across the entire trapezoid (Fig. 3f; mean±s.e.m. grid eccentricity: 0.67±0.04 (trapezoid) vs. 0.55±0.02 (square), p=0.02, t=−2.5, df=22, two-sample t-test); and it was less evenly distributed. To assess the latter we divided the trapezoid and square into two equal parts (Fig. 4a; area of half-trapezoid 0.51m2, half-square 0.41 m2) and compared firing on either side. Fig. 4b-c shows that the local spatial structure (defined by the spatial autocorrelogram) differs more strongly between the two sides of the trapezoid than between the sides of the square (r=0.11±0.07 vs. 0.50±0.06, trapezoid and square respectively, p<0.001, t=−4.0, df=18, two-sample t-test, 10 grid modules, 32 grid cells). Moreover, gridness was lower in the left of the trapezoid than the right (Fig. 4d, −0.35±0.07 and 0.23±0.17 respectively, p=0.006, t=−3.11, df=18, two-sample t-test) but not in the square (0.71±0.09 and 0.68±0.11, p=0.87, t=0.17, df=18, two-sample t-test). Importantly, gridness was lower on the right of the trapezoid compared to both parts of the square even though they are of comparable shape and area (p=0.009; F2.1,2=6.18; two-way ANOVA), suggesting an influence from the left side of the trapezoid. Additionally, the diameters of the individual fields were larger on the left of the trapezoid than the right (Fig. 4e, p<0.001, t=4.1, df=18, two-sample t-test) but not in the square (p=0.39, t=0.88, df=18, two-sample t-test). Interestingly, the field sizes on the right of the trapezoid were not different from those on either side of the square (p=0.15; F60.3,2=2.07; two-way ANOVA).
Figure 3. Grid pattern is distorted in trapezoids.
a, Grid-cell rate maps (top), trajectory (black) with spike positions (red, middle), and spatial autocorrelograms (bottom) for two successive trials in square and trapezoid. Gridness on top right of autocorrelogram. Dashed-line, ellipse best approximating grid cell symmetry; ‘+’, main grid components. b, Two more examples as in (a) from two other rats. c, Mean ratio between field size in trapezoid and square. Grid-fields larger on days 1-3 than 4-12 (1.49±0.04 vs. 1.28±0.05 p=0.029, t=2.54, df=10; two-sample t-test) but (d) not significantly different between days 4-7 and 8-12 (p=0.79, t=−0.27, df=7, two-sample t-test). e, Gridness across days in trapezoid (solid-line) and square (dashed-line); red-line, gridness threshold of 0.279. f, Grid-cells are more elliptical in trapezoid than square: mean±s.e.m.: 0.67±0.04 (trapezoid) vs. 0.55±0.02 (square), p=0.02, t=−2.5, df=22, two-sample t-test.
Figure 4. Grid pattern is inhomogeneous in trapezoids.
a, Grid-cell rate maps for the same cell in trapezoid and square. Dashed-line divides enclosures into equal areas.b, Autocorrelograms for each side of trapezoid (tr) and square (sq) are significantly more similar in squarethantrapezoid (c). d, Gridness on two sides of trapezoid and square. Dashed-line represents gridness threshold9. e, Field diameter is larger on left than right of trapezoid (p<0.001, t=4.1, df=18, two-sample t-test) but not different in square (p=0.39, t=0.88, df=18, two-sample t-test). Change in orientations (f) and wavelengths (g) of left/right parts of trapezoid (black) and square (blue). h, Rotation of right part of autocorrelogram relative to left optimizes correlation in trapezoid but not square but (j) still leaves a lower similarity (p=0.0002, t=−4.6, df=18, two-sample t-test, 32 grid cells, 8 rats, 10 different grid modules). i, Average grid rotation between two sides of trapezoid (solid line) and square (dashed line). k, Another example of right-to-left grid expansion and rotation in trapezoid.
We also examined how the orientations and wavelengths of the three grid components computed from the spatial autocorrelogram differed between sides of the two environments (Fig. 4f-g). The orientation of the first component (closest to the horizontal axis; Extended Data Fig. 6) was no more variable between the sides of the trapezoid than the sides of the square (mean orientation change: 11.6°±2.5° and 8.0°±0.8°, trapezoid and square respectively, p=0.19, t=−1.36, df=16, two-sample t-test). However the other two components differed more in the trapezoid than in the square (2nd: 19.2°±4.9° and 4.7°±0.3° p=0.004, t=−3.41, df=14; 3rd: 21.4°±4.6° and 7.9°±0.8°, p=0.005, t=−3.3, df=14, two-sample t-test). Similarly, the 1st wavelength was no more variable in the trapezoid than the square (mean wavelength change: 4.4±1.2 vs. 2.3±0.4 cm, trapezoid and square respectively, p=0.12, t=−1.6, df=16, two-sample t-test) while the differences for the 2nd (6.1±1.0 vs. 1.9±0.5 cm, p=0.001, t=−4.1, df=14) and 3rd wavelengths (10.1±2.8 cm vs. 3.8±0.7 cm, p=0.02, t=−2.7, df=14) were more pronounced in the trapezoid. These localised changes in grid components manifest as a rotation and stretching of the grid-pattern across the trapezoid (Fig. 4h-k). Indeed the spatial correlation between the two halves of the trapezoid at the optimal rotation angle (i.e. the one maximising the correlation between left and right sides) was still lower compared to the square (Fig. 4h&j; r= 0.30±0.05 trapezoid and 0.63±0.05 square, p=0.0002, t=−4.6, df=18, two-sample t-test), indicating rescaling as well as rotation (Fig. 4k).
To eliminate the possibility that these observations arose from under-sampling of the grid-pattern in the trapezoid we generated idealised grid-firing (scale and orientation matched to the data) for a square and trapezoid environment (Extended Data Fig. 7). This control data exhibited neither an increase in ellipticity nor in inhomogeneity. Furthermore, although the animals’ behaviour was polarised between the two halves of the trapezoid (Extended Data Fig. 4) there was no correlation between the extent of polarization and differences in grid properties between the sides, ruling out a behavioural explanation. Indeed it is known that stereotypical behaviour in the open field does not significantly degrade the hexagonal grid structure21.
Our results show that most assumptions about the invariant nature of grid-cell firing are invalid. In particular the role of environmental boundaries has been underestimated. Our findings reveal that grid-patterns are permanently shaped by environmental geometry as well as by internal network processes (Extended Data Figs. 8-9). Importantly, we have shown that grid-patterns can be inhomogeneous even within a continuous two-dimensional space, due to the influence of non-parallel boundaries (likely signalled by boundary cells). A differential influence from the boundaries probably also accounts for the ellipticity of different grid modules10 as well as the non-hexagonal symmetry of spatially periodic non-grid cells8. The results challenge the idea that the grid cell system can act as a universal spatial metric for the cognitive map since grid-patterns change markedly between enclosures and even within the same enclosure. An intriguing alternative is that grid cells provide a spatial metric but that the asymmetries induced by highly polarised environments such as trapezoids produce distortions in the perception of space.
Methods
41 adult male Lister Hooded rats were chronically implanted in the left or/and right hemisphere with a microdrive (Axona Ltd) loaded with four tetrodes. Tetrodes were aimed at the most dorsal parts of the medial entorhinal cortex (mEC, 39 rats) and adjacent parasubiculum (PaS, 2 rats) (4.3-4.5 mm lateral to the midline; 0.2-0.5 mm anterior to the sinus; angled forwards in the sagittal plane at 0°-10° and 1.5 mm below the pia). Tetrodes were lowered 50 microns or less per day at the end of each recording session until the first cells of interest were found. Neural activity was recorded while the animals foraged in square, trapezoidal, circular or/and hexagonal enclosures. A complete description of the materials and methods is provided in Supplementary Information.
Extended Data
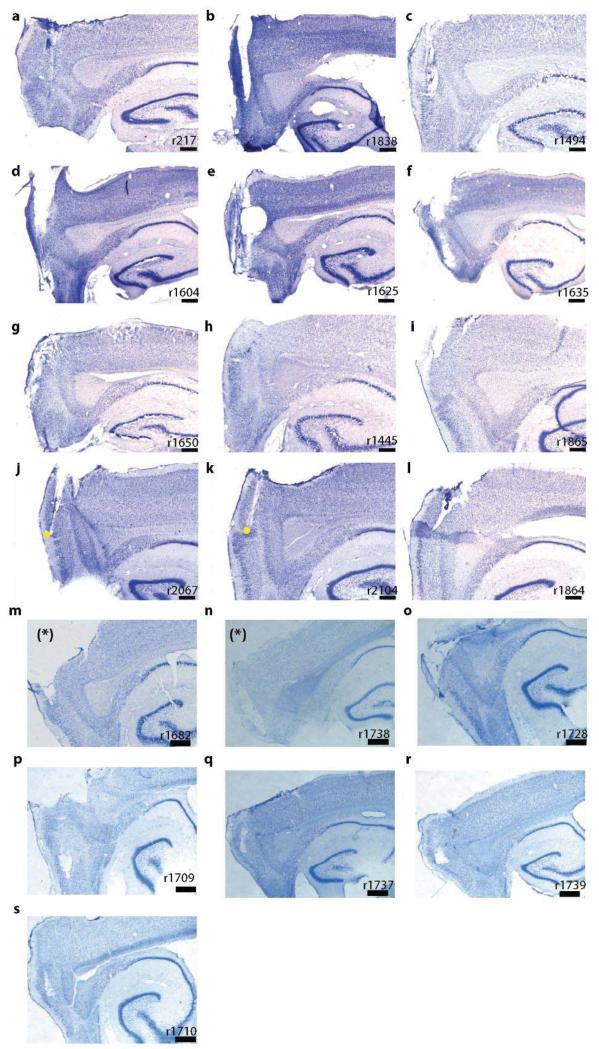
Extended Data Figure1.
Sagittal Nissl-stained brain sections showing the recording locations in superficial layers II-III of mEC and PaS (marked with *). Yellow dots indicate the dorsalventral region where grid cells were recorded in the trapezoids. Scale bar indicates 500μm.
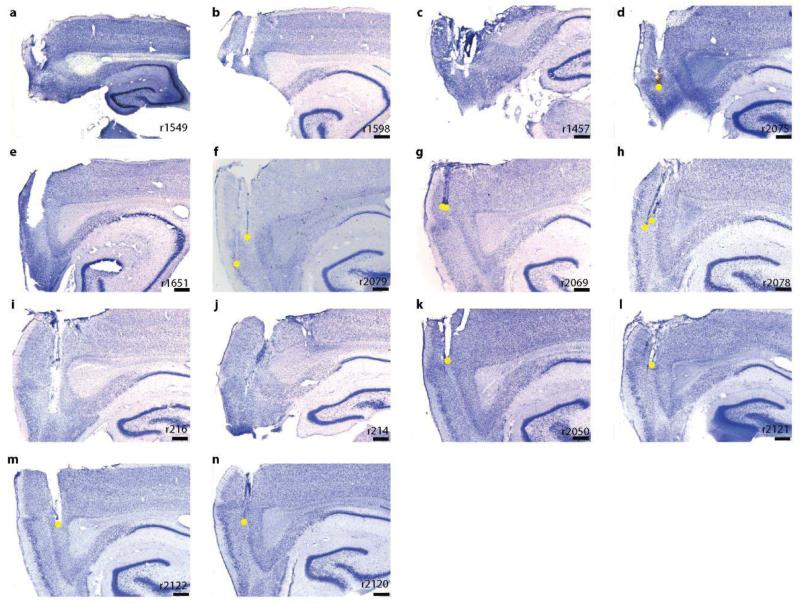
Extended Data Figure2.
Sagittal Nissl-stained brain sections showing the recording locations in superficial II-III and deep V-VI layers of mEC. Yellow dots indicate the dorsal-ventral region where grid cells were recorded in the trapezoids. Scale bar indicates 500μm.
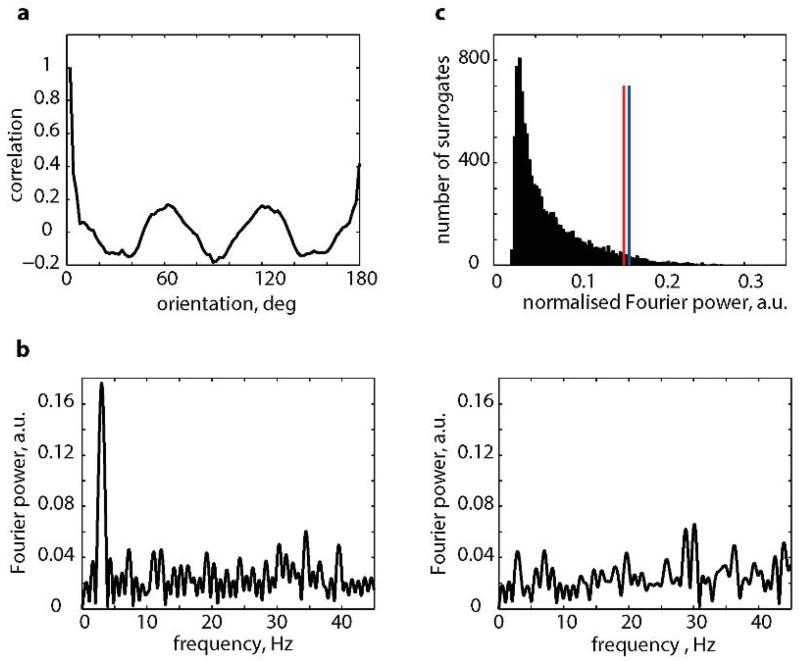
Extended Data Figure3. Orientation clustering.
a, The autocorrelogram of the distribution of grid orientations in squares (shown in Fig. 1b). b, The Fourier spectrogram of autocorrelogram in (a), left, and a typical example of the Fourier spectrogram of the autocorrelogram of shuffled orientations, right. Note the absence of a low-frequency peak in the latter. c, The distribution of maximum normalized Fourier power of 10,000 data surrogates (as shown in (b) right). Red line indicates 95 percentile of the shuffled data. Blue line indicates the maximum normalized Fourier power of our data.
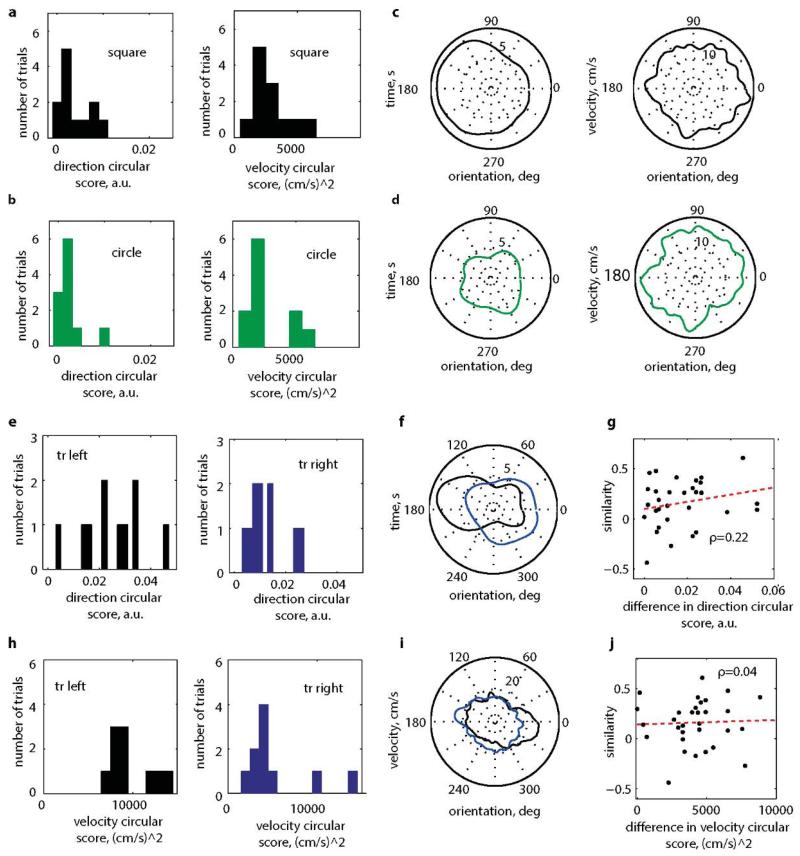
Extended Data Figure4. Directional and velocity sampling in square and circular enclosures.
Mean directional (left) and velocity (right) sampling in square (a) and circular (b) enclosures. Typical examples of directional (left) and velocity (right) sampling profiles in square (c) and circle (d). e, The directional sampling in the left (left, black) and right (right, blue) parts of the trapezoid. The directional sampling in the left part of the trapezoid was significantly more biased than in the right (p=0.01; two-sample t-test; means±s.e.m. = 0.025±0.004 (left) and 0.012±0.002 (right). f, The velocity sampling bias was also significantly larger in the left part of the trapezoid (left, black) than the right (right, blue) (p=0.006; two-sample t-test; mean velocity sampling±s.e.m. = 9803±791 (cm/s)2 (left) and 5413±1176 (cm/s)2 in the left and (right). A typical example of the velocity sampling (g) and directional sampling (h) on the 2 sides of the trapezoid; rat 2104. The left side direction circular score is 0.035 (black), the right, 0.009 (blue). The left side velocity circular score is 8268 (cm/s)2 (black) and the right, 3904 (cm/s)2 (blue). Absence of a significant correlation ρ between the similarities of the left and right sides of the trapezoid and the difference in directional (i), p=0.22 or velocity (j) scores, p=0.82.
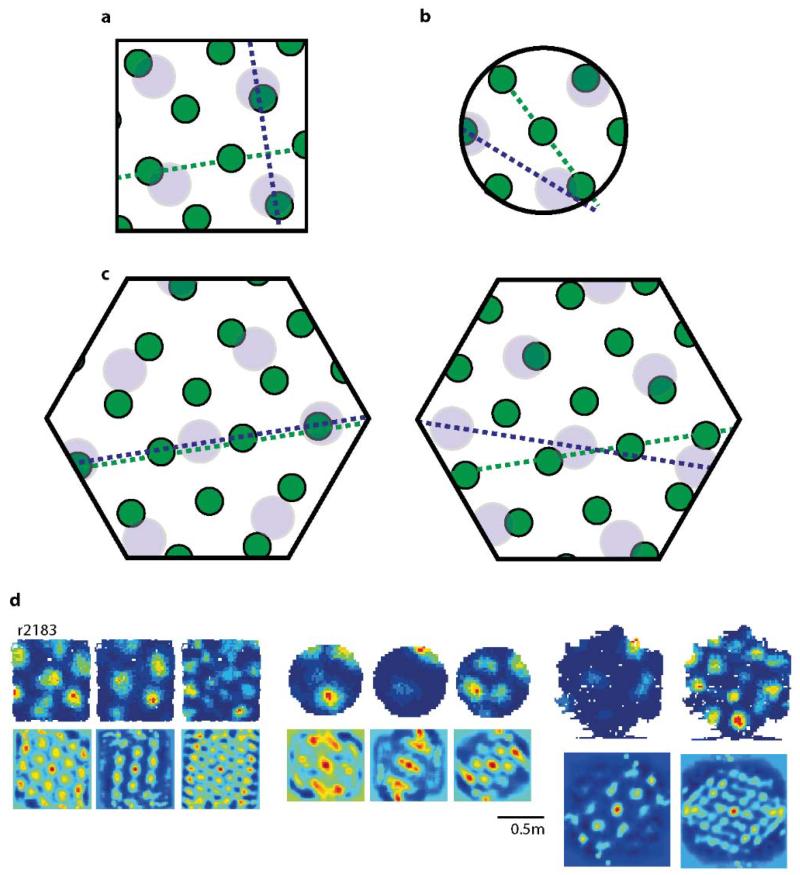
Extended Data Figure5. Schematic representation of grid re-alignment in different shape enclosures.
a, The relative orientation of two representative grid modules in a square: the grid cell with the smaller scale (green) is aligned ~9° from the horizontal wall and the grid cell with the larger scale (blue) is aligned ~9° from the vertical wall with the relative orientation between them equal to 30°. b, If grid cells respond independently and if the geometry of the environment determines their orientation in non-polarised environments such as a circular enclosure, grid cells in (a) should randomly realign (in the current example by ~15°). c, Similarly, in the hexagonal enclosure both grid cells should start to align (left) or become ~18° offset from each other (right). This was not observed in our experimental data. c, Simultaneously recorded grid cells from two different modules (rat r2183) in a square (left), a circle (middle) and a hexagon (right) maintained their relative orientation. Rate maps are shown on the top row and spatial auto-correlograms on the bottom.
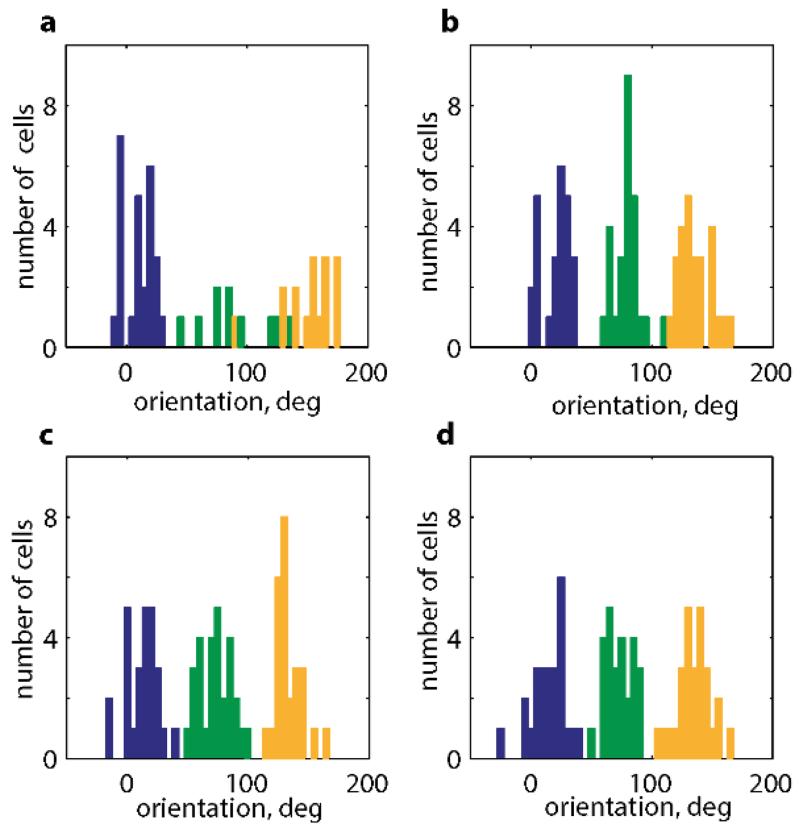
Extended Data Figure6. Distribution of grid components on the left and right sides of trapezoidal and square enclosures.
The distribution of the individual grid cell components on the left (a) and right (b) sides of the trapezoid and square (left(c) and right (d)). Components 1, 2 and 3 are shown in blue, green and orange respectively. Data from 8 rats, 10 grid modules, 26 grid cells. Note the similarity of all 4 blue components and of the green and orange components on both sides of the square and on the right side of the trapezoid.
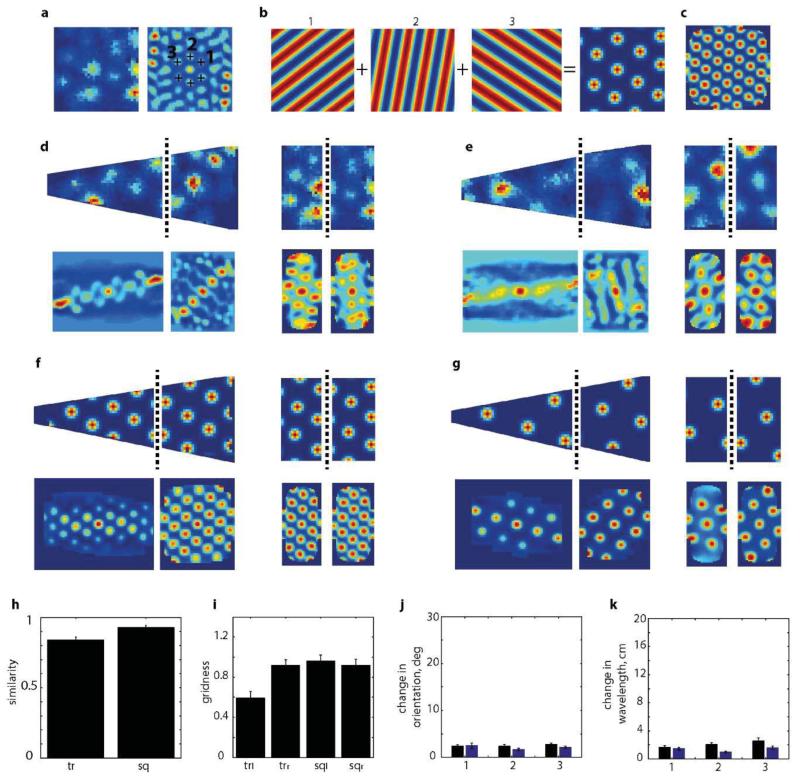
Extended Data Figure7. Simulated grid cells.
a, Grid cells were simulated using the orientations and wavelengths of the three main grid components (1, 2, 3) taken from the spatial autocorrelogram (a, right) of a real grid cell (a, left) as shown in this typical example. b, Simulated grid pattern was generated by summing three grid components to retrieve the rate map and spatial autocorrelogram (c) which well approximated the real data shown in (a). f-g, examples of the procedure applied to the two cells in (d) and (e) respectively. Grid cells were generated from the autocorrelogram in the square. h, Correlation coefficient between right and left side of the simulated grid data in trapezoid (left) and square (right). i, Grid scores of simulated grids on left and right side of trapezoids and squares. The lower grid score in the left side of the trapezoid is due to under-sampling. Change in orientation (j) and wavelength (k) of 3 components of simulated grids in trapezoid (black bars) and square (blue bars).
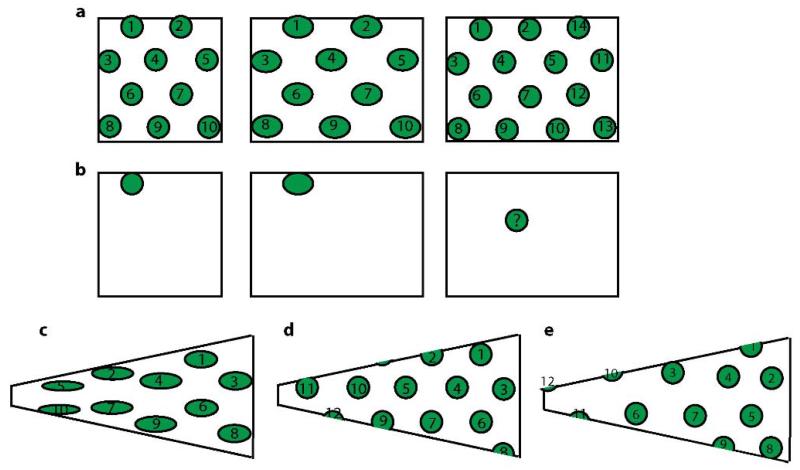
Extended Data Figure8. Temporary Rescaling vs. a permanent change in grid symmetry.
a, Expected rescaling of a grid cell (left) in a rectangle (middle). The number of grid fields stay the same (n=10 fields) but the fields become more elliptical and farther apart along the x direction. After a few days of experience the fields converge to their initial size and shape, and the number of grid fields increases (right). The grid symmetry on the left and right belong to the same 6-fold symmetry group (i.e. hexagonal symmetry). b, Place cell response to rescaling of the environment. The place field initially becomes more elliptical (middle) and finally remaps to a random location (or stops firing altogether) as the animal becomes more experienced. c, Expected change in grid symmetry as the animal goes from square (a, left) to trapezoid if the change in pattern occurred due to the rescaling of the environment. Note that the number of fields remains unchanged.d, As the environment becomes more familiar the grid cell pattern should converge to hexagonal symmetry and the number of fields would increase. In general we did not observe this in our data. e, Instead, grid symmetry became more elliptical (not grid fields) and the scale increased towards the narrow side of the trapezoid.
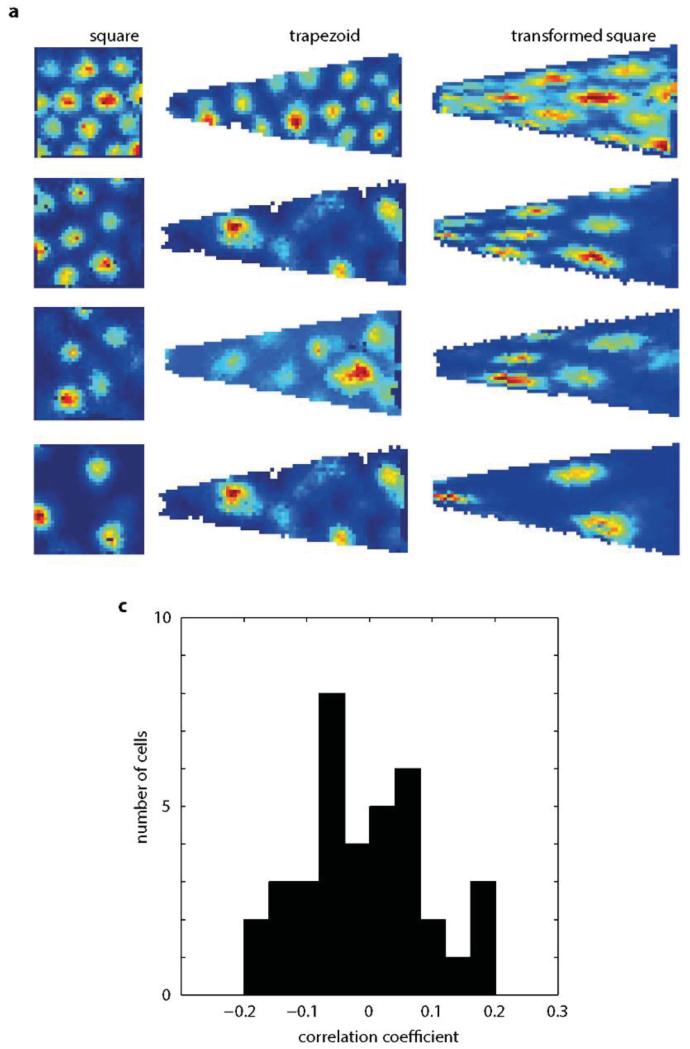
Extended Data Figure9. Grid cell pattern in trapezoid cannot be predicted by a simple transformation of a square to a trapezoid.
a, 4 grid cells from 4 rats recorded in a square (left) and trapezoid (middle). Predicted grid pattern (right) obtained by transforming a grid recorded in a square (left) into a trapezoid. c Correlation coefficients between the predicted morphed grid pattern and the one actually recorded in the trapezoid. The distribution is not significantly different from the normal distribution with a mean equal to zero (p=0.74, t=−0.33, df=36, one-sample t-test).
Supplementary Material
Acknowledgements
We thank Jasper Poort for helpful discussions. The research was supported by grants from the Wellcome Trust and the Gatsby Charitable Foundation. Julija Krupic is a Wellcome Trust Sir Henry Welcome Fellow. Caswell Barry is a Royal Society and Wellcome Trust Sir Henry Dale Fellow. This work was conducted in accordance with the UK Animals (Scientific Procedures) Act (1986).
Footnotes
Supplementary Information is linked to the online version of the paper at www.nature.com/nature.
The authors declare no competing financial interests.
References
- 1.Hafting T, Fyhn M, Molden S, Moser M-B, Moser EI. Microstructure of a spatial map in the entorhinal cortex. Nature. 2005;436:801–806. doi: 10.1038/nature03721. [DOI] [PubMed] [Google Scholar]
- 2.Buzsáki G, Moser EI. Memory, navigation and theta rhythm in the hippocampal-entorhinal system. Nat. Neurosci. 2013;16:130–138. doi: 10.1038/nn.3304. [DOI] [PMC free article] [PubMed] [Google Scholar]
- 3.Fuhs MC, Touretzky DS. A Spin Glass Model of Path Integration in Rat Medial Entorhinal Cortex. J. Neurosci. 2006;26:4266–4276. doi: 10.1523/JNEUROSCI.4353-05.2006. [DOI] [PMC free article] [PubMed] [Google Scholar]
- 4.Fiete IR, Burak Y, Brookings T. What Grid Cells Convey about Rat Location. J. Neurosci. 2008;28:6858–6871. doi: 10.1523/JNEUROSCI.5684-07.2008. [DOI] [PMC free article] [PubMed] [Google Scholar]
- 5.Burgess N. Grid cells and theta as oscillatory interference: Theory and predictions. Hippocampus. 2008;18:1157–1174. doi: 10.1002/hipo.20518. [DOI] [PMC free article] [PubMed] [Google Scholar]
- 6.Hasselmo ME. Grid cell mechanisms and function: Contributions of entorhinal persistent spiking and phase resetting. Hippocampus. 2008;18:1213–1229. doi: 10.1002/hipo.20512. [DOI] [PMC free article] [PubMed] [Google Scholar]
- 7.Barry C, Hayman R, Burgess N, Jeffery KJ. Experience-dependent rescaling of entorhinal grids. Nat Neurosci. 2007;10:682–684. doi: 10.1038/nn1905. [DOI] [PubMed] [Google Scholar]
- 8.Krupic J, Burgess N, O’Keefe J. Neural Representations of Location Composed of Spatially Periodic Bands. Science. 2012;337:853–857. doi: 10.1126/science.1222403. [DOI] [PMC free article] [PubMed] [Google Scholar]
- 9.Krupic J, Bauza M, Burton S, Lever C, O’Keefe J. How environment geometry affects grid cell symmetry and what we can learn from it. Philos. Trans. R. Soc. B Biol. Sci. 2014;369:20130188. doi: 10.1098/rstb.2013.0188. [DOI] [PMC free article] [PubMed] [Google Scholar]
- 10.Stensola H, et al. The entorhinal grid map is discretized. Nature. 2012;492:72–78. doi: 10.1038/nature11649. [DOI] [PubMed] [Google Scholar]
- 11.Gallistel C. The organization of action: A new synthesis. Lawrence Erlbaum Associates; Hillsdale, N. J.: [Google Scholar]
- 12.Cheng K. A purely geometric module in the rat’s spatial representation*. Cognition. 1983;23:149–178. doi: 10.1016/0010-0277(86)90041-7. [DOI] [PubMed] [Google Scholar]
- 13.Kelly JW, McNamara TP, Bodenheimer B, Carr TH, Rieser JJ. The shape of human navigation: How environmental geometry is used in maintenance of spatial orientation. Cognition. 2008;109:281–286. doi: 10.1016/j.cognition.2008.09.001. [DOI] [PMC free article] [PubMed] [Google Scholar]
- 14.Morris RGM, Garrud P, Rawlins JNP, O’Keefe J. Place navigation impaired in rats with hippocampal lesions. Nature. 1982;297:681–683. doi: 10.1038/297681a0. [DOI] [PubMed] [Google Scholar]
- 15.O’Keefe J, Dostrovsky J. The hippocampus as a spatial map. Preliminary evidence from unit activity in the freely-moving rat. Brain Res. 1971;34:171–175. doi: 10.1016/0006-8993(71)90358-1. [DOI] [PubMed] [Google Scholar]
- 16.Taube JS, Muller RU, Ranck JB., Jr. Head-direction cells recorded from the postsubiculum in freely moving rats. I. Description and quantitative analysis. J. Neurosci. Off. J. Soc. Neurosci. 1990;10:420–435. doi: 10.1523/JNEUROSCI.10-02-00420.1990. [DOI] [PMC free article] [PubMed] [Google Scholar]
- 17.Solstad T, Boccara CN, Kropff E, Moser M-B, Moser EI. Representation of geometric borders in the entorhinal cortex. Science. 2008;322:1865–1868. doi: 10.1126/science.1166466. [DOI] [PubMed] [Google Scholar]
- 18.Barry C, et al. The boundary vector cell model of place cell firing and spatial memory. Rev. Neurosci. 2006;17:71–97. doi: 10.1515/revneuro.2006.17.1-2.71. [DOI] [PMC free article] [PubMed] [Google Scholar]
- 19.O’Keefe J, Burgess N. Geometric determinants of the place fields of hippocampal neurons. Nature. 1996;381:425–428. doi: 10.1038/381425a0. [DOI] [PubMed] [Google Scholar]
- 20.Barry C, Ginzberg LL, O’Keefe J, Burgess N. Grid cell firing patterns signal environmental novelty by expansion. Proc. Natl. Acad. Sci. 2012;109:17687–17692. doi: 10.1073/pnas.1209918109. [DOI] [PMC free article] [PubMed] [Google Scholar]
- 21.Derdikman D, et al. Fragmentation of grid cell maps in a multicompartment environment. Nat. Neurosci. 2009;12:1325–1332. doi: 10.1038/nn.2396. [DOI] [PubMed] [Google Scholar]
Associated Data
This section collects any data citations, data availability statements, or supplementary materials included in this article.


