

Abstract
BNip3 is a hypoxia-inducible protein that targets mitochondria for autophagosomal degradation. We report a novel tumor suppressor role for BNip3 in a clinically relevant mouse model of mammary tumorigenesis. BNip3 delays primary mammary tumor growth and progression by preventing the accumulation of dysfunctional mitochondria and resultant excess ROS production. In the absence of BNip3, mammary tumor cells are unable to reduce mitochondrial mass effectively and elevated mitochondrial ROS increases the expression of Hif-1α and Hif target genes, including those involved in glycolysis and angiogenesis—two processes that are also markedly increased in BNip3-null tumors. Glycolysis inhibition attenuates the growth of BNip3-null tumor cells, revealing an increased dependence on autophagy for survival. We also demonstrate that BNIP3 deletion can be used as a prognostic marker of tumor progression to metastasis in human triple-negative breast cancer (TNBC). These studies show that mitochondrial dysfunction—caused by defects in mitophagy—can promote the Warburg effect and tumor progression, and suggest better approaches to stratifying TNBC for treatment.
Keywords: BNip3, breast cancer, glycolysis, HIF-1α, invasive carcinoma, mitophagy, ROS
Introduction
Mitophagy is a selective form of macro-autophagy in which mitochondria are selectively targeted for degradation in autophagolysosomes 1, 2. Mitophagy plays a housekeeping function in eliminating damaged mitochondria but also promotes reduction of overall mitochondrial mass in response to certain physiological stresses, such as hypoxia and nutrient starvation 3, 4. The importance of maintaining healthy mitochondria for tumor cell resistance to therapy has been supported by several recent studies 5, 6, 7, making it important to appreciate how processes such as mitophagy that promote mitochondrial integrity are modulated during tumorigenesis. To address the role of mitophagy in cancer more directly than can be done through inhibition of general autophagy 8, 9, 10, we examined the effect of loss of BNIP3 function on tumorigenesis in vivo.
BNIP3 is a transcriptional target of hypoxia-inducible factor-1 (HIF-1) that is strongly and rapidly induced by hypoxia 11, 12. BNIP3 was originally reported to function as a BH3-only protein that induced programmed cell death 11, 13. However, since the weakly conserved BH3 domain in BNIP3 is redundant for function 14 and key normal tissues express BNIP3 at high levels in the absence of cell death 15, it is clear that additional signals are required for cell death associated with over-expression of BNIP3. More recently, BNIP3 has been shown to function at the outer mitochondrial membrane (OMM) as a molecular adaptor targeting mitochondria for turnover at the autophagosome through its interaction with LC3-related molecules at nascent phagophores 3, 16, 17. This activity of BNIP3 in promoting mitophagy is more consistent with an adaptive response to hypoxia than is induction of cell death. While a role for some HIF targets, such as VEGF, Ang-2, Angl4 and LOX/LOXL 18, 19, in tumor progression and metastasis has been described, it is not clear to what extent other HIF targets, such as BNIP3, also play a role. We made use of genetically engineered mouse models to address the role of BNip3 in mammary tumorigenesis in vivo and related these findings to our data examining BNIP3 inactivation in human breast cancer.
Results
Loss of BNip3 increases mammary tumor cell proliferation and primary mammary tumor growth
The MMTV-PyMT mouse mammary tumor model was selected for study as a well-characterized model of breast cancer that spontaneously progresses to metastasis 20 and is widely used in the field 21, 22, 23. Immunohistochemical analysis of BNip3 protein expression during the progression of mammary tumorigenesis in MMTV-PyMT mice (Fig1A and B) showed that while BNip3 was robustly expressed at the adenoma/mammary intra-epithelial neoplasia (MIN) stage (d50–d65) of tumor growth and in early carcinoma (d65–d80), its expression was gradually lost upon progression to malignant carcinoma. BNip3-negative tumor cells started to emerge at the late carcinoma stage (d80–d95) and predominated in both metastatic carcinoma (d95–d105) and lung metastases in MMTV-PyMT mice (Fig1A and B).
Figure 1.

Loss of BNip3 promotes mammary tumor growth
- A, B BNip3 protein expression during mammary tumorigenesis in MMTV-PyMT mice detected at the adenoma/MIN stage of progression (50–65 days of age, n = 4), early carcinoma stage of tumorigenesis (65–80 days of age), late carcinoma stage (80–95 days of age, n = 4), metastatic carcinoma (95–105 days of age, n = 4) and in lung metastases (95–105 days of age, n = 4). Scale bar is 100 μm.
- C Kaplan–Meier survival curve of MMTV-PyMT mice with either a wild-type (blue, n = 11) or BNip3 null (red, n = 11) background. Median survival of wild-type mice was 104 days and 80 days for BNip3 null mice. Significance P < 0.0001.
- D Primary mammary tumor weights at d80 in wild-type (n = 24) and BNip3 null mice (n = 21).
- E Gradient echo MRI images of mammary tumors (red arrows indicate the presence of tumor) at imaging resolution of approximately 117 mm, and slice thickness 0.5 mm.
- F, G Immunohistochemical staining for Ki67 in wild-type (n = 20) and BNip3 null (n = 20) tumor sections at d65. Scale bar is 50 μm. Red arrows indicate regions of ectopic proliferation.
- H Growth rate of primary wild-type (blue) and BNip3 null (red) MECs in vitro at 20% or 1% oxygen, measured in triplicate experiments.
- I Growth rate of parental BNip3 null MECs, untreated or expressing either control empty vector (+ Empty vector) or BNip3-expressing vector (+ BNip3-WT), measured in triplicate experiments.
Data information: Results are expressed as the mean ± SEM. *P < 0.05, **P < 0.01, ***P < 0.001.
To examine the significance of changes in BNip3 expression for mammary tumor growth and progression, we crossed MMTV-PyMT mice to mice carrying a targeted deletion of BNip3 and compared primary tumor incidence and growth in MMTV-PyMT;BNip3−/− mice to that in control MMTV-PyMT;BNip3+/+ mice. We confirmed loss of BNip3 protein expression in BNip3 null tumors by immunohistochemical staining on tumor sections (Fig EV1A and B) and by Western blot on isolated primary tumor cell lines (Fig EV1C). While tumor latency was indistinguishable between wild-type and BNip3 null mice, progression of disease to experimental endpoint was significantly more rapid in MMTV-PyMT mice on a BNip3 null background (Fig1C). In contrast to wild-type MMTV-PyMT mice that did not become moribund until approximately d105, BNip3 null mice were routinely sacrificed between d80 and d90 due to tumor burden (Fig1C). Primary tumor volume at d80 was significantly greater for BNip3 null tumors compared to wild-type (Fig1D), suggesting that tumors in MMTV-PyMT mice grew more rapidly on a BNip3 null background. The increased rate of growth of PyMT-driven mammary tumors in BNip3 null mice is illustrated by magnetic resonance imaging (MRI) of individual tumors in age-matched wild-type and BNip3 null mice over time in which the tumors were similarly sized at early stages (Fig1E, left panels) but BNip3 null tumors expanded more rapidly by d60 and further still by d80 (Fig1E, middle and right panels). Immunohistochemical analysis of Ki67 expression determined that there were increased numbers of Ki67-positive cells in BNip3 null tumors compared to wild-type (Fig1F and G). Both wild-type and BNip3 null tumors showed strong Ki67 staining on the outside of tumor acini near the basal layer, but BNip3 null tumors also showed strong staining throughout the acini (Fig1F, red arrows) consistent with BNip3 null tumors being more proliferative and more invasive.

Verification of loss of BNip3 expression and re-expression
- A, B BNip3 protein expression determined by immunohistochemistry at early carcinoma stage of tumorigenesis (65–80 days of age) in wild-type (A) and BNip3 null (B). Scale bar is 200 μm.
- C Western blot analysis for expression of BNip3 in extracts from wild-type and BNip3 null MECs grown at 20% and 1% oxygen.
- D Cell cycle phase distribution of wild-type and BNip3 null MECs measured in triplicate experiments by BrdU labeling over 5 h in culture followed by labeling of fixed cells with α-BrdU and PI. Results are expressed as the mean ± SEM. ****P < 0.0001.
- E Western blot analysis for expression of exogenous BNip3 in extracts from parental BNip3 null MECs (Par), BNip3 null MECs expressing empty control vector (+ Empty vector) or BNip3 null MECs expressing exogenous BNip3 (+ BNip3-WT) grown at 20% and 1% oxygen.
We isolated primary mammary epithelial cells (MECs) from MMTV-PyMT;BNip3+/+ and MMTV-PyMT;BNip3−/− tumors and measured their growth in vitro. Loss of BNip3 significantly increased the growth rate of MECs at atmospheric oxygen compared to wild-type control cells (Fig1H). Hypoxic culture conditions (1% oxygen) attenuated the growth of BNip3 null MECs to a certain extent, but BNip3 null MECs continued to grow markedly faster than wild-type controls even at hypoxia (Fig1H). To determine whether increased growth of BNip3 null MECs in vitro was associated with increased proliferation, we measured rates of incorporation of BrdU and observed that significantly more BNip3 null cells incorporated BrdU and entered S phase during the course of a 5-h labeling experiment than did wild-type control MECs (Fig EV1D). Re-expression of exogenous mouse BNip3 in BNip3 null MECs (Fig EV1E) significantly limited their growth compared to either parental BNip3 null MECs or those infected with control empty virus vector (Fig1I). These results are consistent with a growth-suppressive function for BNip3 in mammary tumorigenesis in the MMTV-PyMT model.
To assess whether reduced cell death also contributed to the increased size of BNip3 null tumors, we performed TUNEL staining on both wild-type and BNip3 null tumors (Fig EV2A–D). Cell death was observed in tumors of both genotypes at d65 and d80, but there was no significant difference in cell death in BNip3 null tumors in vivo compared to wild-type (Fig EV2E). We also failed to detect any difference in levels of propidium iodide uptake between wild-type and BNip3 null MECs cultured at either 20% or 1% oxygen (Fig EV2F). These results demonstrate that increased growth of BNip3 null mammary epithelial cells in vitro and in vivo is associated with increased proliferation and not reduced cell death.

Measurement of cell death in wild-type and BNip3 null tumors
- A–D TUNEL staining on wild-type and BNip3 null tumors at d65 and d80.
- E Quantification of TUNEL staining from (A–D). Results are expressed as the mean ± SEM.
- F Flow cytometric analysis of PI exclusion as a measure of cell death on wild-type and BNip3 null MECs grown at 20% or 1% oxygen. Results are expressed as the mean ± SEM.
Loss of BNip3 accelerates malignant progression and reduces the latency of lung metastasis
Histological examination of primary mammary tumors forming in MMTV-PyMT mice showed accelerated progression to invasiveness in BNip3 null tumors compared to wild-type (Fig2A–J). Specifically, we observed increased nuclear grade in BNip3 null tumors (nuclear grade 3) compared to wild-type tumors (nuclear grade 2) as early as d35 (Fig2B), with the appearance of atypical mitotic figures, variable nuclear size and prominent nucleoli in contrast to wild-type tumors (Fig2A) that showed a high mitotic index but little variation in nuclear size. By d50 to d65, the BNip3 null tumors had lost expression of estrogen receptor-alpha (ER-α) (Fig2D), whereas the wild-type tumors maintained robust ER-α expression through d65 (Fig2C). Finally, there was marked nuclear pleomorphism and hyperchromatic nuclei in the BNip3 null tumors by d80 (Fig2F, red circle) that was not evident in the wild-type tumors at this stage of tumorigenesis (Fig2E). We also observed early loss of basement membrane integrity in BNip3 null tumors that was evident by hematoxylin and eosin staining (Fig2H compared to G) and confirmed by loss of staining for laminin-α1, a basement membrane component (Fig2J). By contrast, staining for laminin-α1 was evident in age-matched wild-type tumors (Fig2I), indicating that BNip3 deletion promoted early loss of basement membrane integrity. These results are consistent with more rapid progression of BNip3 null tumors to malignancy than wild-type tumors with BNip3 null tumors showing features of carcinomas at stages when the wild-type tumors retain markers of adenoma/MIN 20.
Figure 2.

Loss of BNip3 promotes early progression to carcinoma and increased lung metastases
- A, B Primary mammary tumors in BNip3 null mice at d35 showed increased nuclear grade (grade 3) compared to wild-type (grade 2).
- C, D Expression of estrogen receptor-alpha (ER-α) at d65 shows reduced expression in BNip3 null tumors compared to wild-type.
- E, F Increased pleomorphism and evidence of epithelial–mesenchymal transition (EMT) in BNip3 null tumors at d80 but not in wild-type.
- G, H Loss of basement membrane integrity in BNip3 null tumors at d65 (indicated by the red arrow).
- I, J Laminin-α1 staining confirms loss of basement membrane integrity in BNip3 null tumors at earlier stages than for wild-type (black arrows indicate laminin-α1-expressing basement membrane in wild-type and loss of basement membrane integrity in BNip3 null).
- K, L Migration–invasion assays in Transwell assays, measured in triplicate. Quantification of invasion through collagen-coated Transwell inserts and migration across uncoated inserts for wild-type and BNip3 null MECs grown under 20% or 1% oxygen.
- M, N Growth of wild-type and BNip3 null 3D spheres in Matrigel, measured in triplicate.
- O, P Increased lung metastases at d80 in BNip3 null mice (n = 21) compared to wild-type (n = 24).
Data information: Black scale bar is 50 μm. White scale bar is 20 μm. Results are expressed as the mean ± SEM. ***P < 0.001, ****P < 0.0001.
When we compared the migration and invasion properties of isolated wild-type and BNip3 null MECs in vitro in classical Boyden chamber assays, we observed a statistically significant increase in the migration of BNip3 null MECs compared to wild-type (Fig2K). We also observed an increase in the invasiveness of BNip3 null MECs through collagen compared to wild-type (Fig2L) that was increased further over wild-type when cultured under hypoxic conditions (Fig2L). These results indicate that loss of BNip3 promotes tumor cell migration and invasion in vitro.
We also assessed the effect of BNip3 loss on growth in three-dimensional (3D) culture 21 and observed that the 3D sphere forming efficiency of BNip3 null MECs was 2- to 3-fold greater than that of wild-type MECs (Fig2M and N) when plated in Matrigel. Organoids forming from BNip3 null MECs were also more disorganized than wild-type with numerous distinctly shaped 3D structures (Fig2M, bottom panels), indicating that loss of BNip3 promotes a more invasive and depolarized phenotype in 3D culture also.
Consistent with these observations in vitro, we observed that loss of BNip3 accelerated metastasis to the lungs in vivo with a markedly reduced latency of overt lung metastases compared to wild-type, such that by d80, significant numbers of lung metastases were readily detectable in the BNip3 null MMTV-PyMT mice (Fig2O and P). By contrast, very few, if any, lung metastases could be detected in the lungs of wild-type MMTV-PyMT mice at this time point (Fig2O and P). The earlier development of lung metastases in MMTV-PyMT;BNip3−/− mice compared to wild-type controls is consistent with the more rapid progression to invasive carcinoma observed in the primary tumor of the BNip3 null mice (Fig2A–J). Together, these results demonstrate that loss of BNip3 leads to increased primary tumor growth, increased invasiveness and progression to carcinoma with an associated increase in the incidence of lung metastases in MMTV-PyMT mice.
Accelerated tumor growth and lung metastasis by BNip3 null tumor cells is cell intrinsic
Given previous studies that indicated critical functions for components of the immune system in lung metastasis in the MMTV-PyMT mouse model 21, we examined whether increased tumor growth and invasive properties of BNip3 null tumors were recapitulated when primary MECs from either wild-type or BNip3 null MMTV-PyMT mice were transplanted orthotopically into the mammary fat pad of syngeneic wild-type FVB/N mice. We observed that BNip3 null MECs gave rise to larger and histologically more aggressive primary tumors than did equal numbers of wild-type MECs transplanted into wild-type host female mice (Fig EV3A and B). Similar to primary autochthonous tumors, tumors derived from transplanted BNip3 null MECs showed increased staining for Ki67 and earlier loss of ER-α expression than did tumors derived from wild-type MECs (Fig EV3B). Injection of either wild-type or BNip3 null donor MECs into BNip3 null host mice did not accelerate the phenotype compared to injection into wild-type hosts (Fig EV3A), consistent with the more rapid growth of BNip3 null MMTV-PyMT tumors being cell autonomous and not attributable to a non-cell-autonomous role for BNip3 in the tumor microenvironment. Consistently, larger and more numerous lung metastases were observed following transplant into wild-type hosts of BNip3 null MECs compared to wild-type MECs (Fig EV3C). These results indicate that the increased growth rate and metastatic potential of BNip3 null MMTV-PyMT tumor cells is cell intrinsic. In summary, our data suggest that BNip3 plays a cell-autonomous role in restraining tumor cell growth and malignant progression to invasiveness and metastasis in the MMTV-PyMT mouse model of mammary tumorigenesis.

Loss of BNip3 has cell-autonomous effects on tumor cell growth in vivo
- Weights of tumors forming from wild-type or BNip3 null MECs transplanted into the mammary fat pad of wild-type or BNip3 null host mice. Results are expressed as the mean ± SEM. *P < 0.05.
- Histological analysis of tumors formed from wild-type or BNip3 null MECs following transplant into the mammary fat pad of wild-type mice. White scale bar is 50 μm. Black scale bar is 100 μm.
- Quantification of lung metastases forming from wild-type or BNip3 null MECs transplanted into the mammary fat pad of wild-type or BNip3 null host mice. Results are expressed as the mean ± SEM.
Loss of BNip3 leads to dysfunctional mitochondria
Given the known role of BNip3 in mitophagy and to understand how BNip3 could be functioning to modulate tumor growth and progression to carcinoma, we investigated the effects on mitochondrial mass and function associated with BNip3 loss in mammary tumorigenesis in the MMTV-PyMT model. BNip3 null primary tumors exhibited a marked decrease in overlap between LC3-positive autophagosomes and mitochondria in BNip3 null tumor cells compared to wild-type cells under hypoxia (Fig3A and B) that could be rescued by expression of exogenous BNip3 in parental BNip3 null MECs (Fig3A and B). We also observed increased mitochondrial:nuclear genome ratio in BNip3 null tumor cells compared to wild-type cells (Fig3C) with exogenous BNip3 expression significantly reduced mitochondrial:nuclear genome ratio in parental BNip3 null MECs in contrast to those expressing empty vector control (Fig3C). These results indicate that BNip3 loss leads to reduced mitophagy in mammary tumor cells but that BNip3 re-expression can restore mitophagy to levels seen in wild-type tumor cells. Furthermore, immunohistochemical staining of primary tumors at d65 revealed increased expression of CoxIV (a subunit of cytochrome oxidase of the mitochondrial respiratory chain), voltage-dependent anion channel-1 (Vdac1) and TOM20 (a constitutively expressed mitochondrial protein) in BNip3 null tumors compared to age-matched wild-type control tumors (Fig3D and E). Elevated expression of Vdac1 and CoxIV was also detected by Western blot in extracts from BNip3 null MECs compared to wild-type MECs, at atmospheric oxygen and at hypoxia (Fig3F). Similarly, we detected increased expression of Nix in BNip3 null tumor cells compared to wild-type (Fig3F). Transmission electron microscopy confirmed increased mitochondrial density in BNip3 null tumor cells compared to wild-type (Fig3G) in addition to detecting abnormally shaped mitochondria with pinched off ends (Fig3G, red arrows). By contrast, autophagosomal vesicles were readily apparent in proximity to mitochondria in wild-type tumor cells (Fig3G, yellow arrow). These results support the conclusion that loss of BNip3 is associated with increased mitochondrial mass in MMTV-PyMT mammary tumor cells in vitro and in vivo due to reduced levels of mitophagy.
Figure 3.

Loss of BNip3 leads to increased mitochondrial mass but reduced mitochondrial function
- A, B Co-immunofluorescence for endogenous LC3B (green, autophagosomes) and cyclophilin D (red, mitochondria) to examine the levels of mitophagy in wild-type and BNip3 null MECs determined as the number of yellow puncta arising due to overlap of mitochondria and autophagosomes (indicated by white arrows). This was examined at 20% oxygen (untreated), 1% oxygen (hypoxia) and 1% oxygen + bafilomycin A1 (hypoxia + BafA) and in BNip3 null MECs expressing either empty vector control or exogenous BNip3. Scale bar is 20 μm. Quantification of number of yellow puncta (B) per 63 × field. n > 4 for all treatments.
- C qPCR for mitochondrial genome-encoded Nd1 and Cytb standardized to nuclear-encoded β-globin in wild-type MECs, BNip3 null MECs, BNip3 null MECs expressing empty vector control or BNip3 null MECs expressing exogenous BNip3-WT for three independent experiments performed in 8 replicates each.
- D, E Immunohistochemical staining for expression of cytochrome c oxidase-IV (CoxIV), voltage-dependent anion channel-1 (Vdac1) and TOM20 on sections from wild-type (n = 4) and BNip3 null (n = 4) tumors at d65 and quantified (E) using the Aperio system. Scale bar is 50 μm.
- F Western blot analysis for expression of mitochondrial proteins in extracts from wild-type and BNip3 null MECs grown at 20% and 1% oxygen.
- G Transmission electron micrographs of wild-type and BNip3 null primary tumors at d35 illustrating increased mitochondrial density (mt) in BNip3 null tumors compared to wild-type, altered structure (red arrow) and the presence of vesicles in wild-type tumors (yellow arrows). Scale bar is 1 μm.
- H Citrate synthase activity assay as a measure of mitochondrial function on wild-type and BNip3 null MECs grown at 20% and 1% oxygen, measured in triplicate experiments.
- I Measurement of uptake of 14C-labeled pyruvate or glutamine by wild-type and BNip3 null MECs, measured in triplicate experiments.
- J Flow cytometric analysis of TMRE staining as a measure of mitochondrial membrane potential in wild-type and BNip3 null MECs grown at 20% and 1% oxygen, measured in triplicate experiments.
Data information: Results are expressed as the mean ± SEM. *P < 0.05, **P < 0.01, ***P < 0.001, ****P < 0.0001.
We detected significantly reduced citrate synthase activity in BNip3 null tumor cells grown in vitro compared to wild-type (Fig3G) that could not be attributed to reduced expression of citrate synthase (Fig3F). In addition, uptake of both 14C-labeled pyruvate and 14C-labeled glutamine into mitochondria in BNip3 null tumor cells was reduced compared to wild-type (Fig3I). Finally, staining of tumor cells with the potentiometric dye TMRE revealed that BNip3 null cells contained significantly more depolarized mitochondria than wild-type (Fig3J). Together, these results indicate that loss of BNip3 leads to increased mitochondrial mass but reduced overall function of mitochondria in primary MMTV-PyMT mammary tumor cells in vitro and in vivo.
Increased glycolysis and reduced oxidative metabolism in BNip3 null tumor cells
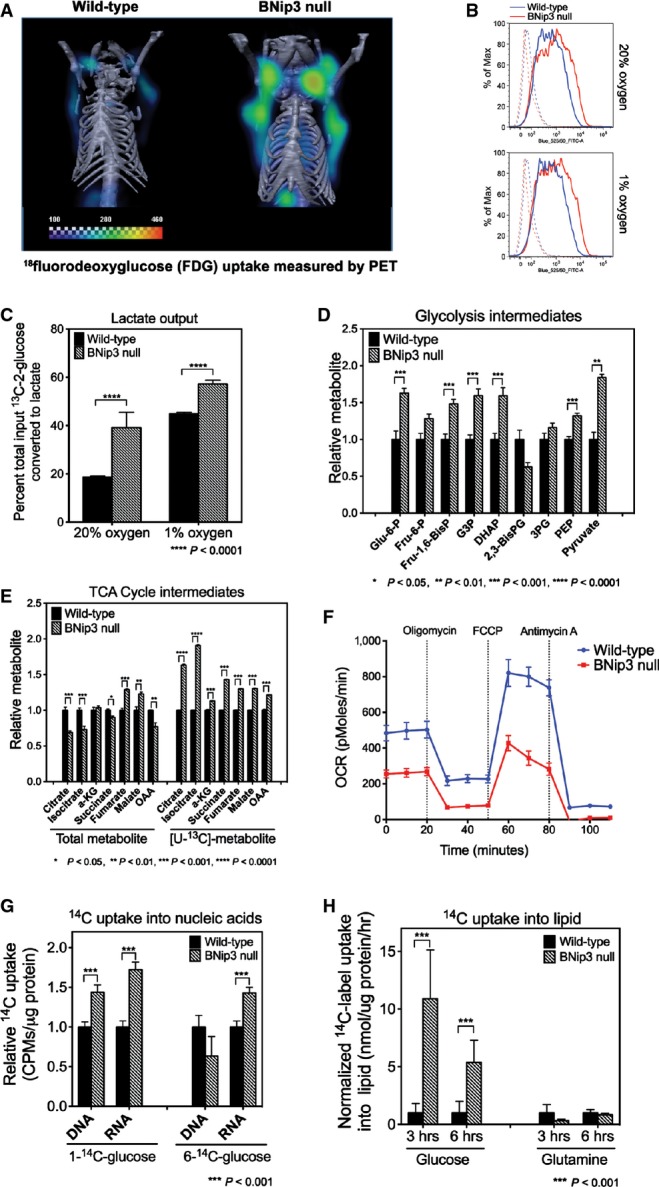
Given the central role of mitochondria in cellular metabolism, we investigated whether altered growth of BNip3 null tumors was associated with deregulated tumor cell metabolism. Micro-PET/CT imaging of 18fluorodeoxyglucose (FDG) uptake in vivo into mammary tumors in MMTV-PyMT mice at d50 (when wild-type and BNip3 null tumors were indistinguishable in volume) showed markedly increased FDG uptake into the BNip3 null tumors than wild-type (Fig4A). Consistently, in vitro uptake of fluorescently labeled glucose was higher in BNip3 null MECs compared to wild-type at both atmospheric oxygen and under hypoxia (Fig4B). Furthermore, output of lactate by BNip3 null MECs was significantly higher than by wild-type cells, particularly at 20% oxygen (Fig4C) consistent with increased aerobic glycolysis in BNip3 knockout tumor cells.
Figure 4.
Loss of BNip3 induces aerobic glycolysis and suppresses oxidative phosphorylation
- μPET/CT imaging of wild-type (n = 5) and BNip3 null (n = 5) mice at d50 following injection of mice with 18F-deoxyglucose to examine glucose uptake by tumors.
- Flow cytometric measurement of fluorescent glucose uptake by wild-type and BNip3 null MECs grown in vitro at 20% and 1% oxygen.
- Lactate output by wild-type and BNip3 null MECs grown at 20% and 1% oxygen was measured by NMR, performed in triplicate.
- Mass spectrometric measurement of total levels of glycolytic intermediates (n = 4 for each genotype).
- Mass spectrometric measurement of total levels of TCA cycle intermediates and of 13C-labeled intermediates after growth in [U13C]-glucose for 6 h (3 biological replicates and 3 experimental replicates).
- Oxygen consumption using Seahorse XF96 by wild-type (blue) and BNip3 null (red) MECs (6 experimental replicates per point), performed in triplicate experiments.
- Measurement of uptake of 14C-labeled glucose into nucleic acids in wild-type and BNip3 null MECs (performed twice in triplicate).
- Measurement of uptake of 14C-labeled glucose or glutamine into lipid in wild-type and BNip3 null MECs (performed twice in triplicate).
Data information: Results are expressed as the mean ± SEM. *P < 0.05, **P < 0.01, ***P < 0.001, ****P < 0.0001.
Metabolite profiling by mass spectrometry showed higher total levels of most glycolytic intermediates in BNip3 null MECs (Fig4D), including increased levels of glucose-6-phosphate, as expected if glucose uptake is increased, as well as increased fructose bis-phosphate, glyceraldehyde-3-phosphate and pyruvate. Interestingly, levels of bis-phosphoglycerate were reduced in BNip3 null tumor cells, while levels of 3-phosphoglycerate were only modestly increased compared to other glycolytic intermediates (Fig4D). This may be due to increased use of dihydroxyacetone phosphate to make glycerol-3-phosphate that is markedly increased in BNip3 null tumor cells compared to wild-type (Fig EV4A).
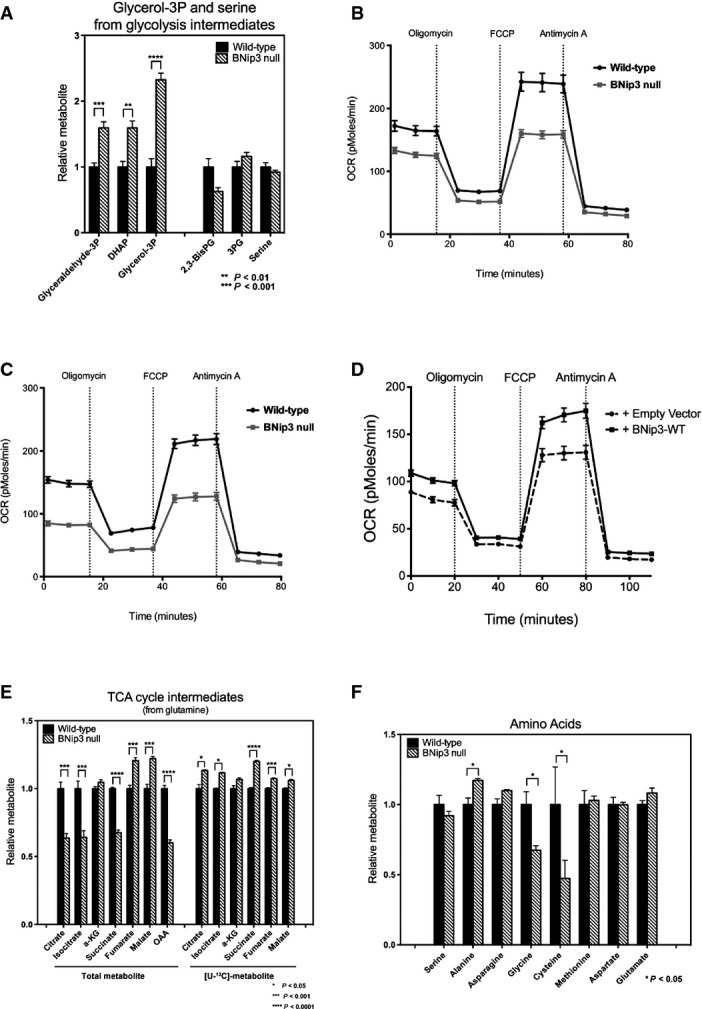
Additional effects of BNip3 loss on metabolism
- A Mass spectrometric measurement of total levels of glycerol-3-phosphate and serine plus the glycolytic intermediates from which they are generated.
- B, C Oxygen consumption by wild-type and BNip3 null MECs grown in the presence of glutamine (B) or glucose plus glutamine (C).
- D Oxygen consumption by BNip3 null MECs following expression of either empty vector (hashed line) or BNip3-expressing vector (solid line) (6 experimental replicates per point), performed in triplicate experiments.
- E Mass spectrometric measurement of TCA cycle intermediates after 24 h of growth in [U-13C]-glutamine.
- F Mass spectrometric measurement of total levels of amino acids in wild-type and BNip3 null MECs grown on glucose.
Data information: Results are expressed as the mean ± SEM. *P < 0.05, **P < 0.01, ***P < 0.001, ****P < 0.0001.
Consistent with reduced pyruvate and glutamine uptake into mitochondria (Fig3I), we detected lower total levels of many TCA cycle intermediates including citrate, isocitrate and oxaloacetate (Fig4E). Despite reduced total levels of these metabolites, glucose-derived carbon contributed proportionately more to citrate and other citric acid cycle intermediates in BNip3 null tumor cells compared to wild-type (Fig4E, right) indicating greater consumption of citrate and/or reduced generation of citrate from other sources. Respiration rates were also markedly lower in the BNip3 null mammary tumor cells compared to wild-type using both glucose as substrate (Fig4F) and glutamine (Fig EV4B and C), again consistent with mitochondrial dysfunction. Exogenous BNip3 expression increased both basal levels of oxygen consumption and spare respiratory capacity in BNip3 null MECs compared to control-infected MECs (Fig EV4D), suggesting that the ability of BNip3 to suppress tumor cell growth (Fig1H) is linked to its ability to promote oxidative metabolism.
In addition to increased aerobic glycolysis and reduced respiration, we observed an increased rate of nucleic acid production (DNA and RNA) from 14C-glucose in BNip3 null MECs compared to wild-type, primarily via the oxidative arm of the pentose phosphate pathway (Fig4G). We also detected increased 14C-glucose converted to lipid in BNip3 null MECs compared to wild-type control cells (Fig4H). Interestingly, there was reduced conversion of 14C-glutamine into lipid in BNip3 null tumor cells compared to wild-type cells indicating that the majority of lipid synthesis in BNip3 null tumor cells comes from glucose-derived glycerol-3-phosphate (Fig EV4A) and glucose-derived citrate (Fig4E), as opposed to reductive carboxylation from glutamine.
In summary, loss of BNip3 and accumulation of defective mitochondria promotes glucose uptake and aerobic glycolysis in the MMTV-PyMT tumor model resulting in reduced respiration but increased synthesis of both nucleic acids and lipids from glucose, all features of the Warburg effect 24.
Stabilization of Hif-1α and increased angiogenesis in BNip3 null tumors
A key driver of the Warburg effect is HIF-1α that induces expression of many of the glycolytic enzymes required to sustain aerobic glycolysis 24. Immunohistochemical analysis of Hif-1α levels revealed increased staining for nuclear Hif-1α in BNip3 null tumors in vivo compared to wild-type (Fig5A). Importantly, increased expression of Hif-1α in BNip3 null tumors was observed as early as d50 (Fig5A), before differences in tumor volumes were observed (Fig1D and E). Increased Hif target gene expression was also found in BNip3 null tumors compared to wild-type (Fig5B). Consistent with increased glycolysis in BNip3 null tumors compared to wild-type (Fig4), qPCR detected marked increases in expression of HIF targets involved in regulating glycolysis, including HK2, Pdk1, Pgk1 and Slc2a1 (Fig5B).
Figure 5.

Loss of BNip3 promotes increased Hif-1α activity
- A Immunohistochemical staining for Hif-1α in wild-type (n = 4) and BNip3 null (n = 4) tumors at d50. Scale bar at low magnification is 200 μm. Scale bar at high magnification is 50 μm.
- B qPCR for expression of key Hif target genes and other growth-related genes in tumors from wild-type and BNip3 null mice at d80 (n = 2 per genotype, performed in triplicate).
- C Western blot for Hif-1α, Nrf-2 and Parp-1 on nuclear extracts from wild-type and BNip3 null MECs grown at 20% or 1% oxygen.
- D Western blot for Hif-1α and Parp-1 on nuclear extracts from wild-type and BNip3 null MECs (lanes 1, 2), and on parental BNip3 null MECs expressing either empty control vector (+ Empty vector, lane 3) or BNip3-expressing vector (+ BNip3-WT, lane 4), all cultured at 1% oxygen.
- E qPCR for key HIF target genes in BNip3 null MECs before and after treatment with 10 ng/ml echinomycin.
- F Growth rate of primary wild-type (blue) and BNip3 null (red) MECs treated with 10 ng/ml echinomycin, measured in triplicate experiments.
- G, H Immunohistochemical staining for CD31 on wild-type (n = 20) and BNip3 null (n = 20) tumors at d80. Scale bar is 25 μm.
- I, J Immunohistochemical staining for α-SMA on wild-type (n = 20) and BNip3 null (n = 20) tumors at d80. Scale bar is 25 μm.
- K, L Co-staining for CD31 and α-SMA on frozen sections of wild-type (n = 8) and BNip3 null (n = 8) tumors at d80. Scale bar is 10 μm.
- M, N Quantification of vessel count (M) and pericyte coverage (N) in wild-type and BNip3 null tumors at d80.
Data information: Results are expressed as the mean ± SEM. *P < 0.05, **P < 0.01, ***P < 0.001, ****P < 0.0001.
Hif-1α protein levels were also elevated in primary BNip3 null tumor cells cultured at either 20% oxygen (Fig5C, lane 2) or 1% oxygen (Fig5C, lane 4) compared to wild-type (Fig5C, lanes 1 and 3), and expression of exogenous BNip3 in BNip3 null MECs markedly reduced Hif-1α accumulation (Fig5D, lane 3) compared to either parental BNip3 null MECs or cells expressing control vector (Fig5D, lanes 1 and 2). To assess to what extent elevated Hif levels contributed to the observed hyper-proliferative phenotype (Fig1H), we treated cells with 10 ng/ml echinomycin (a small molecule inhibitor of Hif DNA binding activity) 25 and confirmed that echinomycin reduced expression of key Hif target genes (Fig5E). Significantly, echinomycin treatment also markedly reduced growth of BNip3 null MECs (Fig5F) such that they grew at similar rates to wild-type MECs, while having a limited effect on the growth of wild-type cells (Fig5F).
In addition to glycolysis genes regulated by Hif-1, we also detected increased expression of Vegfa, Flt-1 and Ang-2 that are known HIF targets involved in modulating angiogenesis (Fig5B). Increased expression of these angiogenesis regulators (Fig5B) was associated with increased total blood vessel number (Fig5H and M) in BNip3 null tumors compared to wild-type (Fig5G and M), although blood vessel morphology was clearly abnormal in BNip3 null tumors with shorter and more distorted vessels apparent (Fig5H, red arrow). Consistently, we observed reduced expression of α-smooth muscle actin (α-SMA), a pericyte marker (Fig5J), compared to wild-type (Fig5I) and reduced co-localization of α-SMA with CD31 in BNip3 null tumors (Fig5L) compared to wild-type (Fig5K), indicating reduced pericyte coverage of endothelial cells and blood vessels (Fig5N). These results show that loss of BNip3 promotes endothelial cell expansion and blood vessel formation but that these blood vessels are immature and lack pericyte support compared to vessels in age-matched control tumors from wild-type mice. Blood vessel dysfunction may contribute to the elevated levels of hypoxia in BNip3 null tumors and feedback to increase Hif-α levels further in vivo. Together, these results indicate that loss of BNip3, a Hif-1α target gene itself 12, leads to increased Hif-1α levels and increased expression of Hif target genes, including regulators of glycolysis and angiogenesis, processes linked to increased tumor growth and progression 26.
Increased ROS production linked to mitochondrial dysfunction contributes to Hif-1α stabilization and tumor progression in vivo
Reactive oxygen species (ROS) generation is increased in dysfunctional mitochondria, and ROS are known to modulate Hif-1α stability 27, 28, 29, 30, 31. We performed two distinct in vivo assays to measure ROS in situ in wild-type and BNip3 null tumors (Fig6A). Firstly, we quantified nuclear staining for cellular superoxide using dihydroethidine (DHE) that fluoresces red and intercalates into double-stranded DNA when oxidized and detected markedly higher levels of nuclear DHE in BNip3 null tumors compared to wild-type (Fig6A and B). Secondly, we quantified immunohistochemical staining for 8-hydroxy-2′-deoxyguanosine (8-OHdG) in nucleotides pools and, again consistent with the DHE results, showed significantly elevated levels of 8-OHdG in BNip3 null tumor cells compared to wild-type (Fig6A and B). We also detected significantly increased mitochondrial ROS in BNip3 null tumor cells in vitro at both 20% oxygen and 1% oxygen (Fig6C). Increased oxidized glutathione and lower levels of reduced glutathione in BNip3 null tumor cells compared to wild-type (Fig6D) were also consistent with increased ROS in BNip3 null tumor cells compared to wild-type. Interestingly, we detected lower levels of glycine and cysteine (but not other amino acids, Fig EV4F) in BNip3 null tumor cells compared to wild-type (Fig6D). Glycine and cysteine are both used to synthesize glutathione, and their selective depletion is consistent with increased glutathione synthesis to meet increased demand for reducing capacity due to elevated ROS in BNip3 null tumor cells.
Figure 6.

Increased ROS production drives HIF stabilization and tumor progression in BNip3 null tumors
- Staining of frozen sections of wild-type and BNip3 null tumors at d35 for dihydroethidine (n = 4 for each genotype) and of FFPE sections for 8-hydroxyguanine (8-OHdG) at d80 (n = 4 for each genotype). Scale bar is 50 μm.
- Quantification of staining for DHE and 8-OHdG presented in (A).
- Flow cytometric analysis of mitochondrial ROS using MitoSOX fluorescent probe (n = 4 for each genotype).
- Quantification of total levels of reduced and oxidized glutathione, glycine and cysteine in wild-type and BNip3 null tumor cells (3 biological replicates and 3 experimental replicates).
- Effect of BHA diet supplementation on MMTV-PyMT tumor volume in wild-type (n = 12) and BNip3 null (n = 19) mice.
- Immunohistochemical staining for Ki67 on wild-type and BNip3 null tumors at d80 having been fed regular chow or BHA-supplemented chow from d65 (n = 4 for each genotype and treatment).
- Immunohistochemical staining for Hif-1α on BNip3 null tumors at d80 having been fed regular chow or BHA-supplemented chow from d65 (n = 4 for each treatment). Scale bar is 100 μm.
- qPCR for expression of key Hif target genes and other growth-related genes in tumors from wild-type and BNip3 null mice at d80 having been fed regular chow or BHA-supplemented chow from d65 (performed in triplicate).
Data information: Results are expressed as the mean ± SEM. *P < 0.05, **P < 0.01, ***P < 0.001, ****P < 0.0001.
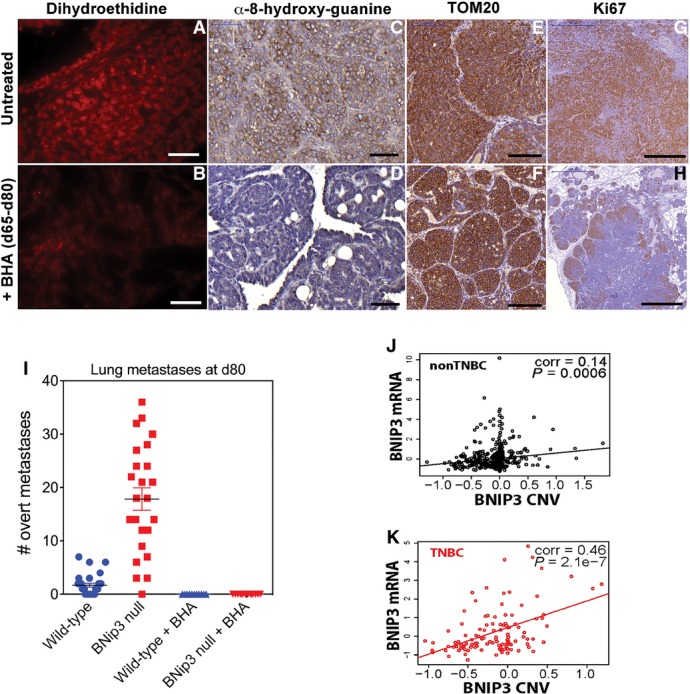
The early detection of elevated ROS in situ in BNip3 null tumors combined with perturbation of glutathione metabolism and redox state suggested to us that increased ROS production by BNip3 null mitochondria was playing a role in stabilizing Hif-1α and promoting tumor progression. To assess this, we placed wild-type and BNip3 null mice on a diet supplemented with the anti-oxidant, butylated hydroxyanisole (BHA), as described previously 32. We started mice on the BHA-supplemented diet at d65 (after tumor initiation but prior to metastasis detection) and then monitored the effect of BHA on tumor growth and progression. When we harvested tumors from wild-type and BNip3 null mice at d80 (15 days after commencing BHA-supplemented chow), we observed that BHA consumption by BNip3 null mice markedly reduced primary tumor growth between d65 and d80 (Fig6E) but had no significant effect on the growth of wild-type tumors. Tumor volume at d80 in BNip3 null mice fed BHA diet was now similar to that observed in wild-type mice, either with or without BHA diet (Fig6E). Importantly, we showed that while the BHA diet did not reduce mitochondrial content (as determined by TOM20 staining) in BNip3 null tumors (Fig EV5F) compared to untreated BNip3 null tumors (Fig EV5E), it did effectively reduce ROS levels indicated by reduced DHE and 8-OHdG staining in situ in BHA fed BNip3 null tumors (Fig EV5B and D) compared to controls (Fig EV5A and C). Consistent with decreased tumor growth, we observed that BHA treatment reduced Ki67 staining in BNip3 null tumors compared to untreated BNip3 null tumors (Figs6F and EV5H). Furthermore, BHA-supplemented diet retarded metastasis to the lungs in MMTV-PyMT;BNip3−/− mice such that at d80, we were unable to detect any lung metastases in BHA-treated mice, either wild-type or BNip3 null (Fig EV5I). This contrasts markedly with untreated MMTV-PyMT;BNip3−/− mice in which numerous lung metastases were detectable at d80 (Figs2P and EV5I).
Additional controls and effects of quenching ROS for tumorigenesis
- A, B Staining with dihydroethidine for superoxide levels in situ on BNip3 null tumor sections at d80 following supplementation of mouse diet with BHA (B) or not (A). Scale bars are 50 μm.
- C, D Immunohistochemical staining for 8-hydroxyguanine to assess effects of BHA diet (D) on levels of ROS in tumors from BNip3 null mice compared to untreated BNip3 null mice (C). Scale bars are 50 μm.
- E, F Immunohistochemical staining for TOM20 to assess effects of BHA diet (F) on mitochondrial mass in tumors from BNip3 null mice compared to untreated BNip3 null mice (E). Scale bars are 100 μm.
- G, H Immunohistochemical staining for Ki67 to assess the effects of BHA diet (H) on tumor cell proliferation in tumors from BNip3 null mice compared to untreated BNip3 null mice (G). Scale bars are 500 μm.
- I Metastasis numbers in serial sections of lungs from wild-type or BNip3 null mice sacrificed at d80 either untreated or treated with BHA diet from d65–d80. Wild-type/UT, n = 21; BNip3 null/UT, n = 24; Wild-type/BHA, n = 11; BNip3 null/BHA, n = 14.
- J RNAseq-derived mRNA expression levels of BNip3 correlated with chromosomal copy number variation of BNip3 in non-TNBC samples of TCGA breast cancer cohort (n = 576).
- K RNAseq-derived mRNA expression levels of BNip3 in TNBC correlated with chromosomal copy number variation of BNip3 in TNBC samples of the TCGA breast cancer cohort (n = 113).
Significantly, BHA treatment markedly reduced levels of Hif-1α detected in BNip3 null tumors compared to that observed in BNip3 null tumors from untreated mice (Fig6G). Furthermore, expression of HIF target genes involved in glycolysis and angiogenesis was significantly reduced in tumors from BHA-treated BNip3 null mice compared to tumors in untreated BNip3 null mice (Fig6H). The effect of BHA on HIF target gene expression was only seen in BNip3 null mice (Fig6H), and BHA had little or no effect on Hif target gene expression in wild-type tumors (Fig6H), consistent with the limited effect of BHA on growth of wild-type tumors compared to BNip3 null tumors (Fig6E).
Our findings indicate that elevated ROS production associated with mitochondrial dysfunction contributes significantly to increased Hif-1α levels and to increased growth and progression of BNip3 null tumors forming in MMTV-PyMT mice compared to similarly treated wild-type mice.
BNip3 null tumor cells are more dependent on autophagy for survival than wild-type tumor cells
Given the minimal differences in cell viability detected between wild-type and BNip3 null tumor cells (Fig EV2), we were curious to test whether the viability of BNip3 null tumor cells was being maintained by their elevated rates of glycolysis, particularly in light of reduced mitochondrial function. Treatment of BNip3 null MECs with 5 mM 2-deoxyglucose (2DG) to inhibit glycolysis markedly reduced their growth in vitro (Fig7A), but this effect of 2DG could not be attributed to increased cell death that was only marginally increased by 2DG treatment (Fig7B).
Figure 7.

Loss of BNip3 induces increased dependence on autophagy for survival
- A Effect of inhibiting glycolysis with 2-deoxyglucose for the growth rate of wild-type and BNip3 null MECs grown at 20% oxygen (performed in triplicate).
- B Measurement of cell death measured by flow cytometric quantification of propidium iodide uptake in the presence or absence of 2-deoxyglucose.
- C–H Immunohistochemical staining for LC3B (C–F) and p62/sqstm1 (G, H) on sections of wild-type (C, E, G; n = 4) and BNip3 null (D, F, H; n = 4) tumors at d80. Black scale bar is 50 μm. Red cut-out box in (C) and (D) is presented in (E) and (F), respectively.
- I Western blot analysis of levels of BNip3, processed LC3B, p62/Sqstm1 and β-actin (loading control) in the presence or absence of 2-deoxyglucose or bafilomycin A1. Band intensity was calculated using ImageJ and standardized to the intensity of the loading control (β-actin). Fold change was determined relative to wild-type values in lane 1 for each protein measured.
- J Measurement of cell death analyzed by flow cytometric quantification of propidium iodide uptake in the presence or absence of bafilomycin A1, hydroxychloroquine and/or 2-deoxyglucose, performed in duplicate experiments.
Data information: Results are expressed as the mean ± SEM. *P < 0.05, ***P < 0.001.
Several reports in the literature have indicated a key role for macro-autophagy in tumor cell growth and survival under conditions of nutrient deprivation 9, 10, and thus, we tested whether BNip3 null tumor cells were reliant on autophagy for survival to compensate for defects in mitochondrial metabolism, particularly when glycolysis was inhibited. When we examined the expression of processed LC3B in situ by immunohistochemistry in MMTV-PyMT tumors from either wild-type or BNip3 null tumors at d80, we observed equivalent punctate LC3B staining in both wild-type (Fig7C and E) and BNip3 null tumors (Fig7D and F). Expression of the p62/Sqstm1 autophagy cargo receptor, levels of which are modulated by rates of autophagy, was also similar between wild-type (Fig7G) and BNip3 null (Fig7H) tumors indicating that autophagy was as effective in the absence of BNip3 as in wild-type tumors. Western blot analysis of extracts from MMTV-PyMT MECs of both genotypes also confirmed that both wild-type and BNip3 null MECs underwent effective autophagic flux, as determined by similarly increased levels of processed LC3-II and p62/Sqstm1 in response to bafilomycin A1 treatment (Fig7I, lanes 3 and 7) compared to untreated cells (Fig7I, lane 1). These results indicate that although mitophagy is defective in BNip3 null MECs, there is not a generic defect in macro-autophagy and autophagic flux is similarly effective in BNip3 null tumors to that detected in wild-type tumors. We also observed an increase in the levels of BNip3 in wild-type MECs in response to bafilomycin A1 (Fig7I, lane 3 compared to lane 1) consistent with BNip3 being turned over by autophagy along with the mitochondria that are being targeted for degradation.
Interestingly, treatment of cells with 2DG also resulted in increased BNip3 levels in wild-type MECs (Fig7I, lane 2 compared to lane 1) similar to that seen with bafilomycin A1 (Fig7I, lane 3). However, 2DG did not cause accumulation of processed LC3 to the same extent as bafilomycin A1 in either wild-type or BNip3 null MECs (Fig7I, lanes 2 and 6 compared to 3 and 7), suggesting that 2DG is not modulating BNip3 levels in wild-type MECs through effects on autophagic flux. Treatment of cells with 2DG also increased p62 accumulation in both wild-type and BNip3 null MECs (Fig7I, lanes 2 and 6 compared to lanes 1 and 5) in a manner that was additive with the effects of bafilomycin (Fig7I, lanes 4 and 8 compared to lanes 3 and 7). This suggests that 2DG treatment is increasing p62/Sqstm1 levels through signaling pathways not affected by bafilomycin A1 and inhibition of autophagic flux.
Since defects in mitophagy are genetically epistatic to defects in autophagy, we induced acute inhibition of autophagy by employing chemical inhibitors of autophagy to examine the extent to which mitophagy-defective cells rely on other aspects of autophagy for survival. We observed that BNip3 null tumor cells were markedly more sensitive to acute autophagy inhibition compared to wild-type tumor cells after treatment with either bafilomycin A1 or hydroxychloroquine for 4 h, with BNip3 null tumor cells showing a much greater drop in viability (Fig7J). The combined treatment of cells with 2DG and either bafilomycin A1 or hydroxychloroquine did not significantly increase the levels of cell death over that seen with either bafilomycin A1 or hydroxychloroquine alone, indicating that autophagy supports cell survival in BNip3 null tumor cells even when glycolysis is active and suggesting that the key role of glycolysis is to support increased cell growth. These results indicate that BNip3 null tumor cells rely on macro-autophagy to a greater extent than wild-type cells for survival possibly to provide metabolites, such as amino acids, in the absence of effective mitochondrial metabolism.
BNIP3 is deleted in triple-negative breast cancer and predicts poor prognosis
BNIP3 has been shown to be up-regulated in ductal carcinoma in situ (DCIS) in human breast cancer 33, 34, while loss of BNIP3 expression at both the RNA and protein level in progression to invasive ductal carcinoma (IDC) of the breast was associated with increased proliferative index and lymph node metastases 35, 36. In other cancers, including hematological malignancies, lung, gastric, liver, pancreatic and liver cancer, epigenetic silencing of BNIP3 expression as tumors progress to invasion and metastasis has been reported 37, 38, 39, 40. In pancreatic cancer in particular, inactivation of BNIP3 was associated with chemoresistance and poor prognosis 37, 41, 42. However, epigenetic silencing is not the likely mechanism of BNIP3 inactivation in human breast cancer 43.
To gain a better understanding of how BNIP3 is deregulated in human breast cancer and to assess the extent to which BNIP3 expression can be used to stratify breast cancer patient disease outcome, we interrogated The Cancer Genome Atlas (TCGA) database for both BNIP3 copy number variation (CNV) and expression levels in human breast cancer (Fig8A). Our data reveals that BNIP3 shows a highly significant increase in copy number loss in triple-negative breast cancer (TNBC, P = 5.5e-5) but not in non-TNBCs (Fig8A and B). While altered BNIP3 expression was observed in hormone receptor-positive breast cancers (Fig EV5J), the association with CNV was slight (P = 0.006, corr = 0.14, n = 576), in contrast to TNBC (Fig EV5K) where BNIP3 expression changes correlated tightly with CNV (P = 2.1e-7, corr = 0.46, n = 113). Interestingly, our interrogation of Tumorscape™ database 44 also showed significant deletion around the BNIP3 locus at 10q26.3 in 7 out of 14 human tumor types, including breast cancer.
Figure 8.

BNIP3 is deleted in human triple-negative breast cancer and predicts reduced metastasis-free survival
- Hormone receptor status (red = positive, black = negative) and chromosomal copy number variation (CNV, as defined by the GISTIC algorithm) of BNip3 (red = gain greater than or equal to 1, blue = loss less than or equal to −1, white = unchanged) from n = 689 patient samples in The Cancer Genome Atlas (TCGA) breast cohort where status is unambiguously assigned for all three hormone receptors and copy number data are available and assigned by the GISTIC algorithm.
- Relative frequency of copy number variation (CNV) of BNip3 in triple-negative breast cancer (TNBC; red, n = 113) and non-TNBC (black, n = 576) in TCGA breast cohort.
- TNBC patient metastasis-free survival in low-BNip3-expressing patients (below median, n = 51) stratified by high (above median) and low (below median) expressing Hif-1α.
- TNBC patient metastasis-free survival in high-BNip3-expressing patients (above median, n = 50) stratified by high (above median) and low (below median) expressing Hif-1α.
- Schematic summary of the role of BNIP3 in suppressing tumor progression and metastasis.
Given our data here showing that loss of BNIP3 promoted increased HIF-1α levels and tumor progression to invasiveness and metastasis in a mouse model of breast cancer and further that increased HIF-1α levels are correlated with poor prognosis and increased metastasis in human breast cancer 45, 46, we examined the clinical significance of reduced BNIP3 expression in TNBC tumors. Our analysis shows that low BNIP3 expression in the context of high HIF-1α expression further stratifies metastasis-free survival in TNBC patients in a significant manner (MFS; P = 0.033, n = 51) (Fig8C). In contrast, high BNIP3 expression in TNBC did not confer prognostic value with respect to MFS even when HIF-1α was highly expressed (Fig8D). These data indicate that the combination of low BNIP3 and high HIF-1α levels together provides a much stronger prognostic indicator that TNBC breast cancers will progress to metastasis than examination of HIF-1α levels alone.
Discussion
Mitochondrial dysfunction was proposed by Warburg to explain increased aerobic glycolysis in tumors 24. While deregulated expression of key glycolytic enzymes can also promote the Warburg effect, our work reveals that defective mitochondria arising when BNip3-dependent mitophagy is inhibited induce a reliance on glycolysis for growth and autophagy for survival. We show that defective mitophagy leads to increased mitochondrial ROS and activation of oncogenic Hif-1 activity (Fig8E). Deletion of BNIP3 was most commonly found in TNBC in humans, which, together with high HIF-1α levels, strongly predicted progression to metastasis, and interestingly, the Warburg Effect is a common feature of most TNBCs 47. These results not only have significance for our understanding of mitochondrial dysfunction in cancer but also suggest better approaches to stratifying TNBC for treatment.
Mitochondrial ROS are produced at the mitochondria if electrons escape the electron transport chain and react with molecular oxygen, and this happens at measurable levels in actively respiring cells 31, 48. Increased mitochondrial ROS can arise for numerous reasons including low oxygen (no acceptor for electrons), respiratory chain inhibition (e.g., with complex III inhibitor, antimycin A) or indeed due to other defects in mitochondrial function that lead to a block to electron transport and their escape to either the mitochondrial matrix (if they emanate from complex I or II) or the intermembrane space (if from complex III) 48. Mitochondrial ROS is required for K-Ras-driven lung tumorigenesis through ROS-driven elevation of MAPK activity and increased proliferation 49. Other activities of ROS in tumorigenesis have also been reported 31, 50. In particular, ROS has been linked to increased metastasis as a result of oxidative base damage causing mitochondrial genome mutations that limit respiration 51. Here, we show that increased ROS led to increased Hif-1α protein levels and increased Hif target gene expression and indeed Hif-1α is required for efficient tumor growth and metastasis in the MMTV-PyMT model 23. The novel negative feedback loop reported here shows that inactivation of BNip3 uncouples Hif-1 activity from the negative growth effects of BNip3-dependent mitophagy leading to accelerated tumor progression to metastasis (Fig8E).
Recent work has indicated that inhibition of autophagy promotes early growth of tumors but that autophagy is required for tumor progression and metastasis 9, 10. Defective mitochondria present in autophagy-deficient tumors exhibited altered morphology, reduced carbon flux through the TCA cycle and lipid accumulation suggesting that autophagy-deficient tumors failed to progress due to defective mitochondrial metabolism. However, our data show that dysfunctional mitochondria arising from a specific mitophagy defect do not result in the same phenotypic block to tumor progression as seen with inhibition of autophagy as a whole. We observe the opposite effect; defective mitochondria lead to increased invasiveness and metastasis. Furthermore, we did not observe p62/Sqstm1 accumulation since autophagy was functional in BNip3 null mitophagy-deficient tumors. Clearly, other important features of global autophagy inhibition, such as reduced amino acid recycling from the lysosome 52, may contribute significantly to the block to tumor progression observed in autophagy-deficient tumor models. Also, it is possible that while mitophagy is reduced in BNip3 null tumors, it is not completely inhibited and that other mitophagy regulators, such as NIX or Parkin 53, 54, partially compensate for BNIP3 loss. We detected elevated expression of Nix in BNip3 null MECs (Fig3F) possibly reflective of increased mitochondrial mass and of increased hypoxia in BNip3 null tumors (Nix is also a HIF target), but this is apparently not sufficient to fully compensate for loss of BNip3 growth-suppressive functions.
Of all the human breast cancer subtypes analyzed, our work shows that BNIP3 deletion was most commonly found in triple-negative breast cancer (TNBC). Why loss of BNIP3 is so strongly selected for in TNBC is not clear at this time and analysis of mitochondrial function in TNBC is warranted. Elevated HIF-1α levels were strongly linked to high metastasis rates in TNBC in previous studies 55, but our data show that the combined score of low BNIP3 and high HIF-1α predicts significantly lower rates of metastasis-free survival in TNBC, than high HIF-1α alone. Together with our data showing increased dependence of BNip3 null tumor cells on autophagy for survival, our findings may support the use of autophagy inhibitors to reduce metastasis in TNBC. Autophagy inhibitors have been previously suggested for STAT3-expressing subtypes of breast cancer including TNBC 56, and it will be interesting to determine whether BNIP3 is selectively lost in STAT3-positive TNBC.
In summary, we propose that BNIP3 acts as a brake on HIF-1 activity serving to increase rates of mitophagy in response to hypoxia and thereby to limit production of damaging ROS that would further amplify HIF-1 expression and promote tumor progression to metastasis.
Materials and Methods
Mice
MMTV-PyMT mice (Jackson Laboratories) were bred to BNip3 null mice 57 to generate compound MMTV-PyMT;BNip3+/+ or MMTV-PyMT;BNip3−/− mice on a > 99% pure FVB/N background. Tumor studies were performed on virgin female progeny. For orthotopic transplant studies, 1.3 × 10⁵ primary tumor cells were injected into the mammary fat pad of 10-week-old syngeneic FVB/N female mice. Indicated cohorts of mice were fed 7 mg/kg butylated hydroxyanisole provided through custom chow (Harlan-Teklad, TD-110712).
Cells and tissue culture
Primary MECs from tumors forming in MMTV-PyMT mice were prepared as described previously 21. Cells were grown in 5% defined fetal bovine serum, 10 ng/ml epidermal growth factor (Sigma), 5 μg/ml insulin, 0.5 μg/ml hydrocortisone and 10 μg/ml gentamycin in DMEM/F12 media (Invitrogen). Three-dimensional culture experiments were performed in Matrigel as described previously 21. Lentivirus (pGIII-CMV-GFP-2A-Puro) expressing mouse BNip3 (cat# LV534527) was purchased from Applied Biological Materials and used to stably infect BNip3 null MECs using standard protocols. Echinomycin was obtained from Enzo Life Sciences (cat# ALX-380-201) and added to cell culture at a final concentration of 10 ng/ml. For migration assays, 5 × 10⁴ cells per well in serum-free medium were seeded into 24-well 8-μm pore cell culture inserts (BD) in triplicate. For invasion assays, inserts were pre-coated with collagen I (BD) and 5 × 10⁴ cells were seeded per well. Complete medium (+ EGF) was added to the outside of the insert, and plates were incubated at 37°C for 24 h. Fixed and Giemsa-stained cells on recovered inserts were quantified in five 20× fields.
Histology and immunohistochemistry
Ki67 (Labvision #RM-9106), BNIP3 (Sigma #HPA003015), Vdac1 (BioVision #3594-100), CoxIV (Cell Signaling #4844), ER-α (Santa Cruz sc-542), TOM20 (Santa Cruz sc-11415), Hif-1α (Abcam ab2185), laminin-α1 (Abcam ab11575), CD31 (Santa Cruz sc-1506), α-SMA (Abcam ab5694), LC3B (Nanotools 0231-100/LC3-5F10) and 8-hydroxy-guanine (Santa Cruz sc-66036) were detected in situ using specific antibodies and standard immunohistochemical approaches. Stained sections were digitized using a ScanScope XT automated slide scanning system (Aperio) and quantified using the Spectrum Plus image analysis software (Aperio).
Western blot analyses
Primary antibodies to BNip3 (Cell Signaling #3769), Hif-1α (Abcam ab2185), Vdac1 (BioVision #3594-100), Cox IV (Cell Signaling #4844), LC3B (Novus NB600-1384), p62/Sqstm1 (Progen CP-62C) and β-actin (Sigma A1978) were used with appropriate secondary antibodies for detection by enhanced chemiluminescence (ECL film; GE Healthcare). For LC3 Western blots, cells were lysed in an NP-40 buffer (150 mM NaCl, 50 mM Tris–HCl pH 7.5, 1 mM EDTA, 1% NP-40). All other extractions were performed in RIPA buffer. All densitometry was performed on scanned images of films using the gel analysis tool in ImageJ.
Immunofluorescence
Immunofluorescence staining for mitophagy was performed on cells fixed in 4% paraformaldehyde, permeabilized in 100% methanol at −20°C, blocked in 2% FBS/1% goat serum/PBS and incubated 1:200 with anti-LC3B (Cell Signaling #2775) and 1:500 with anti-cyclophilin D (MitoSciences MSA04) at 4°C overnight. Cells were imaged using an Olympus DSU spinning disk confocal microscope (Olympus Corporation of the Americas, Center Valley, PA) with a Hamamatsu model C9100 EM-CCD camera (Hamamatsu Photonics, Skokie, IL, USA) run by SlideBook v5.0 software (Intelligent Imaging Innovations, Denver, CO). Image deconvolution was performed with Openlab software (PerkinElmer) and all other image analysis with ImageJ software (NIH).
Magnetic resonance imaging (MRI)/micro-PET/CT imaging
MRI experiments were performed in a 9.4T Bruker (Billerica, MA) small animal scanner with 11.6-cm inner diameter, actively shielded gradient coils (maximum constant gradient strength for all axes: 230 mT/m). Whole-body scanning was performed to study all of the mammary glands. Two interleaved sets of axial high-resolution multi-slice RARE (rapid acquisition with relaxation enhancement) spin echo T2-weighted (T2W) images were acquired (TR/TEeffective = 4,000/20.3 ms, FOV = 25.6 mm, matrix size = 2,562, slice thickness = 0.5 mm, slice gap = 1 mm, number of slices = 41, NEX = 2, RARE factor = 4) with fat suppression and respiratory gating. Micro-PET/CT imaging was performed using a FLEX Triumph™ micro-PET/SPECT/CT system (Trifoil Imaging, Northridge, CA). Animals were fasted overnight and 100 μCi of 18F-FDG was injected into the tail vein. Micro-CT images for anatomical reference were first acquired (60 kV, 140 μΑ), and micro-PET acquisition was started 30 min after 18F-FDG administration. A static acquisition was performed for 30 min.
Quantitative PCR
Total genomic DNA was isolated from cultured MECs using standard approaches. Relative mitochondrial to nuclear genome ratios were determined using TaqMan real-time PCR primers specific to mitochondrial genome-encoded NADH dehydrogenase subunit 1 (Nd1) and cytochrome b (cytb) and to nuclear genome-encoded β-globin. Total RNA was extracted using TRIzol reagent (Invitrogen). cDNA synthesis from total RNA was performed using the High Capacity RNA-to-cDNA master mix (Applied Biosystems). mRNA levels were quantified by real-time PCR using TaqMan primers, and all samples were analyzed in triplicate. Relative quantification of RNA amount was determined using the comparative Ct method. Relative amounts of mRNA for genes analyzed were normalized to endogenous control β-actin and expressed relative to wild-type (reference sample).
Measurements of OCR
Seahorse Bioscience models XF24 and XF96 were used to measure the rate of change of dissolved O2 (OCR) in DMEM buffered to pH 7.35 with 0.1 N HCl and 0.1 N NaOH. Primary mammary epithelial tumor cells were plated in customized 24-well or 96-well plates, and oxygen consumption was measured using 1 μM oligomycin (port A), 1 μM FCCP (port B) and 5 μM antimycin A (port C). OCR was standardized for total protein concentration after the assay was completed.
Metabolomics analyses
Measurement of total metabolite levels and levels of 13C-labeled metabolites recovered after 6 h of culture in [U-13C]-glucose or [U-13C]-glutamine was performed by LC-MS as described previously 58. Lactate was quantified from cells grown in 13C2-glucose-labeled media by 13C edited 1H NMR spectra. All NMR spectra were acquired on a Bruker AVANCE III HD NMR spectrometer operating at 600.13 MHz 1H and 150.9 MHz 13C. A total of 2k complex points were acquired over a sweep width of 10 ppm with 13C decoupling for an acquisition time of 341 ms.
Flow cytometry
Cell viability was quantified by exclusion of propidium iodide, as previously described 3. TMRE and MitoSOX (Invitrogen T-669 and M36008) were used to measure mitochondrial membrane potential and mitochondrial superoxide anion levels in cells, respectively. FlowJo software was used for data analysis.
Statistics
Results are expressed as the mean ± SEM. Data were analyzed using GraphPad Prism. Significance was determined by unpaired Student’s t-test for 2 group comparisons and one-way ANOVA for > 2 group comparisons. A Tukey’s post hoc test was used to identify significant pairwise differences when a one-way ANOVA identified a significant difference between means. *P < 0.05, **P < 0.01, ***P < 0.001, ****P < 0.0001.
The Cancer Genome Atlas and other human data
All analyses were performed in R v.3.0.1. TCGA BNIP3 data for RNAseq mRNA estimates, and CNV was extracted using the ‘cgdsr’ package. Clinical annotation of TCGA data was downloaded separately from http://gdac.broadinstitute.org and matched to the data in the ‘cgdsr’ package using R code. Enrichment of copy number loss was identified using a Fisher exact test comparing counts of CNV < 0 in TNBC and non-TNBC samples. Stratification of metastasis-free survival (MFS) was tested in expression array data from 101 breast tumor samples identified as TNBC out of a total of 871 samples in a combined cohort consisting of publicly available data sets reposited in Gene Expression Omnibus (GEO) 59. Significant differences in MFS were determined using the log-rank test.
Acknowledgments
This work was supported by funding from NIH RO1 CA131188 (KFM), NIH RO1 CA162405 (KFM), NIH T32 CA009594 (AHC, KT), T32 DK780073 (MLB), the University of Chicago Medical Scientist Training Program (MNS), NIH RO1 CA133490 (GK) and by the Human Tissue Resource Center, Digital Light Microscopy, Flow Cytometry and the Small Animal Imaging Core Facilities through the University of Chicago Cancer Center Support Grant (P30 CA014599).
Author contributions
AHC performed all in vitro work with MECs and immunohistochemical analyses of tumors; KT performed initial mouse crosses and early-stage primary tumor and lung metastasis analyses; CF performed TCGA analyses; MLB carried out 14C-glucose experiments and qPCR; MNS performed in vitro migration/invasion assays; LED performed immunohistochemistry for LC3 and p62/Sqstm1; JRS performed NMR analyses; JMA performed all 13C-glucose/glutamine metabolomic analyses; JWL advised on aspects of interpretation of metabolomic data; GSK contributed MRI images; and KFM conceived of the project, prepared figures and wrote the initial draft of the manuscript. All authors reviewed and edited the manuscript and figures prior to submission.
Conflict of interest
The authors declare that they have no conflict of interest.
Supporting Information
Expanded View Figures PDF
Review Process File
References
- Youle RJ, Narendra DP. Mechanisms of Mitophagy. Nat Rev Mol Biol. 2011;12:9–14. doi: 10.1038/nrm3028. [DOI] [PMC free article] [PubMed] [Google Scholar]
- Green DR, Levine B. To be or not to be? How selective autophagy and cell death govern cell fate. Cell. 2014;157:65–75. doi: 10.1016/j.cell.2014.02.049. [DOI] [PMC free article] [PubMed] [Google Scholar]
- Tracy K, Dibling BC, Spike BT, Knabb JR, Schumacker P, Macleod KF. BNIP3 is a RB/E2F target gene required for hypoxia-induced autophagy. Mol Cell Biol. 2007;27:6229–6242. doi: 10.1128/MCB.02246-06. [DOI] [PMC free article] [PubMed] [Google Scholar]
- Egan DF, Shackelford DB, Mihaylova MM, Gelino S, Kohnz RA, Mair W, Vasquez DS, Joshi A, Gwinn DM, Taylor RC, et al. Phosphorylation of ULK1 (hATG1) by AMP-activated protein kinase connects energy sensing to mitophagy. Science. 2011;331:456–461. doi: 10.1126/science.1196371. [DOI] [PMC free article] [PubMed] [Google Scholar]
- Shackelford DB, Abt E, Gerken L, Vasquez DS, Seki A, Leblanc M, Wei L, Fishbein MC, Czernin J, Mischel PS, et al. LKB1 inactivation dictates therapeutic response of non-small cell lung cancer to the metabolism drug phenformin. Cancer Cell. 2013;23:143–158. doi: 10.1016/j.ccr.2012.12.008. [DOI] [PMC free article] [PubMed] [Google Scholar]
- Viale A, Pettazzoni P, Lyssiotis CA, Ying H, Sánchez N, Marchesini M, Carugo A, Green T, Seth S, Giuliani V, et al. Oncogene ablation-resistant pancreatic cancer cells depend on mitochondrial function. Nature. 2014;514:628–632. doi: 10.1038/nature13611. [DOI] [PMC free article] [PubMed] [Google Scholar]
- Birsoy K, Possemato R, Lorbeer FK, Bayraktar EC, Thiru P, Yucel B, Wang TC, Chen WW, Clish CB, Sabatini DM. Metabolic determinants of cancer cell sensitivity to glucose limitation and biguanides. Nature. 2014;508:108–112. doi: 10.1038/nature13110. [DOI] [PMC free article] [PubMed] [Google Scholar]
- Yang S, Wang X, Contino G, Liesa M, Sahin E, Ying H, Bause A, Li Y, Stommel JM, Dell’ Antonio G, et al. Pancreatic cancers require autophagy for tumor growth. Genes Dev. 2011;25:717–729. doi: 10.1101/gad.2016111. [DOI] [PMC free article] [PubMed] [Google Scholar]
- Guo JY, Karsli-Uzunbas G, Mathew R, Aisner SC, Kamphorst JJ, Strohecker AM, Chen G, Price S, Lu W, Teng X, et al. Autophagy suppresses progression of K-ras-induced lung tumors to oncocytomas and maintains lipid homeostasis. Genes Dev. 2013;27:1447–1461. doi: 10.1101/gad.219642.113. [DOI] [PMC free article] [PubMed] [Google Scholar]
- Rosenfeldt MT, O’Prey J, Morton JP, Nixon C, MacKay G, Mrowinska A, Au A, Rai TS, Zheng L, Ridgway R, et al. p53 status determines the role of autophagy in pancreatic tumour development. Nature. 2013;504:296–300. doi: 10.1038/nature12865. [DOI] [PubMed] [Google Scholar]
- Guo K, Searfoss G, Krolikowski D, Pagnoni M, Franks C, Clark K, Yu KT, Jaye M, Ivashchenko Y. Hypoxia induces the expression of the pro-apoptotic gene BNIP3. Cell Death Diff. 2001;8:367–376. doi: 10.1038/sj.cdd.4400810. [DOI] [PubMed] [Google Scholar]
- Kasper LH, Boussouar F, Boyd K, Xu W, Biesen M, Rehg J, Baudino T, Cleveland JL, Brindle PK. Two transcriptional mechanisms cooperate for the bulk of HIF-1-responsive gene expression. EMBO J. 2005;24:3846–3858. doi: 10.1038/sj.emboj.7600846. [DOI] [PMC free article] [PubMed] [Google Scholar]
- Vande Velde C, Cizeau J, Dubik D, Alimonti J, Brown T, Israels S, Hakem R, Greenberg AH. BNIP3 and genetic control of necrosis-like cell death through the mitochondrial permeability transition pore. Mol Cell Biol. 2000;20:5454–5468. doi: 10.1128/mcb.20.15.5454-5468.2000. [DOI] [PMC free article] [PubMed] [Google Scholar]
- Hardwick JM, Youle RJ. Snapshot: Bcl2 proteins. Cell. 2009;23:404. doi: 10.1016/j.cell.2009.07.003. [DOI] [PMC free article] [PubMed] [Google Scholar]
- Glick D, Zhang W, Beaton M, Marsboom G, Gruber M, Simon MC, Hart J, Dorn GW, II, Brady MJ, Macleod KF. BNip3 regulates mitochondrial function and lipid metabolism in the liver. Mol Cell Biol. 2012;32:2570–2584. doi: 10.1128/MCB.00167-12. [DOI] [PMC free article] [PubMed] [Google Scholar]
- Zhang H, Bosch-Marce M, Shimoda LA, Tan YS, Baek JH, Wesley JB, Gonzalez FJ, Semenza G. Mitochondrial autophagy is a HIF-1 dependent adaptive metabolic response to hypoxia. J Biol Chem. 2008;283:10892–10903. doi: 10.1074/jbc.M800102200. [DOI] [PMC free article] [PubMed] [Google Scholar] [Retracted]
- Hanna RA, Quinsay MN, Orogo AM, Giang K, Rikka S, Gustafsson AB. Microtubule-associated protein 1 light chain 3 (LC3) interacts with BNip3 protein to selectively remove endoplasmic reticulum and mitochondria via autophagy. J Biol Chem. 2012;287:19094–19104. doi: 10.1074/jbc.M111.322933. [DOI] [PMC free article] [PubMed] [Google Scholar]
- Erler JT, Bennewith KL, Nicolau M, Dornhofer N, Kong C, Le QT, Chi JT, Jeffrey SS, Giaccia AJ. Lysyl oxidase is essential for hypoxia-induced metastasis. Nature. 2006;440:1222–1226. doi: 10.1038/nature04695. [DOI] [PubMed] [Google Scholar]
- Wong CC, Gilkes DM, Zhang H, Chen J, Wei H, Chaturvedi P, Fraley SI, Wong CM, Khoo US, Ng IO, et al. Hypoxia-inducible factor 1 is a master regulator of breast cancer metastatic niche formation. Proc Natl Acad Sci USA. 2011;108:16369–16374. doi: 10.1073/pnas.1113483108. [DOI] [PMC free article] [PubMed] [Google Scholar]
- Lin EY, Jones JG, Li P, Zhu L, Whitney KD, Muller WJ, Pollard JW. Progression to Malignancy in the Polyoma Middle T oncoprotein mouse breast cancer model provides a reliable model for human diseases. Am J Path. 2003;163:2113–2126. doi: 10.1016/S0002-9440(10)63568-7. [DOI] [PMC free article] [PubMed] [Google Scholar]
- DeNardo DG, Barreto JB, Andreu P, Vasquez L, Tawfik D, Kolhatkar N, Coussens LM. CD4(+) T cells regulate pulmonary metastasis of mammary carcinomas by enhancing protumor properties of macrophages. Cancer Cell. 2009;16:91–102. doi: 10.1016/j.ccr.2009.06.018. [DOI] [PMC free article] [PubMed] [Google Scholar]
- Wei H, Wei S, Gan B, Peng X, Zou W, Guan JL. Suppression of autophagy by FIP200 deletion inhibits mammary tumorigenesis. Genes Dev. 2011;25:1510–1527. doi: 10.1101/gad.2051011. [DOI] [PMC free article] [PubMed] [Google Scholar]
- Liao D, Corle C, Seagroves TN, Johnson RS. Hypoxia-inducible factor-1a is a key regulator of metastasis in a transgenic model of cancer initiation and progression. Cancer Res. 2007;67:563–572. doi: 10.1158/0008-5472.CAN-06-2701. [DOI] [PubMed] [Google Scholar]
- Koppenol WH, Bounds PL, Dang CV. Otto Warburg’s contributions to current concepts of cancer metabolism. Nat Rev Cancer. 2011;11:325–337. doi: 10.1038/nrc3038. [DOI] [PubMed] [Google Scholar]
- Kong D, Park EJ, Stephen AG, Calvani M, Cardellina JH, Monks A, Fisher RJ, Shoemaker RH, Melillo G. Echinomycin, a small-molecule inhibitor of hypoxia-inducible factor-1 DNA-binding activity. Cancer Res. 2005;65:9047–9055. doi: 10.1158/0008-5472.CAN-05-1235. [DOI] [PubMed] [Google Scholar]
- Semenza G. HIF-1 mediates metabolic responses to intratumoral hypoxia and oncogenic mutations. J Clin Invest. 2013;123:3664–3671. doi: 10.1172/JCI67230. [DOI] [PMC free article] [PubMed] [Google Scholar]
- Chandel NS, McClintock DS, Feliciano CE, Wood TM, Melendez JA, Rodriguez AM, Schumacker PT. Reactive oxygen species generated at mitochondrial complex III stabilize hypoxia-inducible factor-1alpha during hypoxia: a mechanism of O2 sensing. J Biol Chem. 2000;275:25130–25138. doi: 10.1074/jbc.M001914200. [DOI] [PubMed] [Google Scholar]
- Mansfield KD, Guzy RD, Pan Y, Young RM, Cash TP, Schumacker PT, Simon MC. Mitochondrial dysfunction resulting from loss of cytochrome c impairs cellular oxygen sensing and hypoxic HIF-alpha activation. Cell Metab. 2005;1:393–399. doi: 10.1016/j.cmet.2005.05.003. [DOI] [PMC free article] [PubMed] [Google Scholar]
- Brunelle JK, Bell EL, Quesada NM, Vercauteren K, Tiranti V, Zeviani M, Scarpulla RC, Chandel NS. Oxygen sensing requires mitochondrial ROS but not oxidative phosphorylation. Cell Metab. 2005;1:409–414. doi: 10.1016/j.cmet.2005.05.002. [DOI] [PubMed] [Google Scholar]
- Guzy RD, Hoyos B, Robin E, Chen H, Liu L, Mansfield KD, Simon MC, Hammerling U, Schumacker PT. Mitochondrial complex III is required for hypoxia-induced ROS production and cellular oxygen sensing. Cell Metab. 2005;1:401–408. doi: 10.1016/j.cmet.2005.05.001. [DOI] [PubMed] [Google Scholar]
- Sena LA, Chandel NS. Physiological roles of mitochondrial reactive oxygen species. Mol Cell. 2012;48:158–167. doi: 10.1016/j.molcel.2012.09.025. [DOI] [PMC free article] [PubMed] [Google Scholar]
- Sakurai T, He G, Matsuzawa A, Yu GY, Maeda S, Hardiman G, Karin M. Hepatocyte necrosis induced by oxidative stress and IL-1 alpha release mediate carcinogen-induced compensatory proliferation and liver tumorigenesis. Cancer Cell. 2008;14:156–165. doi: 10.1016/j.ccr.2008.06.016. [DOI] [PMC free article] [PubMed] [Google Scholar]
- Sowter HM, Ferguson M, Pym C, Watson P, Fox SB, Han C, Harris AL. Expression of the cell death genes BNip3 and Nix in ductal carcinoma in situ of the breast; correlation of BNip3 levels with necrosis and grade. J Path. 2003;201:573–580. doi: 10.1002/path.1486. [DOI] [PubMed] [Google Scholar]
- Sowter HM, Ratcliffe PJ, Watson P, Greenberg AH, Harris AL. HIF1-dependent regulation of hypoxic induction of the cell death factors BNIP3 and NIX in human tumors. Cancer Res. 2001;61:6669–6673. [PubMed] [Google Scholar]
- Tan EY, Campo L, Han C, Turley H, Pezzella F, Gatter KC, Harris AL, Fox SR. BNIP3 as a progression marker in primary human breast cancer; opposing functions in in situ versus invasive cancer. Clin Cancer Res. 2007;13:467–474. doi: 10.1158/1078-0432.CCR-06-1466. [DOI] [PubMed] [Google Scholar]
- Koop EA, van Laar T, van Wichen DF, Weger RA, van der Wall E, van Diest PJ. Expression of BNIP3 in invasive breast cancer: correlations with the hypoxic response and clinicopathological features. BMC Cancer. 2009;9:175–182. doi: 10.1186/1471-2407-9-175. [DOI] [PMC free article] [PubMed] [Google Scholar]
- Okami J, Simeone DM, Logsdon CD. Silencing of the hypoxia-inducible cell death protein BNIP3 in pancreatic cancer. Cancer Res. 2004;64:5338–5346. doi: 10.1158/0008-5472.CAN-04-0089. [DOI] [PubMed] [Google Scholar]
- Murai M, Toyota M, Satoh A, Suzuki H, Akino K, Mita H, Sasaki Y, Ishida T, Shen L, Garcia-Manero G, et al. Aberrant methylation associated with silencing BNIP3 expression in haematopoietic tumours. Br J Cancer. 2005;92:1165–1172. doi: 10.1038/sj.bjc.6602422. [DOI] [PMC free article] [PubMed] [Google Scholar]
- Murai M, Toyota M, Suzuki H, Satoh A, Sasaki Y, Akino K, Ueno M, Takahashi F, Kusano M, Mita H, et al. Aberrant methylation and silencing of the BNIP3 gene in colorectal and gastric cancer. Clin Cancer Res. 2005;11:1021–1027. [PubMed] [Google Scholar]
- Calvisi DF, Ladu S, Gorden A, Farina M, Lee JS, Conner E, Schroeder I, Factor VM, Thorgeirsson SS. Mechanistic and prognostic significance of aberrant methylation in the molecular pathogenesis of human hepatocellular carcinoma. J Clin Invest. 2007;117:2713–2722. doi: 10.1172/JCI31457. [DOI] [PMC free article] [PubMed] [Google Scholar]
- Erkan M, Kleef J, Esposito I, Giese T, Ketterer K, Buchler MW, Giese NA, Friess H. Loss of BNIP3 expression is a late event in pancreatic cancer contributing to chemoresistance and worsened prognosis. Oncogene. 2005;24:4421–4432. doi: 10.1038/sj.onc.1208642. [DOI] [PubMed] [Google Scholar]
- Akada M, Crnogorac-Jurcevic T, Lattimore S, Mahon P, Lopes R, Sunamura M, Matsuno S, Lemoine NR. Intrinsic chemoresistance to gemcitabine is associated with decreased expression of BNIP3 in pancreatic cancer. Clin Cancer Res. 2005;11:3094–3101. doi: 10.1158/1078-0432.CCR-04-1785. [DOI] [PubMed] [Google Scholar]
- van Diest PJ, Suijkerbuijk KPM, Koop EA, Weger RA, van der Wall E. Low levels of BNIP3 promoter hypermethylation in invasive breast cancer. Anal Cell Pathol. 2010;33:175–176. doi: 10.3233/ACP-CLO-2010-0543. [DOI] [PMC free article] [PubMed] [Google Scholar]
- Beroukhim R, Mermel CH, Porter D, Wei G, Raychaudhuri S, Donovan J, Barretina J, Boehm JS, Dobson J, Urashima M, et al. The landscape of somatic copy-number alteration across human cancers. Nature. 2010;463:899–905. doi: 10.1038/nature08822. [DOI] [PMC free article] [PubMed] [Google Scholar]
- Schindl M, Schoppmann SF, Samonigg H, Hausmaninger H, Kwasny W, Gnant M, Jakesz R, Kubista E, Birner P, Oberhuber G. Overexpression of hypoxia-inducible factor 1alpha is associated with an unfavorable prognosis in lymph node-positive breast cancer. Clin Cancer Res. 2002;8:1831–1837. [PubMed] [Google Scholar]
- Generali D, Berruti A, Brizzi MP, Campo L, Bonardi S, Wigfield S, Bersiga A, Allevi G, Milani M, Aguggini S, et al. Hypoxia-inducible factor-1alpha expression predicts a poor response to primary chemoendocrine therapy and disease-free survival in primary human breast cancer. Clin Cancer Res. 2006;12:4562–4568. doi: 10.1158/1078-0432.CCR-05-2690. [DOI] [PubMed] [Google Scholar]
- Kim S, Kim DH, Jung WH, Koo JS. Metabolic phenotypes in triple-negative breast cancer. Tumour Biol. 2013;34:1699–1712. doi: 10.1007/s13277-013-0707-1. [DOI] [PubMed] [Google Scholar]
- Hamanaka RB, Chandel NS. Mitochondrial reactive oxygen species regulate cellular signaling and dictate biological outcomes. TIBS. 2010;35:505–513. doi: 10.1016/j.tibs.2010.04.002. [DOI] [PMC free article] [PubMed] [Google Scholar]
- Weinberg F, Hamanaka RB, Wheaton WW, Weinberg S, Joseph JW, Lopez M, Kalyanaraman B, Mutlu GM, Budinger GR, Chandel NS. Mitochondrial metabolism and ROS generation are essential for Kras-mediated tumorigenicity. Proc Natl Acad Sci USA. 2010;107:8788–8793. doi: 10.1073/pnas.1003428107. [DOI] [PMC free article] [PubMed] [Google Scholar]
- Holmstrom KM, Finkel T. Cellular mechanisms and physiological consequences of redox-dependent signalling. Nat Rev Mol Cell Biol. 2014;15:411–421. doi: 10.1038/nrm3801. [DOI] [PubMed] [Google Scholar]
- Ishikawa K, Takenaga K, Akimoto M, Koshikawa N, Yaaguchi A, Imanishi H, Nakada K, Honma Y, Hayashi JI. ROS-generating mitochondrial DNA mutations can regulate tumor cell metastasis. Science. 2008;320:661–664. doi: 10.1126/science.1156906. [DOI] [PubMed] [Google Scholar]
- Perera RM, Stoykova S, Nicolay BN, Ross KN, Fitamant J, Boukhali M, Lengrand J, Deshpande V, Selig MK, Ferrone CR, et al. Transcriptional control of the autophagy-lysosome system in pancreatic cancer. Nature. 2015 doi: 10.1038/nature14587. [Google Scholar]
- Novak I, Kirkin V, McEwan DG, Zhang J, Wild P, Rozenknop A, Rogov V, Löhr F, Popovic D, Occhipinti A, et al. Nix is a selective autophagy receptor for mitochondrial clearance. EMBO Rep. 2010;11:45–51. doi: 10.1038/embor.2009.256. [DOI] [PMC free article] [PubMed] [Google Scholar]
- Chourasia AH, Boland ML, Macleod KF. Mitophagy & Cancer. Cancer Metabol. 2015;3:1–11. doi: 10.1186/s40170-015-0130-8. [DOI] [PMC free article] [PubMed] [Google Scholar]
- Montagner M, Enzo E, Forcato M, Zanconato F, Parenti A, Rampazzo E, Basso G, Leo G, Rosato A, Bicciato S, et al. SHARP1 suppresses breast cancer metastasis by promoting degradation of hypoxia-inducible factors. Nature. 2012;487:380–384. doi: 10.1038/nature11207. [DOI] [PubMed] [Google Scholar]
- Maycotte P, Gearheart CM, Barnard R, Aryal S, Mulcahy Levy JM, Fosmire SP, Hansen RJ, Morgan MJ, Porter CC, Gustafson DL, et al. STAT3-mediated autophagy dependence identifies subtypes of breast cancer where autophagy inhibition can be efficacious. Cancer Res. 2014;74:2579–2590. doi: 10.1158/0008-5472.CAN-13-3470. [DOI] [PMC free article] [PubMed] [Google Scholar]
- Diwan A, Krenz M, Syed FM, Wansapura J, Ren X, Koesters AG, Li H, Kirschenbaum LA, Hahn HS, Robbins J, et al. Inhibition of ischemic cardiomyocyte apoptosis through targeted ablation of BNip3 restrains postinfarction remodeling in mice. J Clin Invest. 2007;117:2825–2833. doi: 10.1172/JCI32490. [DOI] [PMC free article] [PubMed] [Google Scholar]
- Yuan M, Breitkopf SB, Yang X, Asara JM. A positive/negative ion–switching, targeted mass spectrometry–based metabolomics platform for bodily fluids, cells, and fresh and fixed tissue. Nat Protocol. 2012;7:872–881. doi: 10.1038/nprot.2012.024. [DOI] [PMC free article] [PubMed] [Google Scholar]
- Lehmann BD, Bauer JA, Chen X, Sanders ME, Chakravarthy AB, Shyr Y, Pietenpol JA. Identification of human triple-negative breast cancer subtypes and preclinical models for selection of targeted therapies. J Clin Invest. 2011;121:2750–2767. doi: 10.1172/JCI45014. [DOI] [PMC free article] [PubMed] [Google Scholar]
Associated Data
This section collects any data citations, data availability statements, or supplementary materials included in this article.
Supplementary Materials
Expanded View Figures PDF
Review Process File