

Abstract
In human prostate cancer, the microRNA biogenesis machinery increases with prostate cancer progression. Here, we show that deletion of the Dgcr8 gene, a critical component of this complex, inhibits tumor progression in a Pten-knockout mouse model of prostate cancer. Early stages of tumor development were unaffected, but progression to advanced prostatic intraepithelial neoplasia was severely inhibited. Dgcr8 loss blocked Pten null-induced expansion of the basal-like, but not luminal, cellular compartment. Furthermore, while late-stage Pten knockout tumors exhibit decreased senescence-associated beta-galactosidase activity and increased proliferation, the simultaneous deletion of Dgcr8 blocked these changes resulting in levels similar to wild type. Sequencing of small RNAs in isolated epithelial cells uncovered numerous miRNA changes associated with PTEN loss. Consistent with a Pten–Dgcr8 association, analysis of a large cohort of human prostate tumors shows a strong correlation between Akt activation and increased Dgcr8 mRNA levels. Together, these findings uncover a critical role for microRNAs in enhancing proliferation and enabling the expansion of the basal cell compartment associated with tumor progression following Pten loss.
Keywords: DGCR8, microRNA, microRNA biogenesis, prostate cancer, PTEN
Introduction
Canonical microRNAs (miRNAs) are transcribed as long RNAs called primary miRNAs (pri-miRNA) that undergo two critical processing steps. First, in the nucleus, the pri-miRNA is processed to a precursor-miRNA (pre-miRNA) by the Microprocessor complex consisting of two proteins, DGCR8 and DROSHA. Next, in the cytoplasm, the pre-miRNA is processed to the mature microRNA duplex by DICER. The levels of the processing machinery are tightly regulated by homeostatic feedback mechanisms in normal tissues 1-4. However, in cancers, these levels can be dramatically altered (reviewed in 5). In lung and ovarian cancers, the down-regulation of the biogenesis machinery correlates with poor prognosis, suggesting that miRNAs are suppressing progression of these tumors 6, 7, 8, 9. Indeed, knockdown of the biogenesis machinery can enhance tumorigenicity in an in vivo model of lung cancer 9, 10, 11. In contrast, in esophageal and prostate cancer increases in the biogenesis machinery correlate with tumor progression, suggesting a positive effect of enhanced miRNA biogenesis in this tumor type 12, 13, 14, 15, 16, 17.
Profiling experiments have shown that miRNAs are mis-regulated in prostate cancer 16, 18, 19, 20, 21, 22, 23. However, overlap between data sets has been poor, likely due to the cellular heterogeneity of this tumor type, differences in sample acquisition, and differences in profiling platforms 24, 25. Functional studies for miRNAs in prostate cancer have been mostly performed in cell lines 26, 27. Two studies have tested the roles of miRNA clusters on the prostate in vivo. Specifically, inhibition of the miR-15/16 cluster or overexpression of the miR-106/25 cluster promotes cell proliferation in an otherwise normal prostate 28, 29.
The prostate-specific Pten (phosphatase and tensin homolog deleted on chromosome 10) knockout mouse model (PtenΔ/Δ) shows a stereotypical pattern of tumor progression 30, 31, 32. This is characterized by early hyperplasia, followed by dysplasia and architectural disorganization of prostate tubules, and rare microinvasion into surrounding tissue. The model is highly relevant to human prostate cancer as 30% of localized disease and 60% of metastatic disease are associated with Pten loss 33. Pten loss results in enhanced senescence in early anterior prostate lesions 34. Suppression of senescence by combining Pten loss with P53 or P27 loss accelerates prostate tumor progression 34, 35.
Considering that the miRNA biogenesis machinery is increased with prostate cancer progression in humans, we wanted to test the global role of miRNAs in the PtenΔ/Δ model. Ptenloxp/loxp 31 and Dgcr8loxp/loxp 36, 37 conditional mice were combined with a prostate-specific cre (Probasin-Cre) 38. Analysis of resulting mice showed that deletion of Dgcr8 did not influence early epithelial hyperplasia, but severely disrupted further progression to dysplasia. Associated with this inhibition of progression was a block in the expansion of cells expressing basal cell markers and a failure to suppress senescence. Therefore, miRNA biogenesis plays essential roles in progression following Pten loss. Profiling of the mouse epithelium uncovered numerous miRNAs whose expression was altered with Pten loss. The Dgcr8 knockout model should provide a powerful means to dissect the role of these and other miRNAs along with their downstream targets. Relevance of this model to human tumors is supported by a statistically significant correlation between AKT activation downstream of PTEN and increased levels of DGCR8 across a large cohort of prostate cancer samples.
Results
Dgcr8 loss reduces Pten-knockout tumor formation
To test the role of DGCR8 and hence canonical miRNAs in prostate cancer progression, we turned to the Pten and Dgcr8 conditional knockout mouse models. Specifically, probasin-cre 38 (Pb-Cre), which is expressed throughout the prostate epithelium beginning 1 week following birth, was crossed to Ptenloxp/loxp 31 and Dgcr8loxp/loxp 36, 37 conditional knockout alleles, referred from here on as PtenΔ/Δ and Dgcr8Δ/Δ, respectively. Immunostaining confirmed loss of nuclear DGCR8 protein in the epithelium of Dgcr8Δ/Δ and PtenΔ/Δ Dgcr8Δ/Δ prostates at both 12 and 32 weeks of age using two independent antibodies and methods (Fig1A). To confirm down-regulation of miRNAs associated with Dgcr8 loss, RNA was isolated from prostates of PtenΔ/Δ and PtenΔ/Δ Dgcr8Δ/Δ mice. Dgcr8 mRNA levels were significantly down in the PtenΔ/Δ Dgcr8Δ/Δ relative to PtenΔ/Δ (Fig1B). To test miRNA levels, a multiplex qRT–PCR reaction was performed for 80 miRNAs. Fifty-five of these miRNAs were expressed in at least two of the three PtenΔ/Δ samples. Of the 55 miRNAs, 41 were consistently down in the knockouts (Fig1C). The remaining 14 likely reflect miRNAs highly expressed among the non-epithelial cell contaminants; for example, miR-22 is expressed in fibroblasts 39, 40. These data are consistent with an expected loss of miRNA biogenesis following Pb-cre-driven deletion of Dgcr8 in the prostatic epithelium. Furthermore, phosphorylated-AKT (pAKT) was upregulated in both PtenΔ/Δ and PtenΔ/Δ Dgcr8Δ/Δ prostates relative to their Pten wild-type counterparts showing that Dgcr8 loss did not alter the effect of Pten deletion on the AKT pathway (Figs1D and EV1).
Figure 1.

Pb-cre-driven deletion of Dgcr8 and Pten
- Staining for DGCR8 protein in prostates. Upper images: immunohistochemical staining using the Aviva Systems Biology antibody (scale bar, 100 μm). Wild-type and PtenΔ/Δ prostates have DGCR8-positive nuclei in both the basal and luminal cells as well as surrounding stromal cells. Dgcr8Δ/Δ and PtenΔ/Δ Dgcr8Δ/Δ prostates show diminished DGCR8 nuclear staining in both basal and luminal cells, but not stromal cells. Cytoplasmic signal is non-specific. Representative images of at least two mice of each genotype from the old cohort were analyzed. Lower images: immunofluorescent staining for DGCR8 expression using the Proteintech Group antibody (scale bar, 100 μm). DAPI and DGCR8 channels from the same field of view are shown. DAPI staining shows the position of nuclei. The inset shows representative cells 3× zoomed. Arrows indicate cells with positive nuclear stain, and arrowheads indicate cells lacking nuclear stain. Representative images of at least two mice of each genotype from the young cohort were analyzed.
- Relative levels of Dgcr8 transcript in PtenΔ/Δ Dgcr8Δ/Δ versus PtenΔ/Δ alone. qRT–PCR for Dgcr8 exon 3 expression was performed on RNA prepared from frozen sections of 3 mice of each genotype.
- Relative expression levels of 55 miRNAs in PtenΔ/Δ Dgcr8Δ/Δ versus PtenΔ/Δ alone. Multiplex qRT–PCR data for three individuals of each genotype as in (B). Ct values were normalized to Sno202 levels. Error bars represent standard deviation.
- Representative confocal images of pAKT staining. Immunofluorescent staining of pAKT expression reveals strong expression in PtenΔ/Δ and PtenΔ/Δ Dgcr8Δ/Δ prostates compared to wild type and Dgcr8Δ/Δ. AKT phosphorylation is directly downstream of PTEN and is activated upon PTEN loss. Shown are representative images taken from at least two mice per genotype in the old cohort using the Olympus confocal microscope as described in Materials and Methods (scale bar, 100 μm). See FigEV1 for representative low-magnification images from young and old cohorts.

Phosphorylated-AKT expression correlates with genetic Pten loss
- A, B Representative epi-fluorescent images from the young (A) and old (B) cohort at low magnification. Upper panels in green show pAKT Ser373 expression. Lower panels in blue show corresponding DAPI images (scale bar, 500 μm).
Next, we asked whether Dgcr8 loss altered tumor development in the Pten null prostate epithelium. We collected prostates from mice aged from 10 to 52 weeks, which were separated into two cohorts—a young cohort (10–14 weeks of age) and an old cohort (32–44 weeks of age). In the young cohort, sixteen of the seventeen PtenΔ/Δ mice had developed visible prostate tumors, while only four of the fourteen PtenΔ/Δ Dgcr8Δ/Δ had done so (Fig2A and B). Mice were allowed to age to discern whether there was a delay versus a block in tumorigenesis in the absence of Dgcr8. In the older cohort, all PtenΔ/Δ mice had large tumors, while eight of twelve PtenΔ/Δ Dgcr8Δ/Δ mice had developed discernable tumors, a statistically significant decrease (Fig2A and C). Of note, the PtenΔ/Δ Dgcr8Δ/Δ mice tended to be slightly older than the PtenΔ/Δ mice in the old cohort, but still had fewer tumors (Fig EV2A). Furthermore, the PtenΔ/Δ Dgcr8Δ/Δ tumors, when present, were generally smaller (Fig2A). Dgcr8 loss alone produced normal appearing prostates at all ages examined (Figs2 and EV2A). Together, these data show that Dgcr8 is not essential for postnatal growth of the prostate, but does suppress tumor development following Pten loss.
Figure 2.

Loss of Dgcr8 reduces tumor incidence in PtenΔ/Δ model of prostate cancer
- A Representative images of prostates from each genotype. Upper panels: young cohort; lower panels: old cohort. Note large bilateral tumors in old PtenΔ/Δ prostates and smaller bilateral tumors in the young PtenΔ/Δ animals. Other genotypes show examples of normal appearing prostates (scale bar, 100 μm). See FigEV2A for breakdown of individual mice by age and genotype.
- B, C Quantification of tumor incidence (green) represented as percentage of total in the young (B) and old (C) cohorts. The number of mice with each phenotype is shown within bars. Statistical differences were calculated by the Fisher’s exact test. n.s. P > 0.05, *P < 0.05, **P < 0.005, ***P < 0.0005.
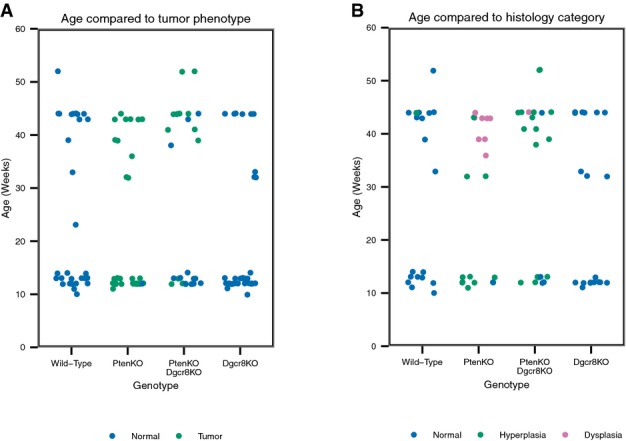
Tumor and histological breakdown of all mice in the study by age and genotype
In main figures, these mice were divided into two cohorts based on age. The young cohort is aged 10–12 weeks and the old cohort is aged 32–44 weeks. Note that the PtenΔ/Δ mice in the old cohort tended to be younger, but still had more advanced cancer phenotype than double knockout mice.
Dgcr8 loss inhibits histological progression
Loss of Pten results in a stereotypical histological progression over time, initially showing hyperplasia but then progressing to severe dysplasia consistent with high-grade PIN (prostatic intraepithelial neoplasia) 30, 31, 32. To test the effect of Dgcr8 loss on histological progression, prostates from the different genetic backgrounds were sectioned, stained with hematoxylin and eosin, and evaluated by two independent pathologists blinded to genotype 41. Tissues were scored based on structural and cellular changes in the glandular and stromal compartments and parsed into three groups: normal, benign hyperplasia, and advanced dysplasia (Fig3A). Hyperplasia was defined as tubules showing epithelial cell expansion often bridging across the lumen, whereby cells appeared relatively normal with little increase in mitoses or necrosis (Fig3A, middle panels). Dysplasia was defined as expansion of abnormal appearing cells with common mitoses, solid sheets of tumor cell growth, nuclear atypia, and necrosis, all consistent with a higher-grade tumor (Fig3A, right panels).
Figure 3.

Loss of Dgcr8 inhibits histological progression to dysplasia in the PtenΔ/Δ background
- A Categorization of histological phenotypes. Shown are representative images of different histological phenotypes at low and high magnification (scale bar, 100 μm). All sections were stained with hematoxylin/eosin. See text for description of histological features used to define normal, hyperplasia, and dysplasia categories.
- B, C Characterization and quantification of histology on representative young mice from Fig2B and old mice in Fig2C. All slides were evaluated and scored by two pathologists blinded to genetic background. Statistical differences were calculated by a modified Freeman-Halton extension of the Fisher’s exact test. n.s. P > 0.05, *P < 0.05, **P < 0.005, ***P < 0.0005. See Fig EV2B for breakdown of individual mice by age and genotype.
In the young cohort, eight of nine PtenΔ/Δ prostates examined and five of eight PtenΔ/Δ Dgcr8Δ/Δ showed diffuse hyperplasia (Fig3B). None of these prostates had evidence of dysplasia. In the old cohort, eight out of eleven PtenΔ/Δ mice showed severe dysplasia consistent with high-grade PIN (Fig3C). Furthermore, a single PtenΔ/Δ mouse showed areas suspicious for invasion, although frank invasive carcinoma was never observed (Appendix Fig S1). In contrast, only one of twelve PtenΔ/Δ Dgcr8Δ/Δ prostates showed evidence of dysplasia. Instead, ten of twelve showed hyperplasia and one of the twelve showed normal histology. The single dysplastic and single normal PtenΔ/Δ Dgcr8Δ/Δ prostate were each from mice aged 44 weeks (FigEV2B). Double knockout mice aged 1 year still failed to progress to dysplasia (Appendix Fig S2, FigEV2), suggesting that progression was blocked rather than simply delayed. Importantly, Dgcr8 loss alone had no discernable histological phenotype. Therefore, these findings show that while Dgcr8 is not required for stability of the normal adult prostatic epithelium or for the development of hyperplasia in PtenΔ/Δ, it is important for cytologic progression from hyperplasia to dysplasia in the context of Pten loss.
Basal cell expansion associated with Pten loss is reversed by concomitant loss of Dgcr8
Similar to the human prostate, the normal murine prostate epithelium consists of a basal and a luminal cell layer with rare neuroendocrine cells. The basal cells are in direct contact with the basal lamina forming a discontinuous layer around the periphery of the gland and express the cytokeratin CK5. The luminal cells are larger with distinct apical polarity, form a continuous layer of cells overlying the basal cells, and express the cytokeratin CK8. This architectural organization is lost in PtenΔ/Δ prostates 32. In particular, the luminal cells become multilayered and the CK5-positive basal cells expand out of their normal peripheral niche into the more luminal regions.
To identify a potential role for miRNAs in this phenotype, we stained for CK5 and CK8 in the different genetic backgrounds (Fig4A, Appendix Fig S3). As previously described, Pten loss resulted in the migration of basal-like cells from the basal lamina into the more luminal regions (Figs4A and EV3). The number of cells positive for the basal and luminal markers was up in the PtenΔ/Δ relative to wild-type prostates (Fig4B). Loss of Dgcr8 alone did not influence the architecture or the number of CK5 and CK8 staining cells within the tubules (Fig4A and B). However, in the PtenΔ/Δ background the loss of Dgcr8 dramatically altered the phenotype. Indeed, the CK5-positive basal cell compartment of the double knockouts looked strikingly similar to that of the wild-type and Dgcr8 alone knockouts (Figs4A and EV3F). In contrast, the expansion in the number of CK8-positive luminal cells was similar between PtenΔ/Δ and PtenΔ/Δ Dgcr8Δ/Δ prostates (Fig4B). Therefore, while Dgcr8 loss alone does not alter the size or architecture of basal and luminal cell compartments, it does block the expansion and mis-localization of the CK5-positive cells normally seen in the Pten null background.
Figure 4.

Dgcr8 is required for PtenΔ/Δ-mediated basal cell expansion
- Representative confocal images of basal (CK5; green) and luminal (CK8; red) cell populations in indicated genotypes from the old cohort. Nuclei are stained with the DNA dye ToPro3 (blue) (scale bar, 100 μm).
- Quantification of basal and luminal cell compartments. The extent of basal and luminal expansion was measured by counting the number of cells staining positive for either CK5 (basal cells) or CK8 (luminal cells) in 63× images taken at the junction of the dorsal–lateral and anterior prostate lobes. Four images from four individual mice were evaluated per genotype for a total of at least 16 microscopic fields of view per genotype. Mean ± standard deviation is shown. The statistical significance was calculated using Student’s t-test. n.s. P > 0.05, *P < 0.05, **P < 0.005, ***P < 0.0005.

Dgcr8 is required for PtenΔ/Δ-mediated basal cell expansion
- A, B Representative low-magnification epi-fluorescent images of basal (CK5; green) and luminal (CK8; red) cell populations in indicated genotypes from the young cohort (A) and the old cohort (B). Nuclei are stained with the DAPI (blue) (scale bars, 500 μm). Note expansion of basal cells in old Pten null mice, which is not seen in other genotypes. Quantification of old mice is shown in Fig5B.
DGCR8 is essential for promoting proliferation and inhibiting senescence in late-stage tumors
PTEN loss has been reported to promote senescence in the anterior prostate, which then diminishes with tumor progression 34, 42. To evaluate the effect of miRNA loss on this phenotype, we stained for the senescence marker beta-galactosidase (SA-β-gal) in sections of the dorsal and lateral prostate lobes (Fig5A). In the young cohort, SA-β-gal staining was consistently detected in all genotypes. This is in contrast to the previous reports that described minimal activity in wild-type prostates. This difference may reflect regional differences in the degree of senescence. However, similar to the previous reports, there was a reduction in SA-β-gal in the PtenΔ/Δ prostates as the mice aged (Fig5B). Furthermore, the older PtenΔ/Δ mice showed significantly lower numbers of SA-β-gal cells relative to their wild-type, Dgcr8Δ/Δ, and PtenΔ/Δ Dgcr8Δ/Δ counterparts (20 versus typically greater than 40 percent of the cells). Consistent with SA-β-gal, the number of cells staining for the proliferation marker Ki67 was greatly reduced in the wild-type, Dgcr8 knockout, and the Pten:Dgcr8 double knockout mice relative to Pten knockout alone (Figs5C and EV4). In particular, PtenΔ/Δ mice showed a large number of proliferative cells in the luminal region, which were rarely seen in the other genetic backgrounds. The percentage of Ki67-positive nuclei was quantified in samples from the old cohort showing a significant difference between PtenΔ/Δ and PtenΔ/Δ Dgcr8Δ/Δ samples (Fig5D). Therefore, Dgcr8 is essential for the decrease in senescence and increase in proliferation seen at late stages of tumor progression in the Pten-knockout mice. Cleaved caspase-3 staining showed only very rare apoptotic cells in all genotypes and thus is unlikely to play a major role (Appendix Fig S4). Together, these data suggest that DGCR8 is required to enable progression in the Pten null background.
Figure 5.

Increased senescence and decreased proliferation in PtenΔ/Δ Dgcr8Δ/Δ relative to PtenΔ/Δ prostates
- Senescence: Staining for SA-β-gal (blue). Counter-stained with Nuclear Fast Red. Representative images at 10× magnification are shown.
- Quantification of SA-β-gal-positive cells. Two slides of all old mice shown in Fig2C were counted. The percentages of SA-β-gal-positive cells were calculated as the ratio of β-Gal-positive out of 500 cells total counted per animal. A total of 250 cells were counted on both the right and the left proximal anterior prostate and adjacent dorsal–lateral prostate in the section. Four mice of each genotype were counted. Mean ± SD is shown. Student’s t-test was used to calculate statistical significance. Wild type, PtenΔ/Δ Dgcr8Δ/Δ, and Dgcr8Δ/Δ were not statistically different from each other. n.s. P > 0.05, *P < 0.05, **P < 0.005, ***P < 0.0005.
- Representative confocal images of proliferation marker Ki67 green with DAPI-stained nuclei overlay (scale bar, 100 μm).
- Quantification of Ki67 staining. The percentage of Ki67 was calculated by determining the ratio of Ki67-positive to all ToPro3-labeled nuclei in the prostate glands. At least four images from four individuals of each genotype were counted. Images were taken in approximately the same location in each prostate at the junction of the dorsal–lateral and anterior prostate lobes. Mean ± SD is shown. Student’s t-test was used to calculate statistical significance. Wild type, PtenΔ/Δ Dgcr8Δ/Δ, and Dgcr8Δ/Δ were not statistically different from each other. n.s. P > 0.05, *P < 0.05, **P < 0.005, ***P < 0.0005.

Decreased proliferation in PtenΔ/Δ Dgcr8Δ/Δ relative to PtenΔ/Δ prostates
- A, B Representative low-magnification epi-fluorescent images of Ki67 (green) staining in prostates from the young cohort (A) and from the old cohort (B). Nuclei are stained with the DAPI (blue) (scale bar, 500 μm). Note increased proliferation in both young and old Pten null mice relative to other genotypes. Quantification of old mice is shown in Fig5D.
microRNA changes in Pten null tumors
To identify miRNAs that are altered with Pten loss, we crossed the R26lox-stop-lox-YFP reporter allele into the wild-type and PtenΔ/Δ lines allowing for isolation of the corresponding prostate epithelial cells (Fig6A). The specific isolation of the epithelial cells is critical since profiling of whole tumor tissue can lead to erroneous interpretations 43. RNA libraries were prepared from YFP-positive cells from 3 wild-type and 3 PtenΔ/Δ prostates and submitted for Illumina sequencing. We found 21 microRNAs whose expression was significantly different (Fig6B). Seventeen of these miRNAs were expressed at substantial levels in at least one of the two groups [i.e. average of > 100 cpm, all of which showed highly significant changes in expression (Fig6C)]. Five of these microRNAs (miR-139, 183, 210, 31, and 93) were upregulated with Pten loss and thus are strong candidates for playing a positive role in promoting progression in these prostates.
Figure 6.

microRNA changes associated with Pten-mediated tumorigenesis
- Scheme to isolate Pten-deficient epithelial cells from mouse prostate. Prostates were isolated from 12-week-old transgenic mice expressing Probasin-Cre and the Rosa26lox-stop-lox-YFP reporter allele plus and minus the Ptenflox/flox allele. YFP-positive cells were isolated using fluorescence-activated cell sorting technology. RNA was isolated and small RNA libraries were submitted for deep sequencing analysis.
- Volcano scatter plot of log2-fold difference between wild type and PtenΔ/Δ versus log10 P-values. microRNAs with differences > 2-fold and q-value < 0.05 are highlighted and labeled. Q-values were determined using Benjamini–Hochberg procedure.
- Scatterplot of log2 counts per million (cpm) expression values of subset of miRNAs with q-values < 0.05 and average counts in at least one group of > 100 cpm. The black bar represents the mean of the three values for each genotype.
Source data are available online for this figure.
Akt activity and Dgcr8 levels are correlated in human prostate cancers
Previously, it had been shown that the microRNA biogenesis machinery, including Dgcr8, is increased in human prostate cancers relative to normal prostate tissue 5, 15, 16. To confirm these findings, we performed IHC for DGCR8 on human prostate cancer samples. Interestingly, staining showed DGCR8 levels in tumor cells to be similar to levels found in normal basal cells, but increased relative to normal luminal cells (FigEV5). To expand on these findings, we asked whether there is a direct correlation between DGCR8 levels and activation of AKT pathway among human prostate cancers. To infer AKT activity, the PARADIGM algorithm was applied to RNA profiling data on 334 prostate adenocarcinoma (PRAD) samples from the Cancer Genome Atlas Program to determine integrated pathway levels (IPLs) 44, 45. A significant positive correlation was uncovered between DGCR8 expression and PARADIGM-inferred AKT2 IPLs whether evaluated as a continuous measurement (Spearman’s rank correlation (Rho) ρ = 0.25, P = 4.77E-6) or binned into distinct activity levels (Kruskal–Wallis test P = 5.69E05) (Fig7A and B). Two hundred of these TCGA PRAD cases had reverse-phase protein array (RPPA) data allowing for independent measurement of AKT activity based on pAKT (pT308 and pS473) levels. While DGCR8 expression showed no correlation with total AKT protein level (ρ = 0.00, P = 0.99), it had a significant positive correlation with pAKT (pT308) levels (ρ = 0.13, and P = 0.04) as well as a strong trend for correlation with pAKT (S473) (ρ = 0.12, P = 0.06), further supporting an association between AKT activation and DGCR8 (Fig7C). Together, these findings support the relevance of the mouse model to human prostate cancer.

DGCR8 is expressed preferentially in the basal cells of normal human prostates and aberrantly expressed in the luminal cells of tumors
Representative IHC images of DGCR8 staining in human prostate cancers. The normal gland in each panel is demarcated by the dotted line; L indicates lumen. DGCR8-positive basal cells lining the normal prostate gland are indicated by the arrowhead. Note that the overlying luminal cells are DGCR8 negative. Adjacent low grade (left panel) and high grade (right panel) showing increasing levels of DGCR8 protein in the tumor cells over normal cells.
Figure 7.

Association between DGCR8 expression and PARADIGM-inferred AKT2 integrated pathway level (IPL) in human prostate adenocarcinoma
- Scatterplot of DGCR8 mRNA expression versus PARADIGM-inferred AKT2 IPL in 334 TCGA PRAD cases.
- Boxplot showing DGCR8 mRNA expression within AKT2 IPLs defined subgroups.
- Scatterplot of DGCR8 mRNA expression versus pAKT-pT308 protein levels.
Discussion
Our findings show that Dgcr8 is not required for the post-natal maintenance of the mouse prostate. However, when combined with a Pten knockout model, the loss of Dgcr8 inhibits tumor progression. This block is associated with inhibition of basal cell compartment expansion and increased senescence-associated beta-galactosidase activity. In contrast, early hyperplasia associated with Pten loss is unaffected by Dgcr8 loss. microRNAs are down in the double knockout relative to Pten knockout alone, consistent with DGCR8’s known requirement in canonical miRNA biogenesis 37, 46. It has been proposed that Dgcr8 has broad roles in RNA processing beyond microRNAs, based on HITS-CLIP data showing interaction of Dgcr8 with a large fraction of the coding and non-coding transcriptome 47. However, more recent work evaluating not only binding but also cleavage of targets in vivo shows that cleavage of non-miRNA targets is rare and of unclear significance 48. Indeed, Dgcr8 levels track very closely with overall pri-miRNA levels diminishing risk of off-target cleavage 4. Therefore, the defect in tumor progression in the PtenΔ/Δ Dgcr8Δ/Δ mice is most easily explained by depletion in tumor-promoting miRNAs.
Interestingly, a number of microRNA families including the miR-106/25, the miR-17-92, and miR-23b clusters promote early hyperplasia in prostate by targeting Pten itself 28, 49. These findings, together with those reported here, suggest two important roles for miRNA control in prostate tumor development (Appendix Fig S5). In the presence of Pten, miRNAs can promote early hyperplasia by suppressing Pten post-transcriptionally. If Pten is genetically lost, this first stage of tumorigenesis occurs in a miRNA-independent fashion. However, with Pten loss, further tumor progression is initially delayed by the induction of senescence, a protective adaptation to otherwise uncontrolled growth, in older animals 34. Eventually, senescence is overcome and tumor progression occurs in a miRNA-dependent fashion. A role for miRNAs and the miRNA biogenesis machinery in both enhancing and overcoming senescence has been described in other settings 50, 51, 52. The miRNAs responsible for overcoming the senescence block in the current model remain to be determined. However, profiling of the Pten null epithelial cells uncovered a number of miRNAs that were upregulated following PTEN loss including miR-139, 183, 210, 31, and 93. Future studies functionally testing each of these miRNAs in the context of PTEN loss will be important in the determination of their roles in progression.
The importance of miRNAs in promoting prostate cancer progression is supported by the increase in the biogenesis machinery, at the level of both pri- to pre-miRNA (DGCR8/DROSHA) and pre- to mature miRNA (DICER) processing 15, 16, 17. Similar increases are seen in esophageal cancer 12, 13. However, the opposite is seen in other tumors including lung and ovarian 6, 7, 8, 9. The differences between these tumors may reflect the dominant population of miRNAs found within the tumor cells of origin. If tumor-suppressive miRNAs predominate (as would be found in a more differentiated cells), it would be beneficial for the cells to decrease miRNA biogenesis. In contrast, if tumor-promoting miRNAs were the major population, then increased miRNA biogenesis would provide a selective advantage. Indeed, the major role of decreased Dicer levels in Ras-induced lung cancer model appears to be the suppression of let-7 processing, a well-known tumor-suppressive miRNA found in most differentiated tissues 53. Interestingly, we find a correlation between AKT activity and DGCR8 levels across a large cohort of human prostate cancers. Thus, an alternative to tumor type is that the decrease or increase in the biogenesis machinery is associated with the underlying genetic changes. That is, while increased Ras activity may require decreased miRNA production for progression, Akt activity may require increased miRNA biogenesis. Going forward, it will be important to evaluate such relationships.
Pb-cre-driven Dgcr8 deletion alone did not produce a discernable phenotype in terms of histology, basal or luminal cell number, proliferation or senescence. These findings contrast with a publication evaluating the effect of Pb-cre-driven deletion of Dicer 54. Dicer deletion resulted in apoptosis of luminal cells and concomitant increase in proliferation of the basal cells, neither of which were seen in the Dgcr8 knockout prostates. While Dgcr8 and Dicer are both essential for the processing of canonical miRNAs, Dicer has additional roles 55. In particular, Dicer is essential for the processing of endo-siRNAs and non-canonical miRNAs including mirtrons and shRNAs 56. Therefore, the difference in phenotype between Dgcr8 and Dicer loss may be explained by roles for these other subclasses of small RNAs in the prostate. The inhibitory effect of Dicer loss on luminal cells was not overcome by Pten loss in this model again consistent with additional roles for Dicer 57. It will be interesting to search for DGCR8-independent small RNAs in the prostate and determine whether their roles can explain the differences in phenotype following Dgcr8 and Dicer loss.
What and how microRNAs are regulating prostate cancer remains unclear. The findings reported here suggest two potential roles in post-initiation stages of tumor progression, one in basal cell expansion and the other in controlling senescence. The correlation of the loss of basal cell expansion and decreased tumor progression suggests a central role of the basal cells providing a supportive role in progression, possibly acting as a reservoir for secondary hits. Indeed, many findings have suggested that basal cells can provide the cell of origin for prostate cancer 58, 59, 60, 61. Other findings would suggest that rare luminal stem-like cells can also be efficiently transformed following specific deletion of Pten 62, 63. In our double knockout model, we find that the luminal cells expand in the absence of miRNAs, but many become senescent. However, the most dramatic phenotype is in the basal cell layer, where the additional loss of Dgcr8 reverses the basal cell expansion and migration seen with Pten alone. Once again, knowing the miRNAs required for progression and cells in which they function should help resolve this issue of the source of the cancer-initiating cells.
The Dgcr8 knockout model provides an opportunity to uncover the miRNAs that are regulating these processes by using an add-back approach 64, 65, 66. That is, individual miRNAs can be reintroduced one at a time in the otherwise knockout background and tested for rescue of different phenotypes such as basal cell expansion or decreased senescence. This approach has the advantage that it removes the complicating issues of redundancy and cross-reactivity between miRNAs enabling one to focus on one miRNA at a time.
Materials and Methods
Mice were bred and maintained in accordance with UCSF guidelines. Prostates were collected, frozen in OCT, sectioned on a cryostat, and stained using standard protocols. OCT blocks were manually dissected for RNA preparation. miRNA levels were measured by multiplex qRT–PCR.
Mice
Generation of the Dgcr8loxp/loxp mice in our laboratory has been described previously, and mice are available from Jackson Labs (MMRRC:32051 http://jaxmice.jax.org/query) 36, 37. Ptenloxp/loxp 31 and PBCre4 38 were crossed with Dgcr8loxp/loxp to obtain the appropriate alleles. The reporter allele R26lox-stop-lox-YFP was crossed in to appropriate lines for the small RNA sequencing experiments 67. Mice were maintained in B6 background. All mice were genotyped from tail DNA by PCR at weaning and at tissue collection using published primers. Mice were housed in the AALAC-accredited (#001084) UCSF Laboratory Animal Research Center. PHS Assurance #A3400-01.
Necropsy and histopathology
Tissue was collected from mice of various genotypes as described previously 41. Dissected prostates were immediately photographed and then fresh-frozen in OCT (Thermo Scientific). Briefly, the block of tissue was dissected, wiped dry, photographed, and then submerged in OCT in a manner to allow for taking histological sections through the dorsal and lateral prostate lobes. The entire OCT block was submerged in methylbutane (Fisher) that was pre-cooled on dry ice. After 5 min, the block was stored at −20 or −80°C prior to sectioning. A total of 7 μm sections were stored at −80°C until processed for histology or immunostaining. Standard hematoxylin (Sigma) and eosin-Y (Richard-Allen Scientific) staining was performed. At least two independent sections from each tumor were provided to a urologic pathologist for evaluation and characterization. This and all subsequent cellular analysis was performed on sections confirmed to contain dorsal and lateral lobes of the prostate. For all of these samples, the pathologist was blinded as to genotype and tissues were evaluated and classified according to the Bar Harbor Classification scheme 41. Prostate organ images at 12 weeks old were acquired on an Olympus MVX10 using a 0.63X objective with a DP71 camera and at 32 weeks old on a Leica MZ16 using a 0.63X reducer and 0.71X objective with a DFC320 camera. Histological images were acquired on a Leica DM1000 10× or 40× objective with a DFC290 camera.
Dgcr8 transcript and miRNA expression analysis
Prostate tissue was collected by manual dissection of OCT blocks. RNA was prepared using Trizol reagent (Invitrogen). RNA was quantified on NanoDrop spectrophotometer. Quality of RNA samples was evaluated on an Agilent Bioanalyzer using a Nano kit (Agilent). Dgcr8 qPCR was performed following RT (Invitrogen) on an ABI 7900 real-time PCR machine using SYBR Green mix as previously published; primers were as follows: qDGCR8-F AGGTCTCTGTGCTCCCAAGAAG, qDGCR8-R TGGTCATCATTGGCTGTACACTT 2, 37. Multiplex qRT–PCR for miRNA quantitation was performed exactly according to the published protocol, on the Fluidigm Biomark microfluidics platform 68. RT and qPCR was performed as previously described using custom-made primers 37.
Senescence activity
Senescence-associated beta-galactosidase (SA-β-gal) was measured as previously described on sections containing the dorsal and lateral lobes 69. Briefly, slides were fixed 10 min in 4% PFA, rinsed with PBS, and then stained with X-gal solution at pH 6.0 overnight at 37°C. Slides were rinsed with PBS, counter-stained lightly with hematoxylin and eosin, dehydrated, and mounted in Cytoseal-60 (Richard-Allen Scientific). Senescence staining was also performed with similar results using the Cellular Senescence Assay Kit (Millipore), counterstained with Nuclear Fast Red (Vector Laboratories), and mounted in glycerol. Images were acquired on a Leica DM1000 10× objective with a DFC290 camera.
Immunostaining
Mouse samples were stained for DGCR8 using two techniques. Samples from the old cohort were prepared using the Vectastain elite rabbit ABC kit following the manufacturer’s instructions after blocking endogenous peroxidase activity with hydrogen peroxide and incubation with the rabbit anti-human-DGCR8 primary antibody (Aviva Systems Biology, ARP40984) overnight at 4°C. All slides were incubated in the substrate for the same amount of time. Color images were acquired on a Leica DM1000 40× objective with a DFC290 camera. Samples from both the cohorts were prepared for immunofluorescent staining by first performing antigen retrieval in 3 mM sodium citrate buffer in a steaming rice cooker for 20 min. After the samples cooled to room temperature, they were rinsed with PBS, blocked with PBS/0.1% Tween-20/10% goat serum, and then incubated in the primary rabbit anti-mouse DGCR8 antibody (Proteintech Group 10996-1-AP) overnight at 4°C. The slides were then rinsed with PBS twice for 5 min and briefly with PBS/0.1% Tween-20 and then incubated 2 h in the appropriate Alexa Fluor-labeled secondary antibody (Invitrogen) at 1:500 dilution in the same blocking buffer. Nuclei were stained with DAPI. Images were captured using Metamorph (Molecular Dynamics) running a Leica DMI4000B 63× objective and DFC350FX camera.
Immunofluorescent staining was done essentially as for DGCR8 using the following primary antibodies: cleaved caspase-3, rabbit anti-human (Cell Signaling Technology 9664 1:200); cytokeratin 5, rabbit anti-mouse CK5 (Covance, clone AF138, 1:200); cytokeratin 8, mouse anti-human CK8 (Covance, clone HK-8, 1:50); Ki67, rabbit anti-mouse Ki67 (Thermo, clone SP6, 1:200); and pAKT (Ser473) (Cell Signaling technology D9E, 1:50). ToPro3 (Invitrogen) or DAPI (Invitrogen) was used as a DNA/nuclear counterstain in all fluorescent experiments. Samples for confocal analysis were stained for 10 min with ToPro3 (1:10,000), dipped in water, and then mounted in fluoromount-G (Southern Biotech), and images were captured on a Zeiss LSM 5 Pascal confocal microscope using the 63× objective. Samples for epi-fluorescent analysis were stained with DAPI, dipped in water, and then mo unted in ProLong Gold (Invitrogen). Images were captured using Metamorph (Molecular Dynamics) running a Leica DMI4000B and DFC350FX camera.
Quantification of molecular markers
Quantification of CK5, CK8, and Ki67 was done on slides prepared from old cohort samples using fluorescent images collected on a Zeiss LSM 5 Pascal confocal microscope (63× objective). Four 63× confocal images per mouse and at least three mice per genotype were analyzed. The images were taken from the dorsal–lateral region proximal to the anterior prostate. The percentage of CK5-, CK8-, or Ki67-positive cells was calculated by counting the number of positive cells out of total ToPro3-labeled nuclei. Counting was constrained to the prostate ducts; stromal cells were not included in the analysis.
SA-β-gal staining was quantified by counting the number of positive cells out of 250 cells from both the right and the left dorsal–lateral prostate for 500 cells total. Four mice for each genotype were quantified. For this analysis, samples were from the old cohort and all stained in the same batch using the published technique 69.
Differential miRNA expression
Prostates were collected from four wild-type and five Ptenloxp/loxp mice also expressing PBCre4 and R26lox-stop-lox-YFP. Prostates were dissected from the seminal vesicles and urinary tract organs and then prepared for FACS analysis 70. RNA was prepared using the Qiagen micro miRNeasy kit. Small RNA libraries were prepared as previously described 71 with additional modifications to optimize ligations 72. The detailed protocol will be posted at www.BlellochLab.ucsf.edu. Pooled small RNA libraries were sequenced on a Illumina HiSeq 2500 machine. Resulting reads were trimmed using CutAdapt (DOI: 10.14806/ej.17.1.200) (parameters: -u 2 –max-n 0 -m 17 -M 36) and mapped as previously described 73.
Statistical analysis
The Freeman-Halton extension of the Fisher’s exact test was used to test whether the differences in tumor formation and histological grouping per genotype were statistically significant. Student’s t-test was used to test whether the differences in immunostaining between genotypes were statistically significant.
Mapped small RNA reads were normalized as counts per million reads mapping to pre-miRNA hairpins. Exploratory analysis using PCA, hierarchical clustering, and comparison of median and variance between samples was used to remove outlier samples. P-values were determined using rowttests on those rows with log2 counts > 0 and then corrected for multiple hypothesis testing using qvalue package in R.
Integration of copy number, mRNA expression, and pathway interaction data was performed on 334 prostate adenocarcinoma (PRAD) samples from The Cancer Genome Atlas (TCGA) program using the PARADIGM algorithm 44, 45. Level 3 RSEM normalized expression and Level 4 GISTIC thresholded copy number data were obtained from Firehose, and pathway interaction data included pathways from the NCI-PID, BioCarta, and Reactome databases. From these data, the PARADIGM algorithm infers an integrated pathway level (IPL) for each pathway feature that reflects its activity in a tumor sample relative to the median activity across all tumors.
Correlation between log2-scaled mRNA expression levels of DGCR8 and the PARADIGM-inferred AKT1, AKT2, and AKT3 IPL was assessed using Spearman’s rank correlation. In addition, we subdivided the data set based on the AKT2 IPL into three groups (median: IPL = 0, low: IPL < 0, high: IPL > 0) and compared the DGCR8 mRNA expression between these three groups using the Kruskal–Wallis test.
Acknowledgments
We would like to thank members of the Blelloch Laboratory for critical reading of the manuscript. We would like to thank Samuel Chadwick and Samir Qurashi for their assistance with the mouse husbandry and tissue preparation and Muhammad Danial for his technical assistance in preparing the mouse sequencing libraries. This work was supported by funds to CDB and RB from DOD (PC110468). CDB received additional support from a UCSF Prostate Cancer Center Junior Faculty Award, JS from the UCSF Prostate SPORE, NIH Grant P50CA89520, and FM from the Wissenschaftlich Urologische Gesellschaft eV.
Author contributions
CDB contributed to all figures except Fig7. AP contributed to Figs3 and 5, Figs EV2 and EV4. FM contributed to Figs1 and 5. JS contributed to Figs3 and5, Fig EV5, Appendix Figs S1 and S2. AS contributed to Fig6. CY and CB contributed to Fig7. MD contributed to Fig EV5. CDB and RB conceived the project and CDB wrote the manuscript.
Conflict of interest
The authors declare that they have no conflict of interest.
Supporting Information
Appendix
Expanded View Figures PDF
Review Process File
Source Data for Figure 6
References
- Shenoy A, Blelloch R. Genomic analysis suggests that mRNA destabilization by the microprocessor is specialized for the auto-regulation of Dgcr8. PLoS ONE. 2009;4:e6971. doi: 10.1371/journal.pone.0006971. [DOI] [PMC free article] [PubMed] [Google Scholar]
- Han J, Pedersen JS, Kwon SC, Belair CD, Kim YK, Yeom KH, Yang WY, Haussler D, Blelloch R, Kim VN. Posttranscriptional crossregulation between Drosha and DGCR8. Cell. 2009;136:75–84. doi: 10.1016/j.cell.2008.10.053. [DOI] [PMC free article] [PubMed] [Google Scholar]
- Triboulet R, Chang HM, Lapierre RJ, Gregory RI. Post-transcriptional control of DGCR8 expression by the microprocessor. RNA. 2009;15:1005–1011. doi: 10.1261/rna.1591709. [DOI] [PMC free article] [PubMed] [Google Scholar]
- Barad O, Mann M, Chapnik E, Shenoy A, Blelloch R, Barkai N, Hornstein E. Efficiency and specificity in microRNA biogenesis. Nat Struct Mol Biol. 2012;19:650–652. doi: 10.1038/nsmb.2293. [DOI] [PMC free article] [PubMed] [Google Scholar]
- Lin S, Gregory RI. MicroRNA biogenesis pathways in cancer. Nat Rev Cancer. 2015;15:321–333. doi: 10.1038/nrc3932. [DOI] [PMC free article] [PubMed] [Google Scholar]
- Merritt WM, Lin YG, Han LY, Kamat AA, Spannuth WA, Schmandt R, Urbauer D, Pennacchio LA, Cheng JF, Nick AM, et al. Dicer, Drosha, and outcomes in patients with ovarian cancer. N Engl J Med. 2008;359:2641–2650. doi: 10.1056/NEJMoa0803785. [DOI] [PMC free article] [PubMed] [Google Scholar]
- Pampalakis G, Diamandis EP, Katsaros D, Sotiropoulou G. Down-regulation of dicer expression in ovarian cancer tissues. Clin Biochem. 2010;43:324–327. doi: 10.1016/j.clinbiochem.2009.09.014. [DOI] [PubMed] [Google Scholar]
- Karube Y, Tanaka H, Osada H, Tomida S, Tatematsu Y, Yanagisawa K, Yatabe Y, Takamizawa J, Miyoshi S, Mitsudomi T, et al. Reduced expression of Dicer associated with poor prognosis in lung cancer patients. Cancer Sci. 2005;96:111–115. doi: 10.1111/j.1349-7006.2005.00015.x. [DOI] [PMC free article] [PubMed] [Google Scholar]
- Rakheja D, Chen KS, Liu Y, Shukla AA, Schmid V, Chang TC, Khokhar S, Wickiser JE, Karandikar NJ, Malter JS, et al. Somatic mutations in DROSHA and DICER1 impair microRNA biogenesis through distinct mechanisms in Wilms tumours. Nat Commun. 2014;2:4802. doi: 10.1038/ncomms5802. [DOI] [PMC free article] [PubMed] [Google Scholar]
- Kumar MS, Lu J, Mercer KL, Golub TR, Jacks T. Impaired microRNA processing enhances cellular transformation and tumorigenesis. Nat Genet. 2007;39:673–677. doi: 10.1038/ng2003. [DOI] [PubMed] [Google Scholar]
- Kumar MS, Pester RE, Chen CY, Lane K, Chin C, Lu J, Kirsch DG, Golub TR, Jacks T. Dicer1 functions as a haploinsufficient tumor suppressor. Genes Dev. 2009;23:2700–2704. doi: 10.1101/gad.1848209. [DOI] [PMC free article] [PubMed] [Google Scholar]
- Sugito N, Ishiguro H, Kuwabara Y, Kimura M, Mitsui A, Kurehara H, Ando T, Mori R, Takashima N, Ogawa R, et al. RNASEN regulates cell proliferation and affects survival in esophageal cancer patients. Clin Cancer Res. 2006;12:7322–7328. doi: 10.1158/1078-0432.CCR-06-0515. [DOI] [PubMed] [Google Scholar]
- Yoo NJ, Hur SY, Kim MS, Lee JY, Lee SH. Immunohistochemical analysis of RNA-induced silencing complex-related proteins AGO2 and TNRC6A in prostate and esophageal cancers. APMIS. 2010;118:271–276. doi: 10.1111/j.1600-0463.2010.02588.x. [DOI] [PubMed] [Google Scholar]
- Akagi I, Miyashita M, Ishibashi O, Mishima T, Kikuchi K, Makino H, Nomura T, Hagiwara N, Uchida E, Takizawa T. Relationship between altered expression levels of MIR21, MIR143, MIR145, and MIR205 and clinicopathologic features of esophageal squamous cell carcinoma. Dis Esophagus. 2011;24:523–530. doi: 10.1111/j.1442-2050.2011.01177.x. [DOI] [PubMed] [Google Scholar]
- Chiosea S, Jelezcova E, Chandran U, Acquafondata M, McHale T, Sobol RW, Dhir R. Up-regulation of dicer, a component of the MicroRNA machinery, in prostate adenocarcinoma. Am J Pathol. 2006;169:1812–1820. doi: 10.2353/ajpath.2006.060480. [DOI] [PMC free article] [PubMed] [Google Scholar]
- Ambs S, Prueitt RL, Yi M, Hudson RS, Howe TM, Petrocca F, Wallace TA, Liu CG, Volinia S, Calin GA, et al. Genomic profiling of microRNA and messenger RNA reveals deregulated microRNA expression in prostate cancer. Cancer Res. 2008;68:6162–6170. doi: 10.1158/0008-5472.CAN-08-0144. [DOI] [PMC free article] [PubMed] [Google Scholar]
- Shaikhibrahim Z, Lindstrot A, Ochsenfahrt J, Fuchs K, Wernert N. Epigenetics-related genes in prostate cancer: expression profile in prostate cancer tissues, androgen-sensitive and -insensitive cell lines. Int J Mol Med. 2013;31:21–25. doi: 10.3892/ijmm.2012.1173. [DOI] [PMC free article] [PubMed] [Google Scholar]
- Ozen M, Creighton CJ, Ozdemir M, Ittmann M. Widespread deregulation of microRNA expression in human prostate cancer. Oncogene. 2008;27:1788–1793. doi: 10.1038/sj.onc.1210809. [DOI] [PubMed] [Google Scholar]
- Porkka KP, Pfeiffer MJ, Waltering KK, Vessella RL, Tammela TL, Visakorpi T. MicroRNA expression profiling in prostate cancer. Cancer Res. 2007;67:6130–6135. doi: 10.1158/0008-5472.CAN-07-0533. [DOI] [PubMed] [Google Scholar]
- Tong AW, Fulgham P, Jay C, Chen P, Khalil I, Liu S, Senzer N, Eklund AC, Han J, Nemunaitis J. MicroRNA profile analysis of human prostate cancers. Cancer Gene Ther. 2009;16:206–216. doi: 10.1038/cgt.2008.77. [DOI] [PubMed] [Google Scholar]
- Volinia S, Calin GA, Liu CG, Ambs S, Cimmino A, Petrocca F, Visone R, Iorio M, Roldo C, Ferracin M, et al. A microRNA expression signature of human solid tumors defines cancer gene targets. Proc Natl Acad Sci USA. 2006;103:2257–2261. doi: 10.1073/pnas.0510565103. [DOI] [PMC free article] [PubMed] [Google Scholar]
- Song H, Liu Y, Pan J, Zhao ST. Expression profile analysis reveals putative prostate cancer-related microRNAs. Genet Mol Res. 2013;12:4934–4943. doi: 10.4238/2013.October.24.4. [DOI] [PubMed] [Google Scholar]
- Hart M, Nolte E, Wach S, Szczyrba J, Taubert H, Rau TT, Hartmann A, Grasser FA, Wullich B. Comparative microRNA profiling of prostate carcinomas with increasing tumor stage by deep sequencing. Mol Cancer Res. 2014;12:250–263. doi: 10.1158/1541-7786.MCR-13-0230. [DOI] [PubMed] [Google Scholar]
- Schaefer A, Jung M, Kristiansen G, Lein M, Schrader M, Miller K, Stephan C, Jung K. MicroRNAs and cancer: current state and future perspectives in urologic oncology. Urol Oncol. 2010;28:4–13. doi: 10.1016/j.urolonc.2008.10.021. [DOI] [PubMed] [Google Scholar]
- Mestdagh P, Hartmann N, Baeriswyl L, Andreasen D, Bernard N, Chen C, Cheo D, D’Andrade P, DeMayo M, Dennis L, et al. Evaluation of quantitative miRNA expression platforms in the microRNA quality control (miRQC) study. Nat Methods. 2014;11:809–815. doi: 10.1038/nmeth.3014. [DOI] [PubMed] [Google Scholar]
- Gandellini P, Folini M, Zaffaroni N. Towards the definition of prostate cancer-related microRNAs: where are we now? Trends Mol Med. 2009;15:381–390. doi: 10.1016/j.molmed.2009.07.004. [DOI] [PubMed] [Google Scholar]
- Cannistraci A, Di Pace AL, De Maria R, Bonci D. MicroRNA as new tools for prostate cancer risk assessment and therapeutic intervention: results from clinical data set and patients’ samples. Biomed Res Int. 2014;2014:146170. doi: 10.1155/2014/146170. [DOI] [PMC free article] [PubMed] [Google Scholar]
- Poliseno L, Salmena L, Riccardi L, Fornari A, Song MS, Hobbs RM, Sportoletti P, Varmeh S, Egia A, Fedele G, et al. Identification of the miR-106b∼25 microRNA cluster as a proto-oncogenic PTEN-targeting intron that cooperates with its host gene MCM7 in transformation. Sci Signal. 2010;3:ra29. doi: 10.1126/scisignal.2000594. [DOI] [PMC free article] [PubMed] [Google Scholar]
- Bonci D, Coppola V, Musumeci M, Addario A, Giuffrida R, Memeo L, D’Urso L, Pagliuca A, Biffoni M, Labbaye C, et al. The miR-15a-miR-16-1 cluster controls prostate cancer by targeting multiple oncogenic activities. Nat Med. 2008;14:1271–1277. doi: 10.1038/nm.1880. [DOI] [PubMed] [Google Scholar]
- Lesche R, Groszer M, Gao J, Wang Y, Messing A, Sun H, Liu X, Wu H. Cre/loxP-mediated inactivation of the murine Pten tumor suppressor gene. Genesis. 2002;32:148–149. doi: 10.1002/gene.10036. [DOI] [PubMed] [Google Scholar]
- Trotman LC, Niki M, Dotan ZA, Koutcher JA, Di Cristofano A, Xiao A, Khoo AS, Roy-Burman P, Greenberg NM, Van Dyke T, et al. Pten dose dictates cancer progression in the prostate. PLoS Biol. 2003;1:E59. doi: 10.1371/journal.pbio.0000059. [DOI] [PMC free article] [PubMed] [Google Scholar]
- Wang S, Gao J, Lei Q, Rozengurt N, Pritchard C, Jiao J, Thomas GV, Li G, Roy-Burman P, Nelson PS, et al. Prostate-specific deletion of the murine Pten tumor suppressor gene leads to metastatic prostate cancer. Cancer Cell. 2003;4:209–221. doi: 10.1016/s1535-6108(03)00215-0. [DOI] [PubMed] [Google Scholar]
- Sarker D, Reid AH, Yap TA, de Bono JS. Targeting the PI3K/AKT pathway for the treatment of prostate cancer. Clin Cancer Res. 2009;15:4799–4805. doi: 10.1158/1078-0432.CCR-08-0125. [DOI] [PubMed] [Google Scholar]
- Chen Z, Trotman LC, Shaffer D, Lin HK, Dotan ZA, Niki M, Koutcher JA, Scher HI, Ludwig T, Gerald W, et al. Crucial role of p53-dependent cellular senescence in suppression of Pten-deficient tumorigenesis. Nature. 2005;436:725–730. doi: 10.1038/nature03918. [DOI] [PMC free article] [PubMed] [Google Scholar]
- Majumder PK, Grisanzio C, O’Connell F, Barry M, Brito JM, Xu Q, Guney I, Berger R, Herman P, Bikoff R, et al. A prostatic intraepithelial neoplasia-dependent p27 Kip1 checkpoint induces senescence and inhibits cell proliferation and cancer progression. Cancer Cell. 2008;14:146–155. doi: 10.1016/j.ccr.2008.06.00. [DOI] [PMC free article] [PubMed] [Google Scholar]
- Rao PK, Toyama Y, Chiang HR, Gupta S, Bauer M, Medvid R, Reinhardt F, Liao R, Krieger M, Jaenisch R, et al. Loss of cardiac microRNA-mediated regulation leads to dilated cardiomyopathy and heart failure. Circ Res. 2009;105:585–594. doi: 10.1161/CIRCRESAHA.109.200451. [DOI] [PMC free article] [PubMed] [Google Scholar]
- Suh N, Baehner L, Moltzahn F, Melton C, Shenoy A, Chen J, Blelloch R. MicroRNA function is globally suppressed in mouse oocytes and early embryos. Curr Biol. 2010;20:271–277. doi: 10.1016/j.cub.2009.12.044. [DOI] [PMC free article] [PubMed] [Google Scholar]
- Wu X, Wu J, Huang J, Powell WC, Zhang J, Matusik RJ, Sangiorgi FO, Maxson RE, Sucov HM, Roy-Burman P. Generation of a prostate epithelial cell-specific Cre transgenic mouse model for tissue-specific gene ablation. Mech Dev. 2001;101:61–69. doi: 10.1016/s0925-4773(00)00551-7. [DOI] [PubMed] [Google Scholar]
- Jazbutyte V, Fiedler J, Kneitz S, Galuppo P, Just A, Holzmann A, Bauersachs J, Thum T. MicroRNA-22 increases senescence and activates cardiac fibroblasts in the aging heart. Age. 2013;35:747–762. doi: 10.1007/s11357-012-9407-9. [DOI] [PMC free article] [PubMed] [Google Scholar]
- Xu D, Takeshita F, Hino Y, Fukunaga S, Kudo Y, Tamaki A, Matsunaga J, Takahashi RU, Takata T, Shimamoto A, et al. miR-22 represses cancer progression by inducing cellular senescence. J Cell Biol. 2011;193:409–424. doi: 10.1083/jcb.201010100. [DOI] [PMC free article] [PubMed] [Google Scholar]
- Shappell SB, Thomas GV, Roberts RL, Herbert R, Ittmann MM, Rubin MA, Humphrey PA, Sundberg JP, Rozengurt N, Barrios R, et al. Prostate pathology of genetically engineered mice: definitions and classification. The consensus report from the Bar Harbor meeting of the Mouse Models of Human Cancer Consortium Prostate Pathology Committee. Cancer Res. 2004;64:2270–2305. doi: 10.1158/0008-5472.can-03-0946. [DOI] [PubMed] [Google Scholar]
- Toso A, Revandkar A, Di Mitri D, Guccini I, Proietti M, Sarti M, Pinton S, Zhang J, Kalathur M, Civenni G, et al. Enhancing chemotherapy efficacy in Pten-deficient prostate tumors by activating the senescence-associated antitumor immunity. Cell Rep. 2014;9:75–89. doi: 10.1016/j.celrep.2014.08.044. [DOI] [PubMed] [Google Scholar]
- Chivukula RR, Shi G, Acharya A, Mills EW, Zeitels LR, Anandam JL, Abdelnaby AA, Balch GC, Mansour JC, Yopp AC, et al. An essential mesenchymal function for miR-143/145 in intestinal epithelial regeneration. Cell. 2014;157:1104–1116. doi: 10.1016/j.cell.2014.03.055. [DOI] [PMC free article] [PubMed] [Google Scholar]
- Sedgewick AJ, Benz SC, Rabizadeh S, Soon-Shiong P, Vaske CJ. Learning subgroup-specific regulatory interactions and regulator independence with PARADIGM. Bioinformatics. 2013;29:i62–i70. doi: 10.1093/bioinformatics/btt229. [DOI] [PMC free article] [PubMed] [Google Scholar]
- Vaske CJ, Benz SC, Sanborn JZ, Earl D, Szeto C, Zhu J, Haussler D, Stuart JM. Inference of patient-specific pathway activities from multi-dimensional cancer genomics data using PARADIGM. Bioinformatics. 2010;26:i237–i245. doi: 10.1093/bioinformatics/btq182. [DOI] [PMC free article] [PubMed] [Google Scholar]
- Wang Y, Medvid R, Melton C, Jaenisch R, Blelloch R. DGCR8 is essential for microRNA biogenesis and silencing of embryonic stem cell self-renewal. Nat Genet. 2007;39:380–385. doi: 10.1038/ng1969. [DOI] [PMC free article] [PubMed] [Google Scholar]
- Macias S, Plass M, Stajuda A, Michlewski G, Eyras E, Caceres JF. DGCR8 HITS-CLIP reveals novel functions for the Microprocessor. Nat Struct Mol Biol. 2012;19:760–766. doi: 10.1038/nsmb.2344. [DOI] [PMC free article] [PubMed] [Google Scholar]
- Seong Y, Lim DH, Kim A, Seo JH, Lee YS, Song H, Kwon YS. Global identification of target recognition and cleavage by the microprocessor in human ES cells. Nucleic Acids Res. 2014;42:12806–12821. doi: 10.1093/nar/gku957. [DOI] [PMC free article] [PubMed] [Google Scholar]
- Tian L, Fang YX, Xue JL, Chen JZ. Four microRNAs promote prostate cell proliferation with regulation of PTEN and its downstream signals in vitro. PLoS ONE. 2013;8:e75885. doi: 10.1371/journal.pone.0075885. [DOI] [PMC free article] [PubMed] [Google Scholar]
- Abdelmohsen K, Srikantan S, Kang MJ, Gorospe M. Regulation of senescence by microRNA biogenesis factors. Ageing Res Rev. 2012;11:491–500. doi: 10.1016/j.arr.2012.01.003. [DOI] [PMC free article] [PubMed] [Google Scholar]
- Feliciano A, Sanchez-Sendra B, Kondoh H, Lleonart ME. MicroRNAs regulate key effector pathways of senescence. J Aging Res. 2011;2011:205378. doi: 10.4061/2011/205378. [DOI] [PMC free article] [PubMed] [Google Scholar]
- Gorospe M, Abdelmohsen K. MicroRegulators come of age in senescence. Trends Genet. 2011;27:233–241. doi: 10.1016/j.tig.2011.03.005. [DOI] [PMC free article] [PubMed] [Google Scholar]
- Kumar MS, Erkeland SJ, Pester RE, Chen CY, Ebert MS, Sharp PA, Jacks T. Suppression of non-small cell lung tumor development by the let-7 microRNA family. Proc Natl Acad Sci USA. 2008;105:3903–3908. doi: 10.1073/pnas.0712321105. [DOI] [PMC free article] [PubMed] [Google Scholar]
- Zhang L, Zhang B, Valdez JM, Wang F, Ittmann M, Xin L. Dicer ablation impairs prostate stem cell activity and causes prostate atrophy. Stem Cells. 2010;28:1260–1269. doi: 10.1002/stem.455. [DOI] [PMC free article] [PubMed] [Google Scholar]
- Babiarz JE, Blelloch R. 2009. StemBookSmall RNAs - their biogenesis, regulation and function in embryonic stem cells [Internet]. Cambridge, MA: Harvard Stem Cell Institute.
- Babiarz JE, Ruby JG, Wang Y, Bartel DP, Blelloch R. Mouse ES cells express endogenous shRNAs, siRNAs, and other Microprocessor-independent, Dicer-dependent small RNAs. Genes Dev. 2008;22:2773–2785. doi: 10.1101/gad.1705308. [DOI] [PMC free article] [PubMed] [Google Scholar]
- Zhang B, Chen H, Zhang L, Dakhova O, Zhang Y, Lewis MT, Creighton CJ, Ittmann MM, Xin L. A dosage-dependent pleiotropic role of Dicer in prostate cancer growth and metastasis. Oncogene. 2014;33:3099–3108. doi: 10.1038/onc.2013.281. [DOI] [PMC free article] [PubMed] [Google Scholar]
- Goldstein AS, Huang J, Guo C, Garraway IP, Witte ON. Identification of a cell of origin for human prostate cancer. Science. 2010;329:568–571. doi: 10.1126/science.1189992. [DOI] [PMC free article] [PubMed] [Google Scholar]
- Lawson DA, Xin L, Lukacs R, Xu Q, Cheng D, Witte ON. Prostate stem cells and prostate cancer. Cold Spring Harb Symp Quant Biol. 2005;70:187–196. doi: 10.1101/sqb.2005.70.003. [DOI] [PubMed] [Google Scholar]
- Lukacs RU, Lawson DA, Xin L, Zong Y, Garraway I, Goldstein AS, Memarzadeh S, Witte ON. Epithelial stem cells of the prostate and their role in cancer progression. Cold Spring Harb Symp Quant Biol. 2008;73:491–502. doi: 10.1101/sqb.2008.73.012. [DOI] [PubMed] [Google Scholar]
- Mulholland DJ, Xin L, Morim A, Lawson D, Witte O, Wu H. Lin-Sca-1+CD49fhigh stem/progenitors are tumor-initiating cells in the Pten-null prostate cancer model. Cancer Res. 2009;69:8555–8562. doi: 10.1158/0008-5472.CAN-08-4673. [DOI] [PMC free article] [PubMed] [Google Scholar]
- Wang X, Kruithof-de Julio M, Economides KD, Walker D, Yu H, Halili MV, Hu YP, Price SM, Abate-Shen C, Shen MM. A luminal epithelial stem cell that is a cell of origin for prostate cancer. Nature. 2009;461:495–500. doi: 10.1038/nature08361. [DOI] [PMC free article] [PubMed] [Google Scholar]
- Lu TL, Huang YF, You LR, Chao NC, Su FY, Chang JL, Chen CM. Conditionally ablated Pten in prostate basal cells promotes basal-to-luminal differentiation and causes invasive prostate cancer in mice. Am J Pathol. 2013;182:975–991. doi: 10.1016/j.ajpath.2012.11.025. [DOI] [PubMed] [Google Scholar]
- Wang Y, Baskerville S, Shenoy A, Babiarz JE, Baehner L, Blelloch R. Embryonic stem cell-specific microRNAs regulate the G1-S transition and promote rapid proliferation. Nat Genet. 2008;40:1478–1483. doi: 10.1038/ng.250. [DOI] [PMC free article] [PubMed] [Google Scholar]
- Melton C, Judson RL, Blelloch R. Opposing microRNA families regulate self-renewal in mouse embryonic stem cells. Nature. 2010;463:621–626. doi: 10.1038/nature08725. [DOI] [PMC free article] [PubMed] [Google Scholar]
- Steiner DF, Thomas MF, Hu JK, Yang Z, Babiarz JE, Allen CD, Matloubian M, Blelloch R, Ansel KM. MicroRNA-29 regulates T-box transcription factors and interferon-gamma production in helper T cells. Immunity. 2011;35:169–181. doi: 10.1016/j.immuni.2011.07.009. [DOI] [PMC free article] [PubMed] [Google Scholar]
- Srinivas S, Watanabe T, Lin CS, William CM, Tanabe Y, Jessell TM, Costantini F. Cre reporter strains produced by targeted insertion of EYFP and ECFP into the ROSA26 locus. BMC Dev Biol. 2001;1:4. doi: 10.1186/1471-213X-1-4. [DOI] [PMC free article] [PubMed] [Google Scholar]
- Moltzahn F, Olshen AB, Baehner L, Peek A, Fong L, Stoppler H, Simko J, Hilton JF, Carroll P, Blelloch R. Microfluidic-based multiplex qRT-PCR identifies diagnostic and prognostic microRNA signatures in the sera of prostate cancer patients. Cancer Res. 2011;71:550–560. doi: 10.1158/0008-5472.CAN-10-1229. [DOI] [PMC free article] [PubMed] [Google Scholar]
- Dimri GP, Lee X, Basile G, Acosta M, Scott G, Roskelley C, Medrano EE, Linskens M, Rubelj I, Pereira-Smith O, et al. A biomarker that identifies senescent human cells in culture and in aging skin in vivo. Proc Natl Acad Sci USA. 1995;92:9363–9367. doi: 10.1073/pnas.92.20.9363. [DOI] [PMC free article] [PubMed] [Google Scholar]
- Lukacs RU, Goldstein AS, Lawson DA, Cheng D, Witte ON. Isolation, cultivation and characterization of adult murine prostate stem cells. Nat Protoc. 2010;5:702–713. doi: 10.1038/nprot.2010.11. [DOI] [PMC free article] [PubMed] [Google Scholar]
- Williams Z, Ben-Dov IZ, Elias R, Mihailovic A, Brown M, Rosenwaks Z, Tuschl T. Comprehensive profiling of circulating microRNA via small RNA sequencing of cDNA libraries reveals biomarker potential and limitations. Proc Natl Acad Sci USA. 2013;110:4255–4260. doi: 10.1073/pnas.1214046110. [DOI] [PMC free article] [PubMed] [Google Scholar]
- Zhang Z, Lee JE, Riemondy K, Anderson EM, Yi R. High-efficiency RNA cloning enables accurate quantification of miRNA expression by deep sequencing. Genome Biol. 2013;14:R109. doi: 10.1186/gb-2013-14-10-r109. [DOI] [PMC free article] [PubMed] [Google Scholar]
- Shenoy A, Danial M, Blelloch RH. Let-7 and miR-125 cooperate to prime progenitors for astrogliogenesis. EMBO J. 2015;34:1180–1194. doi: 10.15252/embj.201489504. [DOI] [PMC free article] [PubMed] [Google Scholar]
Associated Data
This section collects any data citations, data availability statements, or supplementary materials included in this article.
Supplementary Materials
Appendix
Expanded View Figures PDF
Review Process File
Source Data for Figure 6