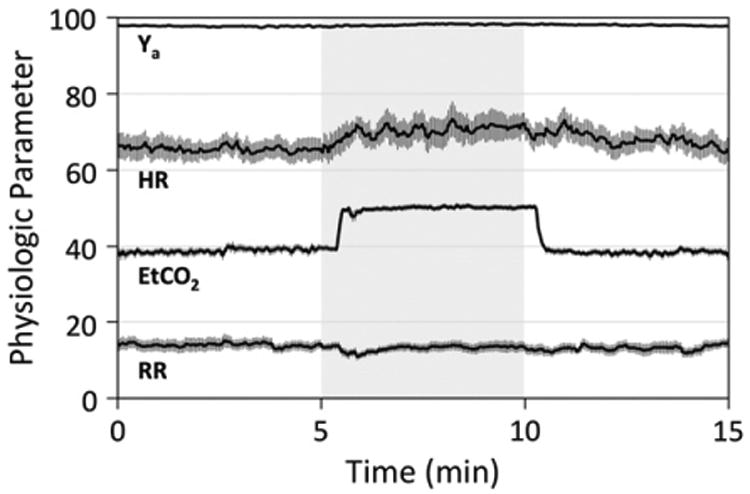
Fig. 6.

Subject-averaged time-course plots of physiologic parameters measured via pulse oximetry (Ya, HR) and capnography (EtCO2, RR). Gray shading indicates the hypercapnia period. Error bars indicate standard errors (N=10). Comparing average baseline (0–5minutes) and steady-state hypercapnia (7.5–10minutes) values across subjects, significant increases were observed in EtCO2 (P < 0.0001), Ya (P < 0.01), and HR (P < 0.05). RR did not show a significant change (P = 0.64).
