

Summary
Background
To investigate the diagnostic value of dynamic magnetic resonance imaging (MRI) and positron emission tomography/computed tomography (PET/CT) for laryngeal cancers after inadequate CT results.
Material/Methods
The study comprised 45 patients investigated for primary laryngeal cancer or recurrence-residue in which CT was considered inadequate. A mass was found in 20 patients. Dynamic MRI and PET/CT were compared for diagnosis of mass, lymph node involvement, recurrence and residue. The dynamic curves formed in dynamic MRI were investigated for diagnostic contributions.
Results
The sensitivity and specificity of the dynamic MRI, for supraglottic, glottic and subglottic location, was 100%, 80%, and 92%; 100%, 85%, and 100%, respectively. In PET/CT the sensitivity and specificity were 100% for all of those localizations. For lymph node involvement, the sensitivity of dynamic MRI and PET/CT was 100%, the specificity was 100% and 93%, respectively. For recurrence-residue, the sensitivity and specificity of dynamic MRI were 86% and 67%, respectively, with 100% sensitivity and specificity in PET/CT. The sensitivity of type A curve for detection of malignancy was 40%, and specificity was 100%. When type A and B curves were included, the sensitivity was 100%.
Conclusions
For patients investigated for laryngeal cancer in which CT is considered inadequate, dynamic MRI or PET/CT is useful.
MeSH Keywords: Laryngeal Neoplasms; Magnetic Resonance Imaging; Tomography, Emission-Computed
Background
Laryngeal cancer is the second most common type after oral cavity cancer in the head and neck region [1]. Most of the laryngeal masses are malignant and develop from the mucosal surface. Of all laryngeal cancers, 95% are squamous cell carcinomas [2,3].
Staging is the most important factor in the treatment plan. Diagnosis can be made with clinical examination and endoscopic biopsy. However, clinical examination is inadequate for the evaluation of submucosal spread, adjacent soft tissues, cartilage, lymph node involvement and distant metastases [4,5]. For these limitations, although computed tomography (CT) is used as the most common and first- choice imaging modality, it may be inadequate in the assessment of lesion extension to surrounding tissue and recurrence or residual tissue in small lesions (<1 cm). CT is particularly inadequate in the detection of lesions in soft tissue asymmetry, in distinguishing benign from malignant lesions, in cartilage involvement or variation due to a mass in the neighbourhood, asymmetric sclerosis and density, and in distinguishing edema and fibrosis from recurrence and residual tissue.
In this study, we aimed to compare dynamic magnetic resonance imaging (MRI) and positron emission tomography/computed tomography (PET/CT) in laryngeal cancer with inadequate CT imaging.
Material and Methods
Institutional review board approval and written informed consent forms were obtained for this study.
The study comprised patients with suspected or known laryngeal cancer where CT results had been inadequate in investigating extension and stage, or recurrence or residue after therapy. A total of 485 patients with lesions clearly observed with CT, who were easily diagnosed or had no need for an additional examination, were excluded. In inadequate CT results, the result considered as most likely was accepted as the initial diganosis.
When inadequate CT results were obtained by an experienced radiologist, dynamic MRI and PET/CT were taken from the patients. Histopathological correlation was achieved when a mass was determined.
A total of 45 patients (4 female, 41 male) with a mean age of 57.1±8.3 years (range 41–74 years) were included in the study. A tumoral mass was revealed in 20 of 45 patients. Ten of those patients were newly diagnosed with laryngeal cancer and the remaining 10 had previously undergone surgery and/or chemoradiotherapy for laryngeal cancer.
The PET/CT images were taken 8–12 weeks after therapy to avoid false- positive examinations. PET/CT scan was not performed in 3 cases. Whole body PET/CT scan from the vertex to the mid-thigh was performed after one- hour resting in a quiet environment after injection of 0.1mBq/kg of F-18 fluorodeoxyglucose (FDG) with Philips Gemini TF model PET/CT scanner (Philips Medical Systems, Netherlands).
MRI scan was taken with 1.5 Tesla Philips Gyroscan Intera (Philips Medical Systems, Netherlands). T2 Spectral Pre-saturation with Inversion-Recovery (SPIR) sections in the sagittal plane, T1–T2-weighted sections in the axial and coronal planes and T1-weighted sections in the sagittal plane were obtained before intravenous contrast injection. Dynamic T1 Fast Field Echo (FFE) and substraction images were obtained after 0.1 mmol/kg of bolus and 1 mL/sec of contrast agent (Gadolinium) infusion with an automatic injector. There are four types (Type A, B, C and D) of contrast enhacement and wash-out decsribed in the literature. Type A shows peak enhancement within 120 seconds (early phase) and decrease during the delayed phase. Type B shows increasing enhancement in the early phase and is followed by a plateau in the delayed phase (peak enhancement was seen within 120–240 seconds). Type C shows no increasing peak and enhancement throughout the examination. Type D shows no definite increase in enhancement throughout the examination [6].
Abnormal contrast enhacement or FDG uptake, asymmetric soft tissue growth, deletion in fat planes, different density and intensity changes from surrounding tissue were considered significant for the presence of a mass. For cartilage involvement, besides specific criteria such as erosion in the cortex and tumor presence on the extralaryngeal surface, less specific but highly sensitivite criteria were used such as asymmetry in the cartilage, asymmetric sclerosis, thickening or spring in the cortical margin, increased or obliterated signal intensity in the medulla. Lymph nodes greater than 1 cm in the short axis and a short/long axis ratio greater than 0.5 (round) were accepted as positive with FDG accumulation in PET/CT.
Using all of the above-mentioned criteria, mass location classified as supraglottic (epiglottis, aryepiglottic fold, ventricular band), glottic and subglottic, mass size classified as <1 cm, 1–2 cm, and >2 cm, and lymph node involvement were evaluated separately with dynamic MRI and PET/CT. In cartilage involvement, due to limited usage of PET/CT due to a partial volume effect, only the dynamic MRI was used for evaluation. The results of MRI and PET/CT were compared with CT results in terms of a change to the diagnosis. Intensity-time curves in MRI and Standardized Uptake Values (SUVmax) in PET/CT of masses were calculated and contributions to the diagnosis were investigated.
Statistical analysis
All statistical analyses were performed using the Statistical Package for Social Sciences for Windows software (SPSS version 15.0; SPSS Inc., Chicago, IL). The diagnostic results of MRI and PET/CT were compared with the gold-standard histopathological results, and true positivity, true negativity, false positivity, false negativity, sensitivity, specificity, and accuracy were calculated. The Mann-Whitney U test was used for the comparison of dynamic curve results and SUVmax values. The Kruskal Wallis test was used for the comparison of SUVmax values and dynamic curve results with the mass size, because the mass size contained three variables. For all statistical analyses, a value of P<0.05 was considered statistically significant.
Results
Of the 20 patients evaluated, one was female and 19 were male. Four of the lesions were located in the supraglottic area, six in the glottic, and 10 were in multiple areas, including the glottic area.
In the histopathological examination, 17 lesions were determined as malignant and three were benign. The malignant lesions were in situ carcinoma in one case, sarcomatoid carcinoma in one case, and the remaining 15 were squamous cell carcinoma. The benign lesions were pyogenic granuloma in one case, keratosis in one and dysplasia in one.
MRI had 100% sensitivity and specificity in the evaluation of supraglottic mass, cartilage and lymph node involvement. The sensitivity was 92% and 80%, and the specificity was 85% and 100% for glottic and subglottic mass, respectively (Table 1).
Table 1.
True positive, true negative, false positive, false negative, accuracy, sensitivity, and specificity of MRI for the lesions in supraglottic, glottic, subglottic, cartilage and lymph node regions.
| MRI | True positive | True negative | False positive | False negative | Accuracy (%) | Sensitivity (%) | Specificity (%) | |
|---|---|---|---|---|---|---|---|---|
| Supraglottic | E | 5 | 15 | 0 | 0 | 100 | 100 | 100 |
| AE | 6 | 14 | 0 | 0 | 100 | 100 | 100 | |
| VB | 7 | 13 | 0 | 0 | 100 | 100 | 100 | |
| Glottic | 12 | 6 | 1 | 1 | 90 | 92 | 85 | |
| Subglottic | 4 | 15 | 0 | 1 | 95 | 80 | 100 | |
| Cartilage | 5 | 15 | 0 | 0 | 100 | 100 | 100 | |
| Lymph node | 2 | 18 | 0 | 0 | 100 | 100 | 100 | |
E – epiglottis; AEF – aryepiglottic fold; BV – ventricular band.
The mean value of SUVmax was 9.5+5.4 (min: 3.30, max: 24.6). The sensitivity and specificity of PET/CT were 100% in supraglottic, glottic and subglottic masses with no false- negative or false- positive results. The sensitivity was 100% whereas the specificity was 93% for lymph node involvement due to false positivity in one patient (Table 2).
Table 2.
True positive, true negative, false positive, false negative, accuracy, sensitivity, and specificity of PET/CT for the lesions in supraglottic, glottic, subglottic, cartilage and lymph node regions.
| PET/CT | True positive | True negative | False positive | False negative | Accuracy (%) | Sensitivity (%) | Specificity (%) | |
|---|---|---|---|---|---|---|---|---|
| Supraglottic | E | 5 | 12 | 0 | 0 | 100 | 100 | 100 |
| AE | 6 | 11 | 0 | 0 | 100 | 100 | 100 | |
| VB | 7 | 10 | 0 | 0 | 100 | 100 | 100 | |
| Glottic | 12 | 5 | 0 | 0 | 100 | 100 | 100 | |
| Subglottic | 5 | 12 | 0 | 0 | 100 | 100 | 100 | |
| Lymph node | 2 | 14 | 1 | 0 | 94 | 100 | 93 | |
E – epiglottis; AEF – aryepiglottic fold; BV – ventricular band.
As regards the mass size, 5 (25%) lesions were larger than 2 cm, 6 (30%) were smaller than 1 cm and 9 (45%) were 1–2 cm. MRI and PET/CT changed the diagnosis of CT in 67% of patients where the mass was smaller than 1 cm and in 44%,and 50% in 1–2-cm masses, respectively. There was no diagnostic change of masses larger than 2 cm. MRI and PET/CT provide 100% true results in masses smaller than 1 cm and 80% and, 100% in 1–2-cm masses which had false results with CT, respectively. In the evaluation of recurrence and residual tissue, sensitivity, specificity, and accuracy were 86%, 67% and 80% with MRI and 100% for all parameters with PET/CT. MRI and PET/CT provided 83%- and 100%- true diagnosis, respectively, which were false- positive or false- negative with CT (Figures 1, 2).
Figure 1.
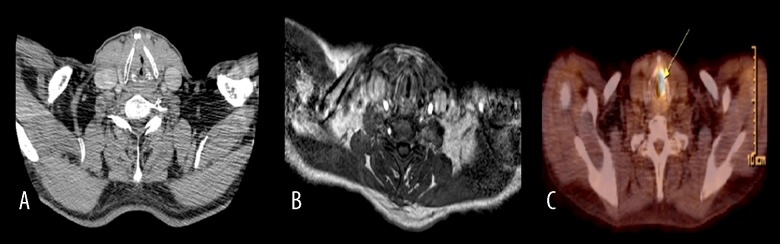
A 61-year- old male investigated for recurrence-residue. CT (A) and dynamic MRI (B) have a false -negative result. Glottic and subglottic masses (arrow) were seen with PET/CT (C). Histopathological examination revealed squamous cell carcinoma.
Figure 2.
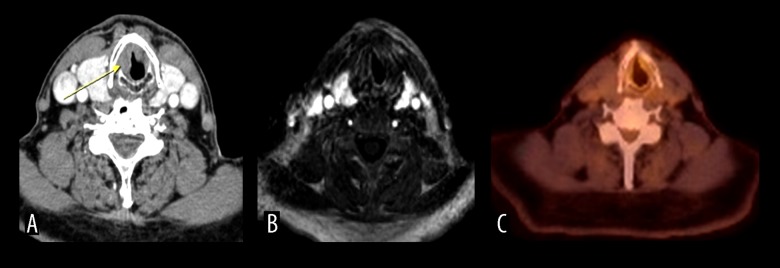
A 70-year- old male investigated for recurrence-residue. Glottic and subglottic suspicious masses were seen (false positive) with CT (A). Dynamic MRI (B) and PET/CT (C) were clear for a mass.
In the comparison of dynamic curves with SUVmax values and dynamic curves with mass size, there was no statistical significance. Correlation between mass size and SUVmax value exists (P<0.05). The sensitivity of type A curve was 40% and the specificity was 100%. When type A and type B were evaluated together, the sensitivity was 100%.
Discussion
Head and neck cancer is the third most common cancer and 500,000 new cases are added each year [7]. Laryngeal cancer, which is one of the most frequent sites, accounting for about a quarter of head and neck cancers [8], is mostly seen between the 5th and 7th decade and the male/female ratio varies from 5/1 to 20/1 [9,10]. The most significant factor in the treatment is staging. The mass originates from the mucosa and is diagnosed with direct or indirect clinical inspection. However, inspection is insufficient to determine submucosal spread, involvement of adjacent soft tissue, cartilage, lymph nodes and distant metastases [5,8]. Despite technological developments, false- negative and false- positive results are still obtained with CT and MRI which evaluate size and anatomical abnormalities, and PET/CT which evaluates metabolism [11]. Dynamic MRI and PET/CT have started to be used widely in the distinction of malignant and benign lesions. In this study, the diagnostic efficacy of dynamic MRI and PET/CT are compared after inadequate CT results.
CT is the most common and the first- choice imaging modality due to its low cost, high scan rate and availability and because of its high scan rate, motion artefacts are rare [12]. However, CT may not detect small mucosal tumors and inflammatory and edematous changes which may show that the tumor has spread more or may be misintepreted as recurrence or residue. Distortion in the adjacent tissue may mimic a tumor [8].
Increased vascularization and decreased interstitial space in the tumoral tissue cause fast and high peripheral contrast enhancement [13]. The most important difference between benign and malignant angiogenesis is increased vascular permeability in malignant tumors. A change in vascular permeability causes fast and high contrast enhancement with a fast washout. This feature adds functional data to the anatomical data of MRI [14]. Three curve types can be obtained with a dynamic study. Almost all of the type A curves are interpreted as malignant with a specificity of 90% and sensitivity of 21%. Most of the type B curves are malignant and type C curves are mostly benign (83% benign, 9% malign). Type A and B curves should be investigated for malignancy [6,15]. In this study, the sensitivity of type A curve was 21% and specificity 100%. When type A and B curves were evaluated together, the sensitivity increased to 100%.
In the detection of tumors, PET/CT is more sensitive than CT and MRI but has lower specificity. Postoperative changes such as inflammation, physiological uptake of adjacent tissues such as the thyroid gland, lymphoid tissue, salivary glands, or low uptake of FDG by some tumors may cause false results [16].
Banko et al. [5] showed the accuracy of MRI in glottic and subglottic tumors to be 83% and 89%, respectively. Cabuk et al. [17] reported a sensitivity of 94% and specificity of 75% in the detection of the primary tumor of head and neck cancers. In a previous study, PET/CT changed the diagnosis in 25 of 42 patients with laryngeal carcinoma, with sensitivity of 92%, specificity of 96%, and accuracy of 94% [18].
In the current study, the sensitivity of dynamic MRI for supraglottic, glottic and subglottic tumors was 100%, 92% and 80%, respectively. The specificity was 100%, 85%, and 100%, with accuracy of 100%, 90%, and 95%. PET/CT had 100% sensitivity, specificity and accuracy. Sensitivity and specificity have been reported to increase each year in literature. The high diagnostic parameter of the current study can be considered as being due to the small patient group, technological development, and experience of the doctors.
Cartilage invasion limits radiotherapy response and increases radiation necrosis. Therefore, cartilage involvement is important and expanded surgical treatment is necessary. Hyaline cartilage imaging varies enormously, because cartilage ossification increases with age and various variations and asymmetry occur [11,19].
Zbaren et al. [20] found the sensitivity of MRI for cartilage involvement to be 94% whereas in CT it was 67% with the specificity of MRI of 87% and of CT – 74%. Accuracy was close to no statistical significance (CT 80% and MRI 82%). In the current study, the sensitivity, specificity, and accuracy of MRI was 100% for cartilage involvement.
Lymph node metastasis depends on the location, depth and elongation of the primary tumor. Lymph node metastasis is the most important prognostic factor and when the N score increases, treatment failure increases.
Dammann et al. [10] studied the sensitivity and specificity of CT, MRI and PET/CT for lymph node metastases of head and neck cancers and found sensitivity of 80%, 93%, 85%, and specificity of 93%, 95%, 98%, respectively. In the current study, the sensitivity of MRI and PET/CT was 100%, the specificity was 100% with MRI and 93% with PET/CT. One false- positive result was present in PET/CT and the histopathology of the lymph node was reactive.
Granulation tissue or fibrosis after surgery and radiotherapy may be seen as recurrence [21]. Engelbrecht et al. [22] found the sensitivity of MRI to be 92% and specificity to be 86% in the evaluation of recurrence of head and neck cancers after radiotherapy. MRI was reported to be superior to CT in the discrimination of recurrence and scar tissue. In the current study, MRI had 86% sensitivity, 67% specificity and 80% accuracy in the evaluation of recurrence and residue. When compared with literature, these results were lower, which may be due to the non-randomisation of the patient group and to the fact that CT was considered inadequate and MRI was a further investigation.
Studies on the detection of recurrences with PET and PET/CT between 1999–2002 showed sensitivity of 84–100% and specificity of 61–93% [23]. In studies conducted between 2004–2009, sensitivity was 83–100% and specificity was 78–95% [24]. In the current study, PET/CT had 100% sensitivity, specificity, and accuracy for recurrence and residual tissue evaluation. MRI and PET/CT corrected the false CT results at rates of 83% and 100%, respectively.
The results of this study showed a correlation between mass size and SUVmax value but no correlation between SUVmax and dynamic curves or mass size and dynamic curves.
Conclusions
Dynamic MRI and PET/CT have a high diagnostic value in the evaluation of the laryngeal cancer. Dynamic MRI and PET/CT should be used for diagnosis of laryngeal cancer, recurrence and residue in cases of inadequate CT results. Dynamic MRI curves contribute to the diagnosis. There is a need for further studies on this topic with a larger patient group.
Footnotes
Statement
This study had no funding. There is no conflict of interest statement and funding.
References
- 1.Sturgis EM, Cinciripini PM. Trends in head and neck cancer incidence in relation to smoking prevalence: an emerging epidemic of human papillomavirus-associated cancers? Cancer. 2007;110(7):1429–35. doi: 10.1002/cncr.22963. [DOI] [PubMed] [Google Scholar]
- 2.Kumar V, Abbas AK, Fausto N. Pathologic Basis of Disease. 7th ed. Elsevier; China: 2005. pp. 786–87. [Google Scholar]
- 3.Barnes L, Eveson JW, Reichart PA, Sidransky D. Pathology and Genetics of Head and Neck Tumors. 1st ed. IARC Press; Lyon: 2005. pp. 108–39. [Google Scholar]
- 4.Hermans R. Staging of laryngeal and hypopharyngeal cancer: value of imaging studies. Eur Radiol. 2006;16:2386–400. doi: 10.1007/s00330-006-0301-7. [DOI] [PubMed] [Google Scholar]
- 5.Banko B, Dukić V, Milovanović J, et al. Diagnostic significance of magnetic resonance imaging in preoperative evaluation of patients with laryngeal tumors. Eur Arch Otorhinolaryngol. 2011;268:1617–23. doi: 10.1007/s00405-011-1701-0. [DOI] [PubMed] [Google Scholar]
- 6.Tuncbilek N, Unlu E, Karakas HM, et al. Evaluation of tumor angiogenesis with contrast-enhanced MR mammography. Breast J. 2003;9:403–8. doi: 10.1046/j.1524-4741.2003.09508.x. [DOI] [PubMed] [Google Scholar]
- 7.Hojgaard L, Specht L. PET/CT in head and neck cancer. Eur J Nucl Med Mol Imaging. 2007;34:1329–33. doi: 10.1007/s00259-007-0373-x. [DOI] [PubMed] [Google Scholar]
- 8.Hermans R. Staging of laryngeal and hypopharyngeal cancer: value of imaging studies. Eur Radiol. 2006;16:2386–400. doi: 10.1007/s00330-006-0301-7. [DOI] [PubMed] [Google Scholar]
- 9.Özlügedik S, Ünal A. Bas boyun kanserlerinde epidemiyoloji ve risk faktörleri. KBB Baş Boyun Cerrahisi’nde Güncel Yaklaşım. 2005;1:51–56. [in Turkish] [Google Scholar]
- 10.Özüdogru E, Kaya E. Larenks Kanseri. Galenos Aylık Tıp Dergisi. 2006;111:38–44. [in Turkish] [Google Scholar]
- 11.Dammann F, Horger M, Mueller-Berg M, et al. Rational diagnosis of squamous cell carcinoma of the head and neck region: comparative evaluation of ct, mrı, and 18FDG PET. Am J Roentgenol. 2005;184:1326–31. doi: 10.2214/ajr.184.4.01841326. [DOI] [PubMed] [Google Scholar]
- 12.Blitz AM, Aygun N. Radiologic evaluation of larynx cancer. Otolaryngol Clin N Am. 2008;41:697–713. doi: 10.1016/j.otc.2008.01.015. [DOI] [PubMed] [Google Scholar]
- 13.Türkbey B, Thomasson D, Pang Y, et al. The role of dynamic contrast-enhanced MRI in cancer diagnosis and treatment. Diagn Interv Radiol. 2010;16:186–92. doi: 10.4261/1305-3825.DIR.2537-08.1. [DOI] [PMC free article] [PubMed] [Google Scholar]
- 14.Choyke PL, Dwyer AJ, Knopp MV. Functional tumor imaging with dynamic contrast-enhanced magnetic resonance imaging. J Magn Reson Imaging. 2003;17:509–20. doi: 10.1002/jmri.10304. [DOI] [PubMed] [Google Scholar]
- 15.Kuhl CK, Mielcareck P, Klaschik S, et al. Dynamic breast MR imaging: are signal intensity time course data useful for differential diagnosis of enhancing lesions? Radiology. 1999;211:101–10. doi: 10.1148/radiology.211.1.r99ap38101. [DOI] [PubMed] [Google Scholar]
- 16.Özgen Mocan B. Baş-Boyun Kanserlerinde Görüntüleme. Turkiye Klinikleri J Med Oncol-Special Topics. 2010;3:15–22. [in Turkish] [Google Scholar]
- 17.Çabuk M, Ulusoy S, Mulazımoğlu M, et al. Boyun Kitlelerinde Sestamibi Spect ile MR Görüntüleme Yönteminin Karşılaştırılması. Tıp Araştırmaları Dergisi. 2008;6:70–76. [in Turkish] [Google Scholar]
- 18.Gordin A, Daitzchman M, Doweck I, et al. Fluorodeoxyglucose positron emission tomography/computed tomography imaging in patients with carcinoma of the larynx: diagnostic accuracy and impact on clinical management. Laryngoscope. 2006;116:273–78. doi: 10.1097/01.mlg.0000197930.93582.32. [DOI] [PubMed] [Google Scholar]
- 19.Becker M, Burkhardt K, Dulguerov P, Allal A. Imaging of the larynx and hypopharynx. Eur J Radiol. 2008;66:460–79. doi: 10.1016/j.ejrad.2008.03.027. [DOI] [PubMed] [Google Scholar]
- 20.Zbären P, Becker M, Läng H. Pretherapeutic staging of laryngeal carcinoma: clinical findings, computed tomography, and magnetic resonance ımaging compared with histopathology. Cancer. 1996;77:1263–73. doi: 10.1002/(sici)1097-0142(19960401)77:7<1263::aid-cncr6>3.0.co;2-j. [DOI] [PubMed] [Google Scholar]
- 21.Kodallı N. Baş Boyun Tümörlerinin Tedavi Sonrası Takibinde Dinamik Kontrastlı MRG. Bilgisayarlı Tomografi Bülteni. 2005;3:141–45. [in Turkish] [Google Scholar]
- 22.Engelbrecht V, Pisar E, Fürst G, Mödder U. Follow-up and diagnosis of recurrence of malignant head and neck tumors after radiochemotherapy. Comparison of computed tomography and magnetic resonance tomography. Rofo. 1995;162:304–10. doi: 10.1055/s-2007-1015887. [DOI] [PubMed] [Google Scholar]
- 23.Wong RJ. Current status of FDG-PET for head and neck cancer. J Surg Oncol. 2008;97:649–52. doi: 10.1002/jso.21018. [DOI] [PubMed] [Google Scholar]
- 24.Al-Ibraheem A, Buck A, Krause BJ, et al. Clinical Applications of FDG PET and PET/CT in Head and Neck Cancer. J Oncol. 2009;2009:208725. doi: 10.1155/2009/208725. [DOI] [PMC free article] [PubMed] [Google Scholar]