

Abstract
We studied the association between impaired glucose tolerance in midlife (IGT) and subsequent changes in longitudinal brain function by measuring resting state cerebral blood flow (rCBF) in cognitively normal older individuals. We investigated whether individuals with IGT in midlife subsequently show regionally specific longitudinal changes in rCBF relative to those with normal glucose tolerance (NGT). 64 cognitively normal participants in the neuroimaging substudy of the Baltimore Longitudinal Study of Aging (BLSA) underwent serial 15O-water positron emission tomography (15O-water PET) (age at first PET; 69.6±7.5 years) and serial oral glucose tolerance tests (OGTT) 12 years earlier (age at first OGTT; 57.2±11.1 years). Using voxel-based analysis, we compared changes in rCBF over an 8-year period between 15 participants with IGT in midlife and 49 with NGT. Significant differences were observed in longitudinal change in rCBF between the IGT and NGT groups. The predominant pattern was greater rCBF decline in the IGT group. These differences were observed in the frontal, parietal, and temporal cortices. In some of these regions, the observed changes appear to be related to increased midlife body mass index in the IGT group. Some brain regions in the frontal and temporal cortices also showed greater longitudinal increments in rCBF in the IGT group. There were no significant differences in trajectories of cognitive performance between the two groups. Our findings suggest that impaired glucose tolerance in midlife is associated with subsequent longitudinal changes in brain function during aging even in cognitively normal older individuals. These findings complement the growing evidence linking glucose dyshomeostasis with early changes in brain function in individuals at increased risk for Alzheimer’s disease and age-related cognitive decline.
1. Introduction
Abnormalities in glucose homeostasis are intrinsic to the transition from normoglycemia through impaired glucose tolerance to type-II diabetes (de Vegt, et al., 2001,Petersen and McGuire, 2005) and are also believed to mediate increased risk of cognitive impairment and all-cause dementia, including Alzheimer’s disease (AD). Numerous epidemiological studies from diverse ethnic populations have also demonstrated that type-II diabetes is an independent risk factor for AD as well as age-related cognitive decline (Ohara, et al., 2011,Schrijvers, et al., 2010,Yaffe, et al., 2012)
Despite a large number of studies suggesting an association between impaired glucose tolerance (IGT) and diabetes with cognitive impairment, the temporal relationship between these presumed risk factors for AD and longitudinal changes in brain function remains unclear. This question assumes greater relevance in the light of recent studies suggesting that targeting insulin resistance and/or promoting insulin sensitivity may be a promising approach to disease modification in patients with AD as well as a strategy for secondary prevention in at-risk individuals (Bourdel-Marchasson, et al., 2010,Watson and Craft, 2003). Understanding the influence of IGT in midlife on subsequent changes in brain function in cognitively normal older individuals is likely to provide important insights into the development of strategies aimed at interventions during the early pre-symptomatic stages of AD.
A recent functional neuroimaging study by Craft and colleagues using 18FDG-PET demonstrated reductions in cerebral metabolic rate for glucose (CMRglu) in elderly individuals with insulin resistance in a pattern similar to that observed in patients with AD and mild cognitive impairment (MCI) (Baker, et al., 2011). However, the cross-sectional design of this study did no allow the authors to investigate the association between antecedent IGT and subsequent changes in brain function over time. Similarly, the small number of individuals in this study precluded demonstration of significant inter-group differences in CMRglu between the insulin resistant and normal groups.
In the current study, we applied 15O-water PET imaging of regional cerebral blood flow (rCBF) within the neuroimaging substudy of the Baltimore Longitudinal Study of Aging (BLSA) to investigate the relationship between IGT in midlife and subsequent longitudinal changes in brain function in cognitively normal older individuals. Our hypothesis was that individuals with midlife IGT will show subsequent differential patterns of change over time in resting state rCBF relative to normoglycemic participants.
2. Methods
2.1 Subjects
The Baltimore Longitudinal Study of Aging (BLSA) began in 1958 and is one of the largest and longest-running longitudinal studies of aging in the United States (Ferrucci, 2008). The community dwelling unpaid volunteer participants are predominantly white, of upper-middle socioeconomic status, and with an above average educational level. In general, at the time of entry into the study, participants have no physical and cognitive impairment (i.e. Mini-Mental State Examination (MMSE) score ≤ 24) and no chronic medical condition with the exception of well-controlled hypertension.
The BLSA Neuroimaging sub-study (BLSA-NI) began in 1994 (Resnick, et al., 2000). BLSA participants were initially prioritized for admission to the neuroimaging study based on health considerations and the amount of prior cognitive data available for each individual. At enrollment, participants were free of central nervous system disease (e.g. epilepsy, stroke, bipolar illness, dementia), severe cardiac disease (e.g. myocardial infarction, coronary artery disease requiring angioplasty or coronary artery bypass surgery), pulmonary disease or metastatic cancer.
Participants in the current report were 64 (mean age; 69.6±7.5 years) non-demented individuals in the neuroimaging substudy of the BLSA, who underwent 15O-water PET resting-state regional cerebral blood flow (rCBF) imaging scans and oral glucose tolerance tests (OGTT). Measurement of rCBF using 15O-water PET is known to be a reliable marker of neuronal activity and we therefore used this measure as an indicator of brain function (Jueptner and Weiller, 1995). Serial OGTT data were acquired during each research visit since the entry of these participants into the BLSA. We included data from the earliest available OGTT since their entry into the study. In participants who had OGTT data from multiple visits, we averaged the 2-hour post-glucose load plasma glucose values from all available OGTT measurements.
We excluded individuals with clinical strokes and brain trauma. Data from participants meeting consensus criteria for AD (NINCDS-ADRDA) and mild cognitive impairment (MCI) were excluded from the time of onset of symptoms (McKhann, et al., 1984,Petersen, 2004). As the main focus of our current investigation was to explore the role of early abnormalities in insulin signaling on brain function rather than overt diabetes, sixteen participants in the neuroimaging substudy with a clinical diagnosis of diabetes during follow-up were excluded. This study was approved by the local institutional review board. All participants provided written informed consent prior to each assessment.
2.2. Neuropsychological testing
During each annual neuroimaging visit, participants completed a battery of neuropsychological tests evaluating six cognitive domains. Mental status was assessed with the Mini-Mental State Examination (MMSE), memory was assessed using the California Verbal Learning Test (CVLT) and Benton Visual Retention Test (BVRT). Word knowledge and verbal ability were measured using Primary Mental Abilities Vocabulary (PMA). Verbal fluency was assessed by Letter (i.e. FAS) and Category fluency tests. Attention and working memory were measured by the Digit Span Test of the Wechsler Adult Intelligence Scale-Revised, and the Trail Making Test. Digits Backward, Trails B, and Verbal Fluency (categories and letters) assessed executive function. The Card Rotations Test assessed visuospatial function. Data from evaluations at each time point were used to examine differences in change in cognitive performance over time between impaired glucose tolerance (IGT) and normal glucose tolerance (NGT) groups.
2.3 Oral glucose tolerance tests (OGTT)
Details of OGTT measurements in BLSA have been published previously (Metter et al., 2008). Briefly, participants were observed overnight in the research ward and fasted from 8 PM. They received the OGTT between 7 AM and 8 AM the next morning. Blood samples were drawn at 0, 20, 40, 60, 80, 100, and 120 minutes following an oral glucose load of 40 g/m2 body surface area. Plasma glucose concentration was measured by the glucose-oxidase method as described previously (Metter, et al., 2008). The American Diabetes Association (ADA) guidelines were adopted to define impaired glucose tolerance (IGT) and normal glucose tolerance (NGT) from the 2-hour post-glucose load concentrations of plasma glucose (IGT; 140–199 mg/dl, NGT; <140mg/dl) (American Diabetes, 2004).
2.4 PET scanning parameters
Participants underwent PET scans at baseline (year-1) and up to eight annual follow-ups. Each imaging session included a resting scan in which participants were instructed to keep their eyes open and focused on a computer screen covered by a black cloth.
PET measures of rCBF were obtained using [15O] water. For each scan, 75 mCi of [15O] water were injected as a bolus. Scans were performed on a GE 4096+ scanner, which provides 15 slices of 6.5 mm thickness. Images were acquired for 60 seconds from the time total radioactivity counts in the brain reached threshold level. Attenuation correction was performed using a transmission scan acquired prior to the emission scans.
2.5 PET data analysis
Data from PET scans obtained annually from baseline to the last available follow-up time points were used in the analyses. The PET scans were realigned and spatially normalized into standard stereotactic space and smoothed to full width at half maximum of 12×12×12 mm in the x, y, and z planes using a Gaussian filter. Next, the images were thresholded at 0.80 of the mean image intensity value of each scan to exclude peripheral signal scatter, and the rCBF values at each voxel were ratio adjusted to the mean global flow estimated from gray matter intensity values and scaled to 50 ml/100g/min for each scan to control for variability in global flow.
Using all annual scans for each subject, voxel by voxel differences in longitudinal change between the groups were assessed using group × time interactions. The mean interval between baseline and last follow-up PET scans was 7.5 (±0.9 SD) years. The results were adjusted for baseline age, sex and the interval between the last OGTT assessment and the first PET scan. In secondary analyses, we also included each of the following additional covariates separately; APOE ɛ4 carrier status body mass index (BMI), averaged over the follow-up interval of the OGTT, and the average 2-hour glucose value over the follow-up interval of the 15O-water PET studies. Analyses were performed using Statistical Parametric Mapping (SPM5; Wellcome Department of Cognitive Neurology, London, England).
In order to reduce the risk of type-I error due to multiple comparisons, we applied the following procedures. First, we adopted a statistical magnitude threshold recommended by the PET Working Group of the NIH/NIA Neuroimaging Initiative (http://www.nia.nih.gov/about/events/2011/positron-emission-tomography-working-group). Secondly, we applied a spatial extent threshold of at least 50 voxels within the regions meeting the statistical threshold of p<0.005.
2.6 MRI volumetric data analysis
Additional analyses were performed to control for the effects of potential differences in tissue volume between the two groups that could account for differences in rCBF changes. The MRI scans were segmented into gray matter, white matter and cerebrospinal fluid and spatially normalized into stereotactic space using a high-dimensional elastic warping method and a volume-preserving transformation (Shen and Davatzikos, 2002). For each participant, binary maps of the regions showing significant differences in rCBF over time between the IGT and NGT groups were registered with the MRI image. Total volumes of gray + white matter were subsequently calculated for each region. The PET data were then reanalyzed using the total tissue volume (gray + white matter) of these regions as additional covariates.
3. Results
3.1 Sample characteristics
There were no significant differences between the IGT and NGT groups in their mean age at first OGTT or first 15O-water PET-rCBF scan. The two groups were similar in sex distribution as well as duration of follow-up. There were also no significant differences between the groups in educational status or Mini-Mental State Examination scores at either baseline or the last follow- up (Table-1). Both groups contained a similar proportion of APOE ɛ4 carriers. The IGT group had a slightly greater average BMI than the NGT group over the time period when the OGTT data were acquired (27.3±3.2 and 25.5±3.0 respectively; p=0.042). The IGT group had a significantly higher average 2-hour post-glucose load plasma glucose concentration than the NGT group (152.7±10.6 mg/dl and 119.8±13.2 mg/dl respectively; p<0.0001). The diagnoses of NGT or IGT at midlife remained stable in most individuals from the time of the OGTT until the 15O-water PET studies. Thus 73% of participants in the NGT group and 87% in the IGT group maintained their diagnostic status until the time of acquisition of the rCBF data.
Table 1.
Demographic characteristics of IGT and NGT groups. Data are expressed as mean (standard deviation).
| Whole Sample | NGT | IGT | Diff (pvalue) | |
|---|---|---|---|---|
| N | 64 | 49 | 15 | |
| Sex (Females) | 26 (41%) | 19 (39%) | 7 (47%) | 0.59 |
| Age at 1st OGTT(years) | 57.2 (11.1) | 56.5 (10.6) | 59.7 (12.8) | 0.33 |
| Number of OGTTavailable | 3.6 (2.1) | 3.7 (2.1) | 3.5 (2.1) | 0.76 |
| Interval betweenfirst and lastOGTT (years) | 7.6 (6.5) | 7.7 (6.3) | 7.2 (7.5) | 0.80 |
| Intervalbetween1st OGTT and 1st PET (years) | 12.4 (6.3) | 12.7 (5.9) | 11.2 (7.8) | 0.41 |
| Interval betweenlast OGTT and 1st PET (years) | 4.8 (2.7) | 5.1 (2.8) | 4.0 (1.8) | 0.17 |
| Age at 1st PET(years) | 69.6 (7.5) | 69.2 (7.4) | 70.8 (8.0) | 0.47 |
| Education (years) | 16.1 (2.8) | 16.0 (2.6) | 16.6 (3.5) | 0.47 |
| Average 2-hrpost-glucose load plasma glucose (mg/dl) | 127.5 (18.9) | 119.8 (13.2) | 152.7 (10.6) | <.0001 |
| APOE ɛ4 carriers | 21 | 17 | 4 | 0.76 |
| Average BMI during OGTT | 25.9 (3.1) | 25.5 (3.0) | 27.3 (3.2) | 0.042 |
3.2 Neuropsychological performance
For each task or cognitive domain, a linear mixed effects model adjusting for sex and baseline age was used to compare changes in performance from baseline to the last follow-up for IGT versus NGT groups (Table-2). There were no significant intergroup differences in performance over time on any cognitive task.
Table-2.
Change over time in neuropsychological performance for IGT and NGT groups after controlling for sex and baseline age. Data are expressed as mean ± (standard error).
| Whole Sample | NGT | IGT | Diff (pvalue) | |
|---|---|---|---|---|
| CVLT Sum of 5 Immediate Recall Trials | 0.48 (0.31) 0.027 | 0.44 (0.23) 0.056 | 0.60 (0.33) 0.076 | −0.16 (0.32) 0.63 |
| CVLT Long- Delay Free Recall | 0.14 (0.057) 0.018 | 0.15 (0.061) 0.017 | 0.096 (0.090) 0.29 | 0.053 (0.089) 0.56 |
| Benton Visual Retention Test Errors | −0.14 (0.066) 0.044 | −0.14 (0.070) 0.051 | −0.13 (0.096) 0.17 | −0.0063 (0.088) 0.94 |
| CARD Rotations Total | 4.23 (0.60) <.0001 | 4.13 (0.62) <.0001 | 4.66 (0.81) <.0001 | −0.53 (0.68) 0.44 |
| Category Fluency | 0.086 (0.057) 0.14 | 0.081 (0.059) 0.17 | 0.069 (0.077) 0.38 | 0.013 (0.067) 0.85 |
| Letter Fluency | 0.16 (0.077) 0.043 | 0.15 (0.080) 0.068 | 0.18 (0.10) 0.079 | −0.032 (0.083) 0.70 |
| Trails A Seconds | −0.092 (0.18) <.0001 | −0.94 (0.19) <.0001 | −0.89 (0.29) 0.0030 | −0.046 (0.30) 0.88 |
| Trails B Seconds | −2.02 (0.55) 0.0003 | −2.02 (0.57) 0.0005 | −1.92 (0.83) 0.021 | −0.10 (0.78) 0.90 |
| MMSE | 0.017 (0.024) 0.47 | 0.018 (0.026) 0.49 | 0.012 (0.038) 0.75 | 0.0059 (0.039) 0.88 |
Indicates significant change within groups (p<0.05). For each task or cognitive domain, a linear mixed-effect model, adjusting for sex and baseline age, was used to compare changes from the baseline to the last follow-up time points for IGT versus NGT groups. For BVRT and Trails A and B tasks, positive slopes indicate improvement and negative slopes indicate decreased performance over time respectively.
3.3 Longitudinal changes in rCBF
Analysis of group differences in longitudinal change from baseline to last follow-up revealed several regions of rCBF decline that differed significantly between the IGT and NGT groups (Table-3, Figure-1). The brain regions exhibiting significantly greater rCBF decline over time in individuals with IGT included the right orbitofrontal cortex (Brodmann area; BA 11), right superior frontal gyrus (BA 9), left superior temporal gyrus (BA 22), left postcentral gyrus (BA 40), right inferior parietal lobule (BA 40) and the brainstem. Significantly greater increases in longitudinal change in rCBF in the IGT relative to NGT groups were observed in the left inferior frontal (BA 47), left middle temporal (BA 22), and left precentral (BA 6) gyri as well as the left globus pallidus. In secondary analyses we confirmed that these observed longitudinal changes in rCBF were independent of both APOE ɛ4 carrier status as well as the average 2-hour glucose values during the follow-up interval of the 15O-water PET studies. Moreover, except for the longitudinal increases in rCBF in the left globus pallidus, all observed changes in rCBF over time were also preserved after correcting for tissue volume in each of the above regions.
Table-3A.
Local maxima of regions showing greater longitudinal decreases in rCBF in individuals with impaired glucose tolerance (IGT). Coordinates are in stereotactic space and Brodmann areas are in parentheses. Asterisks indicate regions that remained statistically significant after covarying for midlife BMI.
| Coordinates | # voxels | ||||||
|---|---|---|---|---|---|---|---|
| Region | Side | x | y | z | t value | p value | |
| Orbitofrontal Cortex (11) | R | 8 | 66 | −16 | 3.55 | <0.001 | 192 |
| Orbitofrontal Cortex (11) | R | 10 | 34 | −22 | 3.27 | 0.001 | 438 |
| *Sup Frontal Gyrus (9) | R | 20 | 46 | 28 | 3.16 | 0.001 | 158 |
| *Sup Temporal Gyrus (22) | L | −58 | −42 | 18 | 3.41 | <0.001 | 274 |
| Postcentral Gyrus (40) | L | −58 | −24 | 20 | 2.98 | 0.002 | 170 |
| Inf Parietal Lobule (40) | R | 64 | −38 | 24 | 3.20 | 0.001 | 230 |
| *Brainstem | L | −10 | −34 | −30 | 3.07 | 0.001 | 140 |
Figure-1.
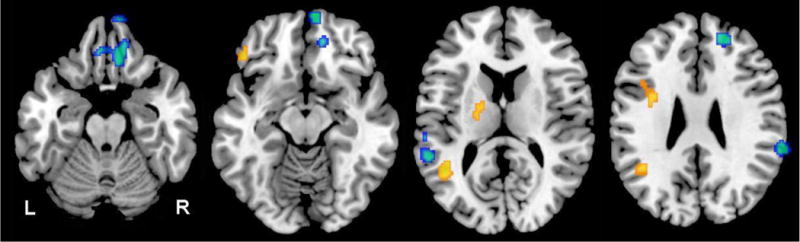
Differences in longitudinal change in regional cerebral blood flow between IGT and NGT groups. Blue areas indicate significantly greater longitudinal decreases in regional cerebral blood flow in the IGT group; yellow areas, greater longitudinal increases in regional cerebral blood flow in the IGT group; R, right; and L, left
In a subsequent analysis, when we included average BMI acquired during the OGTT as a covariate, we observed that the longitudinal decreases in rCBF within the right orbitofrontal cortex, left post-central gyrus and right inferior parietal lobule were no longer statistically significant. Regions that remained statistically significant in showing the observed longitudinal decrements in rCBF were the right superior frontal gyrus, left superior temporal gyrus and brainstem. All regions showing significant longitudinal increases in rCBF between the IGT and NGT groups in the primary analysis remained so even after covarying for average BMI. When we examined the relationship between the average BMI acquired during the OGTT and the average 2-hour glucose values over the same interval, we found that these two measures were significantly correlated (R=0.33; p=0.0069)
4. Discussion
Our main objective in the current study was to investigate whether midlife IGT is associated with subsequent longitudinal changes in brain function, assessed by serial measurements of resting state rCBF using 15O-water PET. Few studies have addressed the association of early abnormalities in insulin function with later longitudinal changes in brain function during aging in individuals who remain cognitively normal. This question assumes increasing importance in light of data from epidemiological studies that show an association between glucose dyshomeostasis and dementia, as well as emerging evidence that modulating insulin function may be a viable approach to disease modification in patients at risk for AD (Bourdel-Marchasson, et al., 2010,Ohara, et al., 2011,Schrijvers, et al., 2010,Watson and Craft, 2003,Yaffe, et al., 2012)
Our findings suggest that there are significant longitudinal changes in brain function during aging in individuals diagnosed with impaired glucose tolerance in midlife. The predominant pattern appears to be that of greater longitudinal decreases in rCBF in several brain regions including the frontal, parietal and temporal cortices in the IGT relative to NGT groups. We also observe significantly greater longitudinal increases in rCBF in some brain regions in the IGT group. Given previous evidence suggesting that IGT and diabetes are both associated with accelerated age-related cognitive decline as well as with increased risk of dementia {Ohara, 2011 #8;Schrijvers, 2010 #4;Yaffe, 2012 #11, our current findings reveal possible neural signatures associated with the modulation of cerebral function by IGT during aging.
The longitudinal changes in rCBF we observe may represent very early perturbations in brain function during aging in individuals with IGT who remain cognitively normal. However, it is also plausible that these changes represent robust compensatory responses that are recruited in order to maintain normal cognition during aging. In this context, it is interesting to compare our current findings with an earlier report where we investigated longitudinal changes in rCBF in cognitively normal older individuals carrying the APOE ɛ4 allele (Thambisetty, et al., 2010). Similar to our current observations, the predominant pattern in the previous study was greater and widespread decreases in rCBF over time in APOE ɛ4 carriers relative to non-carriers. The brain regions showing similar patterns of greater longitudinal decreases in rCBF in the “at risk” groups (i.e. IGT in the present study and APOE ɛ4 carriers in the prior report) include the right orbitofrontal cortex and left superior temporal gyrus. The corresponding rCBF declines in the IGT group and the cognitively normal APOE ɛ4 carriers in these regions suggest that changes in brain function associated with IGT may share some common mechanisms with those related to increased risk for AD in APOE ɛ4 carriers.
However, to confirm that the changes in rCBF in the IGT group were not driven by APOE genotype, we entered the APOE ɛ4 carrier status as a covariate in secondary analyses and confirmed that these results remained statistically significant. Similarly, given that midlife overweight and obesity are an independent risk factor for dementia (Xu, et al., 2011), we also entered the average BMI of the subjects obtained during their OGTT as a covariate in secondary analyses. In these analyses we find that some of the observed longitudinal decreases in rCBF in the IGT group may be related, in part to an increase in midlife BMI. However, this observation must be interpreted with caution as both BMI and the 2-hour glucose values at midlife appear to be correlated measures in our sample. Moreover, in the light of a recent study that showed regional brain atrophy associated with midlife insulin resistance (Willette, et al., 2013), we also performed a secondary analysis controlling for the effects of potential differences in brain tissue volume between the IGT and NGT groups that could account for the observed changes in rCBF. We confirmed that the observed longitudinal differences in rCBF between the IGT and NGT groups were preserved after correcting for tissue volume in each of the brain regions showing these changes.
Few previous studies have used functional neuroimaging to investigate changes in brain function associated with IGT. A recent small cross-sectional study reported an “Alzheimer- like” pattern of reduction in CMRglu associated with insulin resistance, but no significant inter- group differences in CMRglu between the IGT and NGT groups (Baker et al., 2011). Equally importantly, Craft and colleagues examined the associations between IGT and brain function concurrently (Baker, et al., 2011) and not in a longitudinal study design as in the current report.
A methodological consideration that is important in the design of our study was its focus on early abnormalities in insulin signaling, as reflected by impaired glucose tolerance. We therefore chose the 2-hour plasma glucose values from the OGTT which are thought to reflect abnormalities in insulin action rather than fasting plasma glucose values that are more indicative of abnormal insulin secretion (Carnevale Schianca, et al., 2003).
A recent study estimated that more than 35% of the US population between 60 and 74 years of age is prediabetic, highlighting the considerable public health burden conferred by insulin resistance (Cowie, et al., 2009). By excluding participants with type-II diabetes, we were able to avoid confounding effects of treatment with insulin and/or oral hypoglycemic agents on the observed longitudinal changes in rCBF. It must also be noted in this context that the BLSA represents a highly educated, healthy sample of older individuals who maintained their cognitive status during follow up. Our observed findings on rCBF changes in relation to IGT merit confirmation in future studies within samples with a higher burden of co-morbities including cardiovascular risk factors. Equally importantly, as the main focus of this study was to examine longitudinal changes in rCBF during aging, we excluded AD/MCI individuals after the onset of symptoms. Whether or not identical changes in rCBF occur in relation to midlife IGT in individuals progressing to AD/MCI remains to be addressed. A limitation that must be acknowledged in interpreting our results is that the study was not designed to delineate a clear mechanistic explanation for the observed changes in longitudinal rCBF. Although we propose that together, the decreases and increments in rCBF may be suggestive of early perturbations and/or compensatory changes respectively, in brain function in those at increased risk of diabetes and AD, this possibility remains to be conclusively established. It is also unclear whether the observed changes in rCBF associated with impaired glucose tolerance reported herein are related to established measures of AD pathology such as neuritic plaques and neurofibrillary tangles. In ongoing studies within the autopsy cohort of the BLSA (O’Brien, et al., 2009), we are studying the relationship between insulin resistance in life and severity of AD pathology assessed in post-mortem brain tissue. In this context, the recent demonstration of an “insulin resistant brain state” even in the absence of diabetes, in MCI and AD within brain regions vulnerable to AD pathology is especially relevant (Talbot, et al., 2012).
In summary, we have demonstrated that the development of impaired glucose tolerance in midlife is associated with subsequent longitudinal changes in brain function during aging even in cognitively normal older individuals. Our findings complement the growing evidence linking glucose dyshomeostasis with AD risk and age-related cognitive decline. They are also relevant to accruing data suggesting that the insulin signaling pathway may be a promising target for disease modification and prevention in those at risk for AD.
Table-3B.
Local maxima of regions showing greater longitudinal increases in rCBF in individuals with impaired glucose tolerance (IGT). Coordinates are in stereotactic space and Brodmann areas are in parentheses.
| Coordinates | |||||||
|---|---|---|---|---|---|---|---|
| Region | Side | x | y | z | t value | p value | # voxels |
| Inf Frontal Gyrus (47) | L | −48 | 36 | −14 | 3.37 | <0.001 | 116 |
| Mid Temporal Gyrus (22) | L | −44 | −54 | 18 | 4.37 | <0.001 | 452 |
| Precentral Gyrus (6) | L | −34 | −4 | 34 | 3.13 | 0.001 | 244 |
| Globus Pallidus | L | −20 | −4 | 6 | 3.02 | 0.001 | 166 |
Acknowledgments
We are grateful to the Baltimore Longitudinal Study of Aging participants and neuroimaging staff for their dedication to these studies and the staff of the Johns Hopkins University PET facility for their assistance. This work was supported in part by research and development contract N01-AG-3-2124 from the Intramural Research Program, National Institute on Aging, National Institutes of Health.
Footnotes
Disclosure statement
The authors do not have any conflicts of interest or financial disclosures to make. The data contained in the manuscript being submitted have not been previously published, have not been submitted elsewhere, and will not be submitted elsewhere while under consideration at Neurobiology of Aging. Appropriate IRB approval and procedures were used concerning human subjects. All authors have reviewed the contents of the manuscript being submitted, approved of its contents, and validated the accuracy of the data.
References
- American Diabetes A. Diagnosis and classification of diabetes mellitus. Diabetes Care. 2004;27(Suppl 1):S5–S10. doi: 10.2337/diacare.27.2007.s5. [DOI] [PubMed] [Google Scholar]
- Baker LD, Cross DJ, Minoshima S, Belongia D, Watson GS, Craft S. Insulin resistance and Alzheimer-like reductions in regional cerebral glucose metabolism for cognitively normal adults with prediabetes or early type 2 diabetes. Arch Neurol. 2011;68(1):51–7. doi: 10.1001/archneurol.2010.225. [DOI] [PMC free article] [PubMed] [Google Scholar]
- Bourdel-Marchasson I, Lapre E, Laksir H, Puget E. Insulin resistance, diabetes and cognitive function: consequences for preventative strategies. Diabetes Metab. 2010;36(3):173–81. doi: 10.1016/j.diabet.2010.03.001. [DOI] [PubMed] [Google Scholar]
- Carnevale Schianca GP, Rossi A, Sainaghi PP, Maduli E, Bartoli E. The significance of impaired fasting glucose versus impaired glucose tolerance: importance of insulin secretion and resistance. Diabetes Care. 2003;26(5):1333–7. doi: 10.2337/diacare.26.5.1333. [DOI] [PubMed] [Google Scholar]
- Cowie CC, Rust KF, Ford ES, Eberhardt MS, Byrd-Holt DD, Li C, Williams DE, Gregg EW, Bainbridge KE, Saydah SH, Geiss LS. Full accounting of diabetes and pre-diabetes in the U.S. population in 1988–1994 and 2005–2006. Diabetes Care. 2009;32(2):287–94. doi: 10.2337/dc08-1296. [DOI] [PMC free article] [PubMed] [Google Scholar]
- de Vegt F, Dekker JM, Jager A, Hienkens E, Kostense PJ, Stehouwer CD, Nijpels G, Bouter LM, Heine RJ. Relation of impaired fasting and postload glucose with incident type 2 diabetes in a Dutch population: The Hoorn Study. JAMA. 2001;285(16):2109–13. doi: 10.1001/jama.285.16.2109. [DOI] [PubMed] [Google Scholar]
- Ferrucci L. The Baltimore Longitudinal Study of Aging (BLSA): a 50-year-long journey and plans for the future. J Gerontol A Biol Sci Med Sci. 2008;63(12):1416–9. doi: 10.1093/gerona/63.12.1416. [DOI] [PMC free article] [PubMed] [Google Scholar]
- Jueptner M, Weiller C. Review: does measurement of regional cerebral blood flow reflect synaptic activity? Implications for PET and fMRI. Neuroimage. 1995;2(2):148–56. doi: 10.1006/nimg.1995.1017. doi:S1053811985710178 [pii] [DOI] [PubMed] [Google Scholar]
- McKhann G, Drachman D, Folstein M, Katzman R, Price D, Stadlan EM. Clinical diagnosis of Alzheimer’s disease: report of the NINCDS-ADRDA Work Group under the auspices of Department of Health and Human Services Task Force on Alzheimer’s Disease. Neurology. 1984;34(7):939–44. doi: 10.1212/wnl.34.7.939. [DOI] [PubMed] [Google Scholar]
- Metter EJ, Windham BG, Maggio M, Simonsick EM, Ling SM, Egan JM, Ferrucci L. Glucose and insulin measurements from the oral glucose tolerance test and mortality prediction. Diabetes Care. 2008;31(5):1026–30. doi: 10.2337/dc07-2102. [DOI] [PMC free article] [PubMed] [Google Scholar]
- O“Brien RJ, Resnick SM, Zonderman AB, Ferrucci L, Crain BJ, Pletnikova O, Rudow G, Iacono D, Riudavets MA, Driscoll I, Price DL, Martin LJ, Troncoso JC. Neuropathologic studies of the Baltimore Longitudinal Study of Aging (BLSA) J Alzheimers Dis. 2009;18(3):665–75. doi: 10.3233/JAD-2009-1179. doi:10.3233/JAD-2009-1179 C011620813403648 [pii] [DOI] [PMC free article] [PubMed] [Google Scholar]
- Ohara T, Doi Y, Ninomiya T, Hirakawa Y, Hata J, Iwaki T, Kanba S, Kiyohara Y. Glucose tolerance status and risk of dementia in the community: the Hisayama study. Neurology. 2011;77(12):1126–34. doi: 10.1212/WNL.0b013e31822f0435. [DOI] [PubMed] [Google Scholar]
- Petersen JL, McGuire DK. Impaired glucose tolerance and impaired fasting glucose–a review of diagnosis, clinical implications and management. Diab Vasc Dis Res. 2005;2(1):9–15. doi: 10.3132/dvdr.2005.007. [DOI] [PubMed] [Google Scholar]
- Petersen RC. Mild cognitive impairment as a diagnostic entity. J Intern Med. 2004;256(3):183–94. doi: 10.1111/j.1365-2796.2004.01388.x. [DOI] [PubMed] [Google Scholar]
- Resnick SM, Goldszal AF, Davatzikos C, Golski S, Kraut MA, Metter EJ, Bryan RN, Zonderman AB. One-year age changes in MRI brain volumes in older adults. Cereb Cortex. 2000;10(5):464–72. doi: 10.1093/cercor/10.5.464. [DOI] [PubMed] [Google Scholar]
- Schrijvers EM, Witteman JC, Sijbrands EJ, Hofman A, Koudstaal PJ, Breteler MM. Insulin metabolism and the risk of Alzheimer disease: the Rotterdam Study. Neurology. 2010;75(22):1982–7. doi: 10.1212/WNL.0b013e3181ffe4f6. [DOI] [PMC free article] [PubMed] [Google Scholar]
- Shen D, Davatzikos C. HAMMER: hierarchical attribute matching mechanism for elastic registration. IEEE Trans Med Imaging. 2002;21(11):1421–39. doi: 10.1109/TMI.2002.803111. [DOI] [PubMed] [Google Scholar]
- Talbot K, Wang HY, Kazi H, Han LY, Bakshi KP, Stucky A, Fuino RL, Kawaguchi KR, Samoyedny AJ, Wilson RS, Arvanitakis Z, Schneider JA, Wolf BA, Bennett DA, Trojanowski JQ, Arnold SE. Demonstrated brain insulin resistance in Alzheimer’s disease patients is associated with IGF-1 resistance, IRS-1 dysregulation, and cognitive decline. J Clin Invest. 2012;122(4):1316–38. doi: 10.1172/JCI59903. [DOI] [PMC free article] [PubMed] [Google Scholar]
- Thambisetty M, Beason-Held L, An Y, Kraut MA, Resnick SM. APOE epsilon4 genotype and longitudinal changes in cerebral blood flow in normal aging. Arch Neurol. 2010;67(1):93–8. doi: 10.1001/archneurol.2009.913. [DOI] [PMC free article] [PubMed] [Google Scholar]
- Watson GS, Craft S. The role of insulin resistance in the pathogenesis of Alzheimer’s disease: implications for treatment. CNS Drugs. 2003;17(1):27–45. doi: 10.2165/00023210-200317010-00003. [DOI] [PubMed] [Google Scholar]
- Willette AA, Xu G, Johnson SC, Birdsill AC, Jonaitis EM, Sager MA, Hermann BP, La Rue A, Asthana S, Bendlin BB. Insulin resistance, brain atrophy, and cognitive performance in late middle-aged adults. Diabetes Care. 2013;36(2):443–9. doi: 10.2337/dc12-0922. doi:10.2337/dc12-0922 dc12-0922 [pii] [DOI] [PMC free article] [PubMed] [Google Scholar]
- Xu WL, Atti AR, Gatz M, Pedersen NL, Johansson B, Fratiglioni L. Midlife overweight and obesity increase late-life dementia risk: a population-based twin study. Neurology. 2011;76(18):1568–74. doi: 10.1212/WNL.0b013e3182190d09. doi:10.1212/WNL.0b013e3182190d09 76/18/1568 [pii] [DOI] [PMC free article] [PubMed] [Google Scholar]
- Yaffe K, Falvey C, Hamilton N, Schwartz AV, Simonsick EM, Satterfield S, Cauley JA, Rosano C, Launer LJ, Strotmeyer ES, Harris TB. Diabetes, Glucose Control, and 9-Year Cognitive Decline Among Older Adults Without DementiaDiabetes and Risk of Cognitive Decline. Arch Neurol. 2012:1–6. doi: 10.1001/archneurol.2012.1117. [DOI] [PMC free article] [PubMed] [Google Scholar]