

Significance
The importance of ΔNp63 in controlling metabolism has not been investigated so far. We identified a regulatory pathway involving ΔNp63 and the glycolytic enzyme hexokinase 2 (HK2). ΔNp63 direct-dependent regulation of HK2 expression contributes to the coupling between glucose metabolism and oxidative phosphorylation, providing the energy necessary to sustain cell proliferation and protecting cells from oxidative stress. The ΔNp63–HK2axis is also present in epithelial cancer cells, suggesting that ΔNp63 could participate in cancer metabolic reprogramming.
Keywords: p63, HK2, keratinocytes, oxidative metabolism, mitochondria
Abstract
Short p63 isoform, ΔNp63, is crucial for epidermis formation, and it plays a pivotal role in controlling the turnover of basal keratinocytes by regulating the expression of a subset of genes involved in cell cycle and cell adhesion programs. The glycolytic enzyme hexokinase 2 (HK2) represents the first step of glucose utilization in cells. The family of HKs has four isoforms that differ mainly in their tissue and subcellular distribution. The preferential mitochondrial localization of HK2 at voltage-dependent anion channels provides access to ATP generated by oxidative phosphorylation and generates an ADP/ATP recycling mechanism to maintain high respiration rates and low electron leak. Here, we report that ΔNp63 depletion in human keratinocytes impairs mitochondrial basal respiration and increases mitochondrial membrane polarization and intracellular reactive oxygen species. We show ΔNp63-dependent regulation of HK2 expression, and we use ChIP, validated by p63-Chip sequencing genomewide profiling analysis, and luciferase assays to demonstrate the presence of one p63-specific responsive element within the 15th intronic region of the HK2 gene, providing evidence of a direct interaction. Our data support the notion of ΔNp63 as a master regulator in epithelial cells of a combined subset of molecular mechanisms, including cellular energy metabolism and respiration. The ΔNp63–HK2 axis is also present in epithelial cancer cells, suggesting that ΔNp63 could participate in cancer metabolic reprogramming.
The epidermis is a multilayer epithelium that continuously renews during the organism lifespan. The continuous maintenance and homeostasis of this tissue in adult life reflects the embryonic process. Indeed, specific cells of the basal layer escape upward to the outer surface during the process of terminal differentiation (1). These cells, also defined as transient amplifying (TA) cells, display a limited proliferative potential. The expression of protein markers that favor migration to the differentiation compartments, the spinous and granular layers, and finally the cornified envelope, begins after a few cell divisions (2–4). The cells undergoing terminal differentiation are replaced by the cells of the basal layer that will become new TA cells, maintaining a balance between differentiation and proliferation (1, 4). In this context, the transcription factor p63 plays a crucial role in regulating the turnover of basal keratinocytes in developing and adult epidermis (5–8). Indeed, p63−/− mice completely lack epidermis and epidermal derivatives and die within a few hours after birth (9, 10). TP63 gene is transcribed by two different promoters, giving rise to the longer isoform, TAp63, which includes the transactivation domain, and the short isoform, ΔNp63, which lacks the N-terminal transactivation domain (11, 12) but is still transcriptionally active because of a second C-terminal transactivation domain (13, 14). ΔNp63−/− mice recapitulate the epithelial and developmental defects described in the full p63−/− mice, demonstrating that ΔNp63 is the crucial isoform for epithelial systems, including the epidermis (15). Although strong evidence demonstrates the important role of ΔNp63 in maintaining the proliferative potential of epithelial cells (16), we are aware of no investigations that have probed the importance of ΔNp63 in energy metabolism in cells with a high proliferative potential, conversely, to the TAp63 isoform (17).
Aiming to expand our knowledge of ΔNp63 and cell metabolism in human keratinocytes, we found that hexokinase (HK) 2 (HK2), but not HK1, is strongly depleted in the absence of p63 and that a specific p63-binding motif is localized within the 15th intronic region of the HK2 genomic sequence, working as an enhancer. We demonstrate that HK2 is a p63 direct target gene acting as a downstream regulator of mitochondrial reactive oxygen species (ROS) generation. The p63–HK2 axis significantly enhances the coupling between glucose metabolism and oxidative phosphorylation, providing the energy to sustain cell proliferation and protecting cells from oxidative stress.
Results
p63 Silencing Induces Mitochondrial Oxidative Stress with Mitochondrial Membrane Hyperpolarization.
To determine the effect of p63 depletion in human primary keratinocytes (Hekn cells), siRNA for p63 was transfected, and the phenotypic effects were evaluated at 48 h. The analysis of the chloromethyl derivate of 2′,7′-dichlorodihydrofluorescein diacetate (CM-H2DCFDA) revealed an increased intracellular hydrogen peroxide content of ∼20% (Fig. 1A). Furthermore, p63 silencing reduced the expression of genes such as glutathione peroxidase (GPX) 2, mitochondrial superoxide dismutase (SOD2), and NADPH quinone oxidoreductase (NQO1; Fig. 1B), in keeping with oxidative stress. MitoSOX Red staining showed a 40% increase in the mitochondrial superoxide anion content (Fig. 1C) without changes in the mitochondrial mass (probed with MitoTracker Green staining) or in mitochondrial biogenesis (probed by analyzing the expression of the mitochondrial gene Nd1; Fig. S1A). EM showed normal mitochondrial morphology and no significant variation in the number of organelles (Fig. S1B). Consistently, the protein steady-state level of the electron transport chain complexes was not affected by p63 depletion (Fig. S1C), but a 25% increase in the mitochondrial membrane polarization was observed (demonstrated with J-aggregate-forming delocalized lipophilic cation (JC1) staining; Fig. 1D).
Fig. 1.

siRNA-mediated p63 silencing induces mitochondrial oxidative stress and increases mitochondrial membrane polarization. (A) To determine the intracellular H2O2 level, 10 μM CM-H2DCFDA was used 48 h after transfection. The histogram shows the relative quantification of the emission signal of the fluorescein probe compared with the control (Scr; siRNA). (B) mRNA expression by real-time quantitative PCR (qPCR) of oxidative stress genes: mitochondrial SOD2, GPX2, and NQO1. p63 mRNA is shown as a transfection control. (C) MitoSOX Red analysis by flow cytometry was performed 48 h after p63 depletion to assay mitochondrial superoxide anion levels (Left), and the increase in fluorescence intensity (labeled “M”) was quantified as shown in the histogram. The Western blot (Right) shows p63 silencing efficiency at the protein level. Tubulin was used as a loading control. (D) FACS analysis of JC1 staining was performed under the same conditions of MitoSOX Red and CM-H2DCFDA (48 h after transfection) to determine changes in the mitochondrial membrane polarization. The upper right quadrants of the dot plots collect cells positive for mitochondrial JC1 aggregates related to polarized mitochondria. The red fluorescence signal decrease correlates with JC1 monomer accumulation in the cytoplasmic compartment corresponding to depolarized mitochondria. Gate R was assessed to analyze highly polarized mitochondria, and the histogram (Right) is the relative quantification of JC1 spectral emissions (FL2-H/FL1-H ratio). The FACS results are shown as the mean ± SD from three independent experiments. All data are shown as the mean ± SD from three independent experiments (*P < 0.01 and *P < 0.001).
Fig. S1.

siRNA-mediated p63 silencing does not affect mitochondrial complex protein levels, mitochondrial mass, and mitochondrial biogenesis in primary human keratinocytes. (A) MitoTracker Green staining of Hekn reveals substantially unaltered mitochondrial content between Scramble and sip63 cells (Upper) as well as qPCR relative to mitochondrial DNA copy number (Lower) showing no changes in mitochondrial biogenesis. The latter analysis was carried out measuring the expression level of a mitochondrial gene (Nd1; not significant) compared with a single copy number nuclear gene (globin 1). (B) EM images of Scramble and sip63 human keratinocytes show no obvious differences in mitochondrial number and morphology. Arrows point to individual organelles. (C) OXPHOS antibody mixture was used to check the mitochondrial respiratory chain complex protein levels. Total extracts from Scramble and sip63 were collected 48 h after transfection and analyzed by usual immunoblot. Labels on the right side specify the identity of the bands. VDAC was used as mitochondrial protein control.
p63 Depletion Reduces Oxygen Consumption and Unbalances Energetic Demand Through the Glycolytic Pathway.
We then evaluated oxidative metabolism, keeping in mind that p53 regulates aerobic respiration through several pathways (18, 19). We found that p63-depleted cells had a significantly reduced oxygen consumption rate (OCR; Fig. 2A). As shown in Fig. 2A, the OCR profile of sip63 samples was similar to the control, supporting the idea that mitochondria retain sensitivity to environmental stress. However, the relative quantification of OCR corresponding to the single stages of the analysis showed an inability to rely on aerobic respiration (histogram in Fig. 2A). As shown in Fig. 2B, oligomycin injection induced anaerobic metabolism in the control cells, as observed by the increased extracellular acidification rate (ECAR). Although sip63 cells showed a similar response pattern, leading to an increase of ECAR from the basal respiration (BR) stage to the uncoupling respiration (UR) stage (Fig. S2A), they failed to rescue the control cells that were unable to rely on the glycolytic pathway. To further investigate this finding, we performed a metabolomic profile of glycolytic intermediates through gas and liquid chromatography/MS (Fig. 2C and Fig. S2B). The glucose concentration doubled 48 h after transfection (Fig. 2C). Importantly, the intracellular ADP level was significantly increased, and the production of lactate was not enhanced, whereas other biochemicals (phosphoenolpyruvate, glucose-6-phosphate, fructose-6-phosphate) significantly increased (Fig. S2B). We correlated this result with the ECAR measurements, supporting the idea of the inability of p63-depleted cells to redirect metabolism. Finally, the reduction of intracellular ATP confirmed this hypothesis (Fig. 2C, Right).
Fig. 2.

p63-depleted keratinocytes display deficiency in mitochondrial oxygen consumption and inability to balance energetic demand through the glycolytic pathway. OCR (A) and ECAR (B) performed in 24-well Seahorse assay plates show the cellular respiration profile after treatment with the drugs oligomycin (“O,” 0.5 μM), FCCP (“F,” 0.4 μM), and rotenone (“R,” 1 μM). The curves (A and B, Left) are representative of three independent experiments, each expressed as the mean ± SD normalized to the cell number. The relative quantification of the area below the curves corresponding to the stages labeled with BR, UR, and MR are shown in histograms (A and B, Right). (C) Metabolic profile of the glycolytic pathway was carried out by Metabolon as described in SI Materials and Methods. The values for each metabolite are normalized to the protein content, and the average of the distribution is represented by the cross symbol within the box. Statistical significance was assessed by Welch t tests, and red boxes are representative of P < 0.05 (asterisk). The ATP levels of Hekn cells after 48 h of siRNA transfection were normalized to the cell number and are reported as relative quantification to the Scramble transfected sample (*P < 0.05). The Western blot shows the efficiency of transfection displaying tubulin as a loading control.
Fig. S2.
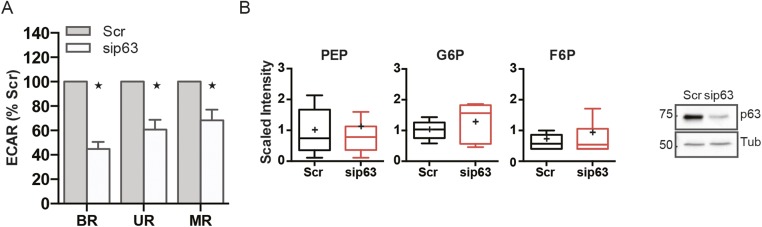
p63 depleted keratinocytes display deficiency in mitochondrial oxygen consumption and inability to balance energetic demand through the glycolytic pathway. (A) Relative quantification of ECAR displayed in Fig. 2 (Left). Histogram illustrates the stages labeled with BR, UR, and MR according to the drug injection, as described in Fig. 2. (B) Metabolic profile of glycolytic pathway was carried out by Metabolon as described in SI Materials and Methods. Values for each metabolites are normalized to protein content, and the average of the distribution is represented by the cross symbol within the box. Statistical significance was assessed by Welch t tests, and red boxes are representative of P < 0.05. Western blot shows the efficiency of transfection displaying tubulin as loading control.
HK2 Is a p63 Direct Target Gene.
To find a molecular mediator downstream of p63 that supports mitochondrial function, we examined the expression of a large cohort of mitochondrial genes. As shown in Figs. 1B and 3A, we observed that the transcription of most of the GPXs was strongly affected and that the expression of cytochrome c oxidase synthase and cyclooxygenase 2, also known as prostaglandin-endoperoxide synthase, were impaired by p63 knockdown. Surprisingly, of the two main regulators of glycolysis, HK1 and HK2, only HK2 mRNA was strongly down-regulated (Fig. 3B). The 80% HK2 transcriptional repression was consistent with a reduced amount of the steady-state protein level (Fig. 3B). HK2 contains a mitochondria-targeting domain that allows the interaction of the cytoplasmic enzyme with the voltage-dependent anion channel (VDAC)/adenine nucleotide translocase channel.
Fig. 3.

HK2 is a p63 direct target gene. Real-time qPCR of oxidative stress genes (A) and HK2 mRNA (B) was performed after 48 h of sip63 transfection in human keratinocytes. The data are representative of three independent measurements and consistent with an 80% decrease of HK2 transcription (*P < 0.01). Western blot was carried out to assess HK2 protein level in the same conditions. VDAC and tubulin are shown as mitochondrial and cytoplasmic loading controls, respectively. (C) The HK2 gene structure shows the presence of a putative p63 responsive element (i.e., REIII) in the 15th intron of the genomic sequence. (D) Luciferase assay shows ΔNp63α-meditated transactivation of REIII of HK2 gene in 293E cells. The sequences corresponding to REI, REII, REIII and REIII mutant counterparts were inserted into a Luc reporter-containing pGL3 promoter vector, and the selectivity of the transactivation was tested by using constructs for ΔNp63α and p53. The K14 promoter was used as a positive control. Luc activity was assessed as the mean ± SD of three independent experiments (*P < 0.05 and **P < 0.01). (E) ChIP analysis performed in Hekn shows physical binding of the ΔNp63α transcription factor to the HK2 intronic region REIII. ChIP on the K14 promoter was used as a positive control.
Based on the previous results, we investigated whether HK2 could be a p63 direct target gene. Molecular analysis showed two p53 responsive elements in the HK2 promoter (Fig. 3C), and a previous report demonstrated that a sequence from the rat HK2 promoter could be controlled by p53 (20). A sequence of ∼1,200 bp upstream of the transcription start site that contained the p53 responsive elements (REs) I and II was cloned into a pGL3-promoter vector containing the luciferase reporter gene. In our experimental set, neither p53 nor p63 transactivated the human promoter (Fig. 3D), but a further investigation of the genomic sequence, taking advantage of the genomewide p63 ChIP-Seq profiles in human keratinocytes from a previous study (21, 22), noted a specific p63 binding element in the 15th intronic region of the genomic sequence (Fig. 3C and Fig. S3A). This p63 binding element seemed to be an active enhancer, as it is colocalized with the active enhancer mark H3K27ac (Fig. S3A).
Fig. S3.

DNA binding of p63 at the HK2 locus. (A) Screenshot of University of California, Santa Cruz, genome browser shows the RNA-seq, the p63 binding, and the active enhancer mark H3K27ac profiles (the upper three blue tracks from top to bottom) at the HK2 locus on chromosome 2 detected in a human primary skin keratinocyte line (22). The H3K27ac active enhancer mark is colocalized with the p63 binding element in the 15th intron of HK2, consistent with the active transcription of HK2 in these cells shown by RNA-seq data. The activity of this enhancer in human epithelial keratinocytes is also confirmed by enhancer marks, H3K4me1 and H3K27ac, identified by the ENCyclopedia Of DNA Elements (ENCODE) consortium (the lower two purple tracks).
Luciferase assay analysis of ∼600 nt of the related sequence (REIII) showed that p63 enhances the luciferase activity by ∼18 fold, whereas p53 showed a lower, fivefold enhancement and transactivating function (Fig. 3D and Fig. S4). Finally, REIII-specific mutagenesis abolished luciferase activity, demonstrating the specificity of the sequence. Next, to validate the result of the ChIP-Seq, we performed a ChIP assay in our cells and demonstrated a physical interaction between p63 and the HK2 intronic region (Fig. 3E). To verify if ΔNp63 contributed to HK2 transcription in epithelial cancer cells, we repeated selected experiments by using the breast cancer cell line HCC1937, which expresses ΔNp63 at high level. First, we observed that, in HCC1937 cells, p63 knockdown strongly reduced HK2 at the mRNA (55% reduction) and protein levels (Fig. S5 A and B). Second, we demonstrated by ChIP that ΔNp63 specifically binds this previously unidentified intronic enhancer (Fig. S5C), with the MTSS1 gene used as positive control (23). These data clearly demonstrated that ΔNp63, binding the identified enhancer, significantly contributes to HK2 transcription in human keratinocytes and in the HCC1937 breast cancer cell line.
Fig. S4.

Expression of ΔNp63 and p53 in luciferase assay experiment. Western blot shows that ΔNp63 and p53 are expressed at the same level in each samples in 293E cells transiently transfected to perform the luciferase assay shown in Fig. 3D.
Fig. S5.

ΔNp63–HK2 axis is present also in HCC1937 breast cancer cell line. HCC1937 expresses a high level of ΔNp63. (A) ΔNp63 silencing results in ∼50% reduction in HK2 mRNA whereas HK2 protein is almost undetectable (B). (C) ChIP confirms that ΔNp63 physically binds in HCC1973 cells the enhancer region identified in the HK2 15th intron. Unlike normal epithelial cells, in cancer cells, HK2 has no preventive antioxidant effect as a result of its ADP-recycling activity, which is in line with the metabolic reprogramming occurring in cancer cells, in which aerobic glycolysis in preferred and there is reduction in mitochondrial respiration capacities. Cellular ROS (D, CM-DCFDA) and mitochondrial superoxide (E, MitoSOX Red) do not change upon introduction of siHK2. Interestingly, knockdown of HK2 results in a higher polarization of the mitochondrial membrane compared with the control (F). The data are the average of three independent experiments (mean ± SD; n = 3; *P < 0.01).
HK2 Knockdown Phenocopies p63 Silencing.
To explore the biological relevance of the p63–HK2 axis sustaining oxidative metabolism in human keratinocytes, we sought to verify whether HK2 silencing could phenocopy the biological effects of p63 silencing. Indeed, HK2 silencing, as shown by the OCR and ECAR profiles, resembled the patterns of p63 silencing (Fig. 4A). Interestingly, the extent of mitochondrial impairment was similar in both treatments, demonstrating the crucial role of the glycolytic enzyme HK2 in metabolic effects mediated by p63. The mitochondrial superoxide anion level was strongly increased, and JC1 staining indicated a higher polarization of the mitochondrial membrane compared with the control (Fig. 4B). Finally, HK2 silencing reduced 5-ethynyl-2′-deoxyuridine (EdU) incorporation, leading to an approximate 40% reduction of cell proliferation (Fig. 4C). This observation is consistent with a previous report that p63 inhibited the proliferative capacity of basal keratinocytes and induced the arrest of the cell cycle in G1 phase (24). Furthermore, the colony formation capacity was strongly impaired (Fig. 4C). All together, these results highlight the importance of the aforementioned p63–HK2 axis as a branch of the orchestrated program through which p63 regulates cell metabolism and proliferation in human keratinocytes. Although cancer cells present mitochondria dysfunction and reduction in mitochondrial respiration capacities as a result of metabolic reprogramming, we found an effect upon HK2 knockdown in HCC1937 (Fig. S5 D–F) in terms of JC1 staining, indicating that, similarly to p63, siHK2 results in a higher polarization of the mitochondrial membrane compared with the control (Fig. S5 E and F).
Fig. 4.

Human keratinocytes silenced for HK2 phenocopy p63-depleted cells. (A) Real-time measurements (mean ± SEM; n = 3; *P < 0.01) of OCR were performed as in Fig. 2 after 48 h of p63 and HK2 silencing (Left). The relative quantification of OCR and ECAR evaluated as percentage of control (Scr) are displayed in histograms (Middle and Right). (B) MitoSOX Red and JC1 staining confirm the similarities between sip63 and siHK2 phenotypes. Silencing HK2 in Hekn resembles the increase of superoxide anion levels and mitochondrial membrane polarization observed in p63-depleted cells (mean ± SD; n = 3; *P < 0.01). (C) HK2-depleted keratinocytes display reduced proliferative potential. EdU staining by flow cytometry demonstrates a 50% reduction of proliferation 48 h after Hekn transfection (Left). A clonogenic assay that transfected human keratinocytes with the Scramble control and siHK2 confirms a reduction in colony formation after 12 d of culture. The micrographs shown are representative images of one of three independent experiments.
Finally, we investigated the possibility for cross-talk between p53 and the HK1 isoform in the p63–HK2 axis in keratinocytes. p53 silencing after 48 h of transfection did not affect mitochondrial function, and no evidence of increased ROS production and membrane polarization were observed (Fig. S6). Furthermore, p53 depletion did not compromise cell proliferation, suggesting that basal keratinocytes rely mainly on p63 function for the regulation of proliferation and differentiation, whereas they activate p53 only in response to external injury and damage (e.g., UV damage). Finally, we found that p63 silencing did not affect HK1 expression at the mRNA and protein levels (Fig. 3A and Fig. S6D), excluding the possibility of a direct interaction between p63 and other HK variants. Consistently, HK1 depletion reduced the mitochondrial oxygen consumption capacity to a lower extent compared with HK2 silencing and, strikingly, did not affect the ability of human keratinocytes to redirect the metabolic program to the glycolytic pathway (Fig. S6A). These findings suggest that, in the absence of HK1, HK2 can compensate for the cellular defects. The reduction of cell proliferation in siHK1 cells was ascribed to the inversion of the metabolism from the high ATP yield of mitochondrial respiration to the low ATP yield of the anaerobic pathway. Finally, the observation that the mitochondrial ROS after HK1 depletion did not mirror the increased oxidative stress seen in HK2-depleted cells led us to conclude that proliferating keratinocytes rely on the p63–HK2 axis to sustain mitochondrial oxidative metabolism.
Fig. S6.

Human keratinocytes silenced for HK2 phenocopy p63-depleted cells. (A) Real-time measurements of OCR and ECAR after 48 h of p63, p53, HK1, and HK2 silencing. Histograms show the relative quantification corresponding to the stages BR, UR, and MR following treatment with the drugs as described in Fig. 2. (B and C) Flow cytometry analysis was performed following transient transfection with siRNA targeting: p63, p53, HK1, and HK2. Histograms show MitoSOX Red, CM-H2DCF-DA, and JC1 analysis (B) and EdU staining (C) expressed as fold over Scramble percentage (mean ± SD; n = 3; *P < 0.01). (D) Immunodetection of p63, HK1, HK2, and p53 as silencing control.
Overexpression of HK2 cDNA Protects Human Keratinocytes from the Mitochondrial Dysfunction Induced by p63 Depletion.
To quantify the HK2 dependency of this p63 function, we decided to restore HK2 protein levels in p63-depleted keratinocytes to evaluate a possible rescue of the mitochondrial impairment. Viral ectopic expression of HA-HK2 cDNA almost restored the rate of oxygen consumption to the control values (Fig. 5 A–C). In detail, we observed a significant partial recovery of BR, probably because of the destabilization induced by the absence of p63, but we found that, after oligomycin injection, HK2 fulfilled the role of a metabolic inverter, enhancing the rate of acidification of the medium. In addition to this observation, in HK2-supplemented cells, after carbonyl cyanide p-trifluoro-methoxyphenyl hydrazone (FCCP) injection, the spare respiratory capacity was restored to normal levels, underlining the contribution of HK2 in helping mitochondria to perform electron transport at the maximal rate. Furthermore, we measured a strong decrease in mitochondrial superoxide anion production (Fig. 5B), suggesting that mitochondrial ROS are upstream effectors of mitochondrial impairment and related side effects. Proliferation was not rescued by HK2 reintroduction, as indicated by phospho-H3 Western blot (Fig. 5C), indicating that keratinocytes rely mainly on p63 function for proliferation.
Fig. 5.

Overexpression of HK2 cDNA protects human keratinocytes from mitochondrial dysfunction induced by p63 depletion. After 24 h of sip63 transfection, HK2 cDNA was introduced into human keratinocytes by retrovirus infection. (A) OCR and ECAR (mean ± SEM; n = 3) measurements after 48 h of viral infection. Histograms show the relative quantification corresponding to the different stages of cellular respiration (BR, UR, and MR) related to the injection of the drugs (“O,” “F,” “R”), as described in Fig. 2 (*P < 0.05 and **P < 0.01). (B) The MitoSOX Red profile (Left) shows fluorescence emission collected in the FL2-H channel after 48 h of viral infection. Relative quantification is presented in a histogram (Right) as described in Fig. 1 (*P < 0.01). (C) Protein lysates were collected to verify viral infection of Hekn cells. Western blots show the rescue of HK2 protein levels in p63-depleted keratinocytes after expression of the HA-HK2 cDNA construct. The exogenous protein was detected by using anti-HA antibodies, whereas HK2 knockdown was confirmed by using anti-HK2 antibodies. Proliferation was evaluated by using anti–phospho-H3 staining. GADPH was used as a loading control. (D) A schematic summary representing the biological effects of the p63–HK2 axis in human keratinocytes. p63 sustains the proliferative state of basal cells partially through the coupling of glucose metabolism and mitochondrial function. (Lower) Detailed model of the mitochondrial state in the presence or absence of p63.
We reported earlier that p63 regulates a subset of oxidative stress genes such as mitochondrial SOD2. Importantly, this enzyme is responsible for the dismutation of the superoxide anion in oxygen and hydrogen peroxide. Because we observed a reduction of the superoxide anion levels, in the context of reduced expression of SOD2 after HK2 restoration, we postulate that the recovery of mitochondrial activity is the crucial factor preventing secondary superoxide anion formation. Finally, the data presented here elucidate a mechanism through which HK2 acts as a p63 downstream target gene in sustaining proliferating keratinocytes (Fig. 5D). Of note, we proposed that p63 displays its role of master regulator involving the recruitment of a metabolic enzyme whose function is to enhance the coupling between glucose metabolism and mitochondrial function.
SI Materials and Methods
RNA Extraction, mtDNA Extraction, and qRT-PCR.
RNA extraction was performed by using the RNeasy Mini Kit (Qiagen). In sum, 500 ng of total RNA was used for reverse transcription by using the InPromII Reverse Transcription System (Promega) following the manufacturer’s protocol. The resulting cDNAs were used as templates for qRT-PCR. mtDNA extraction was performed following organic extraction with phenol/chloroform/isoamyl alcohol (25:4:1) of cell lysates (lysis buffer composition and treatment: NaCl 75 mM, Tris⋅HCl 50 mM, pH 8.5, EDTA 5 mM, SDS 1%, proteinase K 500 μM; 2 h at 55 °C, 10 min at 95 °C). The aqueous phase was collected and subjected to a second organic extraction with chloroform, and, finally, DNA precipitation was carried out with isopropanol. The mtDNA copy number was analyzed by qRT-PCR measuring the expression of the mitochondrial gene Nd1. Real-time PCR was performed using the Platinum SYBR Green qPCR SuperMix UDG (Invitrogen), with the following amplification conditions: one cycle of 3 min at 95 °C and 40 cycles of 20 s at 94 °C and 40 s at 59 °C. The PCR was monitored by a melting curve protocol according to the specifications of the ABI 7500 instrument (Applied Biosystems). Human TATA box binding protein was used as a housekeeping gene for quantity normalization in gene expression experiments, and human Globin1 (single copy nuclear gene) was used as an endogenous control for mtDNA copy number assessment. Relative quantification of gene expression was calculated according to the 2−ΔΔCt method described in the ABI User Bulletin no. 2 (updated October 2001) and the RQ software version 1.3 from Applied Biosystems. The primer pairs used in the PCR reactions are reported in Table S1.
Table S1.
Primer pairs used in PCR reactions
| Primer | Sequence |
| p63 REs cloning | |
| REI-II forward | 5′-GGGGGCTAGCCAGTTGGAGGTCATTTGGCAAAG-3′ |
| REI-II reverse | 5′-GGGGCTCGAGGTGGAACTGATGGATTTGGCTG-3′ |
| REIII forward | 5′-GAATCAAGTAGCAATTCCTTTCCC-3′ |
| REIII reverse | 5′-GCCTCGGAAGAGTAGTCCACGC-3′ |
| mutREIII forward | 5′-GTTCTATCTCAGTACATCCCTCC-3′ |
| mutREIII reverse | 5′-GGAGGGATGTACTGAGATAGAAC-3′ |
| ChIP | |
| Forward | 5′-GAATCAAGTAGCAATTCCTTTCCC-3′ |
| Reverse | 5′-GCCTCGGAAGAGTAGTCCACGC-3′ |
| qPCR | |
| hHK2 forward | 5′-CTCTGAGCCTGATCCTCTG-3′ |
| hHK2 reverse | 5′-CGGTTGTACAGTTTTGGGAC-3′ |
| hHK1 forward | 5′-GGAAGCAGACGCACAACAATG-3′ |
| hHK1 forward | 5′-TCCCACTACGGATTTTCACCA-3′ |
| hCOX2 forward | 5′-ATCCCCTTCTGCCTGACACCT-3′ |
| hCOX2 reverse | 5′-ACATTCCTACCACCAGCAACC-3′ |
| hNQO1 forward | 5′-AAGAAGAAAGGATGGGAGGTG-3′ |
| hNQO1 reverse | 5′-GACTCGGCAGGATACTGAAAG-3′ |
| hSCO2 forward | 5′-ATGAGGACCAGGACTACATCG-3′ |
| hSCO2 reverse | 5′-TCAAGACAGGACACTGCGGAA-3′ |
| hSOD2 forward | 5′-TGGCTTGGTTTCAATAAGGAA-3′ |
| hSOD2 reverse | 5′-AGCGTGCTCCCACACATCAAT-3′ |
| hGPX1 forward | 5′-ACGATGTTGCCTGGAACTTT-3′ |
| hGPX1 reverse | 5′-TCGATGTCAATGGTCTGGAA-3′ |
| hGPX2 forward | 5′-TAAGTGGGCTCAGGCCTCTCT-3′ |
| hGPX2 reverse | 5′-GGTCATAGAAGGACTTGGCAA-3′ |
| hGPX3 forward | 5′-ACAGGAAGAGCTTGCACCAT-3′ |
| hGPX4 reverse | 5′-CTCCTGGTTCCTGTTTTCCA-3′ |
| hGPX4 forward | 5′-CAGTGAGGCAAGACCGAAGT-3′ |
| hGPX4 reverse | 5′-CTGCTTCCCGAAGTGGTTAC-3′ |
| hΔNp63 forward | 5′-GAAGAAAGGACAGCAGCATTGA-3′ |
| hΔNp63 reverse | 5′-GGGACTGGTGGACGAGGAG-3′ |
| hTBP forward | 5′-TCAAACCCAGAATTGTTCTCCTTAT-3′ |
| hTBP reverse | 5′-CCTGAATCCCTTTAGAATAGGGTAGA-3′ |
| hNd1 forward | 5′-ACGCCATAAAACTCTTCACCAAAG-3′ |
| hNd1 reverse | 5′-GGGTTCATAGTAGAAGAGCGATGG-3′ |
| hGlobin forward | 5′-GCTGTTCTGTCAATAAATTTCC-3′ |
| hGlobin reverse | 5′-CGAGTAAGAGACCATTGTGGCAG-3′ |
| HA-HK2 cDNA cloning | |
| HK2 forward | 5′-CCGGAAGCTTATGGCTTACCCATACGATGTTCCAGATTACGCTATTGCCTCGCATCTGCTTGCC-3′ |
| HK2 reverse | 5′-GGCCGCGGCCGCCTATCGCTGTCCAGCCTCACG-3′ |
FACS Analysis, Clonogenicity Assay, and ATP Viability Assay.
The human epidermal keratinocytes were trypsinized and solubilized with DMSO and CM-H2DCFDA (10 μM; Invitrogen), MitoSOX Red (5 μM; Invitrogen), MitoTracker Green (1 μM; Invitrogen), and JC1 (0.2 μM; Invitrogen) 48 h after transfection. The cells were incubated for 20 min at 37 °C to allow the permeabilization of the probes, and were analyzed by flow cytometry acquiring 15,000 events per sample. In detail, the CM-H2DCFDA fluorescent signal was collected in the FL1-H channel, MitoSOX Red in the FL2-H channel, MitoTracker Green in the FL1-H channel, and JC1 in both FL1-H and FL2-H channels to check for fluctuations in the mitochondrial membrane polarization according to the conformational status of the probe. Particularly, the JC1 FL2-H signal correlates with probe aggregates within the polarized mitochondria, whereas the JC1 FL1-H signal corresponds to probe monomers dissolved in the cytoplasm as a result of the depolarization of mitochondria. The FL2H/FL1-H ratio was used to express changes in mitochondrial membrane polarization. For the proliferation assay 48 h after transfection, the cells were pulse-labeled for 4 h with 10 μM of the BrdU analog EdU and then processed with the Click-iT EdU Alexa Fluor-488 Flow Cytometry Assay Kit (C35002; Invitrogen), acquiring 15,000 cells per sample. The statistical analysis was carried out with CellQuest acquisition/analysis software by using a FACSCalibur flow cytometer (BD Biosciences).
For the clonogenicity assay, 48 h after transfection, human keratinocytes were trypsinized, and 2.5 × 10³ cells were plated with 2 × 10⁵ NIH 3T3 fibroblasts, previously treated with 10 μg/mL mitomycin C (Sigma). The cells were cultured in 60% (vol/vol) DMEM, 30% (vol/vol) Ham F-12, 10% (vol/vol) FBS, 24.3 μg/mL adenine, 5 μg/mL insulin, 0.4 μg/mL hydrocortisone, and 10−10 M cholera toxin. Three days after seeding, 10 ng/mL EGF was added to the culture medium. After 12 d, the colonies were fixed in a 4% (wt/vol) formaldehyde solution and visualized by rhodamine staining followed by extensive washing.
ATP was measured by using the CellTiter-Glo luminescent assay according to the manufacturer’s instructions (Promega). Briefly, 48 h after transfection, the cells were counted and then treated with the CellTiter-Glo reagent. After 10 min of incubation at room temperature, the luminescent signal was measured by using a Wallac Victor2 1420 Multilabel counter (Perkin Elmer).
EM.
After 48 h of transient silencing, Hekn cells were fixed in 2% (wt/vol) glutaraldehyde in 0.1 M sodium cacodylate buffer (pH 7.4) at 4 °C overnight and postfixed with 1% osmium tetroxide/1% potassium ferrocyanide for 1 h at room temperature. After fixation, the cells were stained with 5% (wt/vol) aqueous uranyl acetate overnight at room temperature, dehydrated, and embedded in epoxy resin (Taab Laboratories Equipment). EM images of ultrathin sections were recorded by using an ES1000W CCD camera and DigitalMicrograph software (Gatan) with a Zeiss 902A electron microscope.
Luciferase Assay.
The HK2 sequences within the promoter region (1,243 nt ranging from −4008 bp to −2765 bp) and within the 15th intron region (576 nt located in chromosome GRCh37:2:75114706–75115280) were amplified by PCR from human keratinocyte genomic DNA and subcloned into the pGL3-Promoter reporter vector (containing the firefly luciferase gene) previously linearized by NheI/XhoI and NheI/HindIII restriction (Promega), respectively. The resulting constructs were identified as REI–II and REIII. Finally, a mutant of construct REIII (mutREIII) was carried out by site-specific substitution. The primers used are reported in Table S1.
For the luciferase assay, a total of 2 × 10⁵ HEK 293E cells were seeded in 12-well dishes 24 h before transfection. In addition to the pcDNA HA-ΔNp63α and pcDNA HA-p53 expression vectors, 10 ng of the pRL-CMV-Renilla luciferase vector (Promega), 100 ng of the pGL3 promoter reporter vectors, and 300 ng of the pcDNA-HA empty vector were cotransfected by using the Effectene transfection reagent according to the manufacturer’s instructions (Qiagen). Luciferase activities of cellular extracts were measured 24 h after transfection by using a Dual Luciferase Reporter Assay System (Promega). Light emission was measured over 10 s by using a Lumat LB9507 luminometer (EG&G Berthold). The efficiencies of transfection were normalized by using Renilla luciferase activity.
Metabolomic Profile.
The metabolomic profile was performed by Metabolon. Briefly, at the time of analysis, the samples were extracted and prepared for analysis by using Metabolon standard solvent extraction method. The extracted samples were split into equal parts for analysis on the gas chromatography/MS and liquid chromatography/MS/MS platforms. Also included were several technical replicate samples created from a homogeneous pool containing a small amount of all the study samples. The general platform methods and statistical analyses are described (49).
Retroviral Vector Generation and Infection.
Retroviral particles encoding for HA-HK2 cDNA were produced by cotransfection of packaging GP-293 cells (Clontech) with the LZRSpBMN empty vector or LZRSpBMN-HA-HK2 together with the VSVG-expressing vector by FuGENE (Roche). The virus-containing medium was collected and supplemented with 8 μg/mL Polybrene (Sigma) 24 h after the siRNA-mediated transfection of Hekn cells. The cells were then infected by replacing the cell culture medium with viral supernatant for a pulse of 5 h. The infection procedure was repeated for a second time after 12 h of recovery in cell culture medium without virus. Seahorse analysis and FACS analysis were performed 24 h after the second pulse of infection. HK2 cDNA was obtained from Hekn total RNA. The primer pairs used for cloning are reported in Table S1. The forward primer was designed to allow the insertion of an HA-tag downstream in the HindIII restriction site, whereas the reverse primer contains the NotI restriction sequence.
Western Blotting.
Total cell extracts were resolved on SDS polyacrylamide gels and blotted onto Hybond PVDF membranes (GE Healthcare). The membranes were blocked with PBS solution with 0.1% (vol/vol) Tween-20, 5% (wt/vol) nonfat dry milk, incubated with primary antibodies for 2 h at room temperature, washed, and hybridized with peroxidase-conjugated secondary antibodies for 1 h (goat anti-rabbit or goat anti-mouse; Bio-Rad). Detection was performed with the ECL chemiluminescence kit (Perkin Elmer). The antibodies used were anti-p63 (clone Y4A3; P3362; 1:1,000; Sigma), anti-p53 (DO-1; sc-126; 1:1,000; Santa Cruz Biotechnology), anti-HK1 (C35C4; 1:1,000; Cell Signaling), anti-HK2 (1:1,000; C64G5; Cell Signaling), anti–β-actin (A5441; 1:50,000 dilution; Sigma), anti–β-tubulin (1:10,000; T8328; Sigma), anti-GADPH (1:5,000; G8795; Sigma), and oxidative phosphorylation (OXPHOS) mixture antibody (1:1,000; MS604; MitoScience), and anti–phospho-H3 (Ser10; D2C8; 1:1,000; 3377S; Cell Signaling).
ChIP.
A total of 2 × 10⁵ proliferating HEKn/HCC1937 cells were used for the immunoprecipitation reaction. To perform the ChIP assay, a MAGnify ChIP system (Invitrogen) was used according to the manufacturer’s instructions. Chromatin fragmentation was carried out by sonication of cell extracts by using a Bioruptor UCD-200 (Diagenode) at high power for 30-s “on”/30-s “off” cycles for 16 min. Immunoprecipitation was performed using 10 µg of H129 anti-p63 antibody (Santa Cruz Biotechnology). Rabbit IgGs were used as a negative control. DNA purified after ChIP was used as the template for later PCR reactions. We used two sets of primers; the primers flanking the p63 responsive element (i.e., REIII) in the human HK2 15th intron region are reported in Table S1. Primers for ChIP analysis of MTSS1 were designed as in previous study (23).
Discussion
In the present study, we used primary keratinocytes as an experimental model to describe a ΔNp63-dependent regulatory mechanism of cell metabolism supporting epithelial proliferation. We found that, in the absence of ΔNp63, which is the most abundant p63 isoform in proliferating epithelial cells, keratinocytes undergo oxidative stress and mitochondrial dysfunction. In an attempt to investigate the direct ΔNp63 regulation of mitochondrial activity, we found out that HK2, one of the key regulators of glycolysis, is transcriptionally activated by ΔNp63. In addition, the ΔNp63–HK2 axis is responsible for the coupling of glucose metabolism and mitochondrial respiration (Fig. 5D). Specifically, in proliferating cells, HK2 silencing resembles the phenotype displayed by ΔNp63 depletion, and the restoration of HK2 protein levels in the absence of p63 is sufficient to revert the mitochondrial impairment to normal conditions. Our genomewide analysis confirmed the ChIP results, showing that p63 is physically bound to a previously unidentified p63-responsive element located in the 15th intron of the HK2 sequence. Through this element, p63 positively regulates HK2 transcription, indicating that this region acts as an enhancer regulatory element.
HKs control the first step of glycolysis, catalyzing the ATP-dependent phosphorylation of glucose to generate glucose-6-phosphate (25). In mammals, the family of HKs comprises four main isoforms differing in their substrate affinity, the inhibition induced by the product, their tissue expression, and their intracellular localization (26). HK1 and HK2 are high-affinity isoforms associated with mitochondria, and, whereas the former is constitutively expressed in most adult tissues, the latter is abundantly detected in adipose, cardiac, and skeletal muscle (27, 28). Similarly, HK3 is a high-affinity isoform, but it is inhibited by physiological concentrations of glucose (25). Finally, HK4, also known as glucokinase, has a low affinity for glucose and is expressed in liver and pancreas (25).
HK2 comprises a mitochondria-targeting domain (25) that localizes the enzyme to the VDAC/adenine nucleotide translocase channel to promote the rapid phosphorylation of glucose by means of the ATP promptly translocated from the matrix to the cytoplasm (26). We observed that the absence of HK2 impairs mitochondrial oxygen consumption, similar to the conditions of ADP recycling inhibition. Furthermore, the opposed displacement of protons in the intermembrane space generates a cationic gradient in relation to the matrix that, in cells lacking HK2, increases the mitochondrial membrane potential. Because this condition forces the respiratory chain complexes into a reduced state, the chances of electron leaking increase, resulting in enhanced ROS and superoxide anion production. As shown in Fig. 5D, human keratinocytes expressing p63 rely on HK2 function to prevent mitochondrial oxidative stress. In this positive loop, the phosphorylation of glucose accelerates the mitochondrial electron flux, which in turn results in the proton gradient generating ATP. In rat brain mitochondria and cortical neurons, da-Silva et al. also reported the importance of HK2 subcellular localization in the proximity of VDAC in facilitating ADP recycling to the matrix and favoring a new cycle of oxidative phosphorylation (29). Based on our data and on published results (29), the HK2 antioxidant function resides in its capacity to contribute to ADP local recycling at the mitochondria (Fig. 5C).
Accumulation of oxidative damage is one of the mechanisms leading to cellular senescence, tissue degeneration, and age-related disorders (30–32). ΔNp63 has a crucial role in counteracting cellular senescence and organismal aging through its support of the proliferating potential of epithelial cells (5, 24, 33–37). Therefore, ΔNp63 could exert its antisenescence/antiaging functions, at least in part, through the activation of the HK2 gene, thus supporting mitochondria functions.
In cancers, HK2 is overexpressed as part of a general strategy to reprogram cancer cell metabolism toward aerobic glycolysis to sustain high proliferation rate (38–40). Several tumorigenic pathways enhance HK2 transcription, including p53 and p53 mutants in hepatoma cells (20); Pten and p53 deficiency, through activation of the AKT–mTORC1–4EBP1 axis and inhibition of miRNA143, respectively, in prostate cancer (41); and peroxisome proliferator-activated receptor-γ (PPARγ) in liver (42). These suggest that ΔNp63 could have a role in regulation of HK2 transcription downstream of AKT in cooperation with PPARγ, contributing to metabolic reprogramming. Interestingly, different responsive elements on HK2 gene, located upstream of the first exon and within the 15th intron, are used by PPARγ and ΔNp63, respectively.
Our results, although limited to one cell line, indicate that the ΔNp63–HK2 axis is also present in cancer cells, although further studies are needed to investigate its relationship with mitochondria, if any, as cancer cells present mitochondria dysfunction and rely on aerobic glycolysis. Nevertheless, the data shown suggest that ΔNp63 could participate in cancer metabolic reprogramming in human malignancies, such us head and neck squamous cell carcinomas, lung squamous cell carcinomas, and breast cancer (43–47), in which p63 is strongly implicated.
Materials and Methods
Cell Culture, Transfection, Infection, Western Blotting, and ChIP.
Human primary epidermal keratinocytes from neonatal foreskin [human epidermal keratinocytes from neonatal (HEKn); Life Technologies] were grown in EpiLife medium enriched with human keratinocyte growth supplement (Life Technologies) in dedicated rat tail collagen-type I (BD Biosciences)-coated equipment. siRNA transfections were performed according to the manufacturer’s protocol provided with Lipofectamine RNAiMAX reagent (Invitrogen). siRNAs were purchased as smart pools of four oligos (Dharmacon/Thermo Scientific): Scramble (nontargeting pool; D-001810), sip63 (hTP63; L-003330), siHK1 (hHK1; L-006820), siHK2 (hHK2; L-006735), and sip53 (hTP53; L-003329). HEK 293E cells were grown in DMEM with 10% (vol/vol) FBS, 100 U penicillin, and 100 μg/mL streptomycin (Gibco/Invitrogen), and transfected by using the Effectene Transfection Reagent according to the manufacturer’s protocol (Qiagen). HCC1937 cells were grown in RPMI 1640 with 10% (vol/vol) FBS and transfected as HEKs. Detailed information on RNA extraction, mtDNA extraction, quantitative real-time (RT)-PCR, FACS analysis, clonogenicity assay, ATP viability assay, EM, luciferase assay, retroviral vector generation, infection, ChIP, and Western blotting is provided in SI Materials and Methods.
Seahorse Flux Analysis.
Oxidative phosphorylation and glycolysis flux were analyzed by measuring the OCR and lactic acid release or ECAR by using an XF24 XF analyzer (Seahorse Bioscience). Briefly, 1.5 × 10⁴ Hekn cells were seeded into collagen-coated XF 24-well cell culture microplates (Seahorse Biosciences). The following day, the cells were transfected as described in SI Materials and Methods. Then, 48 h after transfection, the cells were washed three times with assay medium (DMEM 8.3 g/L, NaCl 30 mM, GlutaMax 2 mM, sodium pyruvate 1 mM, glucose 11.11 mM, phenol red, pH 7.4) and were allowed to equilibrate at 37 °C (CO2-free). A disposable sensor cartridge, embedded with 24 pairs of fluorescent biosensors (oxygen and pH), was loaded with drugs in the dedicated delivery chambers. Injection of oligomycin was used to inhibit ATP synthesis, binding to complex V, and inducing the transition from the BR to the UR states. FCCP was used to increase the proton permeability of the mitochondrial membrane, leading to the maximal respiratory capacity (MR) state. Finally, rotenone was injected to inhibit NADH dehydrogenase (complex 1) and to block mitochondrial electron transport. Experiments were set up to achieve a treatment with the following concentrations: oligomycin 0.5 μM, FCCP 0.4 μM, and rotenone 1 μM. Acquisition and analysis were performed as described by Wu et al. (48), and, at the end of each assay, the number of viable cells was determined by a cell viability assay as previously described. The metabolic profile is provided in SI Materials and Methods.
Acknowledgments
We thank Dr. Kelvin Cain for his assistance in the Seahorse experiments and Dr. A. Peschiaroli and A. Terrinoni for their scientific discussions. This work was mainly supported by Associazione Italiana per la Ricerca contro il Cancro (AIRC) Grant IG13387 (to E.C.) and partially supported by a Fondazione Roma malattie Non trasmissibili Cronico-Degenerative (NCD) Grant (to G.M.), Istituto Dermopatico dell’Immacolata/Istituto di Ricovero e Cura a Carattere Scientifico (R.F.), and the Medical Research Council (G.M.).
Footnotes
The authors declare no conflict of interest.
This article is a PNAS Direct Submission.
This article contains supporting information online at www.pnas.org/lookup/suppl/doi:10.1073/pnas.1508871112/-/DCSupplemental.
References
- 1.Blanpain C, Fuchs E. Epidermal stem cells of the skin. Annu Rev Cell Dev Biol. 2006;22:339–373. doi: 10.1146/annurev.cellbio.22.010305.104357. [DOI] [PMC free article] [PubMed] [Google Scholar]
- 2.Bickenbach JR, Greer JM, Bundman DS, Rothnagel JA, Roop DR. Loricrin expression is coordinated with other epidermal proteins and the appearance of lipid lamellar granules in development. J Invest Dermatol. 1995;104(3):405–410. doi: 10.1111/1523-1747.ep12665896. [DOI] [PubMed] [Google Scholar]
- 3.Byrne C, Tainsky M, Fuchs E. Programming gene expression in developing epidermis. Development. 1994;120(9):2369–2383. doi: 10.1242/dev.120.9.2369. [DOI] [PubMed] [Google Scholar]
- 4.Candi E, Schmidt R, Melino G. The cornified envelope: A model of cell death in the skin. Nat Rev Mol Cell Biol. 2005;6(4):328–340. doi: 10.1038/nrm1619. [DOI] [PubMed] [Google Scholar]
- 5.Candi E, et al. Differential roles of p63 isoforms in epidermal development: Selective genetic complementation in p63 null mice. Cell Death Differ. 2006;13(6):1037–1047. doi: 10.1038/sj.cdd.4401926. [DOI] [PubMed] [Google Scholar]
- 6.Koster MI, et al. p63 induces key target genes required for epidermal morphogenesis. Proc Natl Acad Sci USA. 2007;104(9):3255–3260. doi: 10.1073/pnas.0611376104. [DOI] [PMC free article] [PubMed] [Google Scholar]
- 7.Koster MI, Kim S, Mills AA, DeMayo FJ, Roop DR. p63 is the molecular switch for initiation of an epithelial stratification program. Genes Dev. 2004;18(2):126–131. doi: 10.1101/gad.1165104. [DOI] [PMC free article] [PubMed] [Google Scholar]
- 8.Truong AB, Kretz M, Ridky TW, Kimmel R, Khavari PA. p63 regulates proliferation and differentiation of developmentally mature keratinocytes. Genes Dev. 2006;20(22):3185–3197. doi: 10.1101/gad.1463206. [DOI] [PMC free article] [PubMed] [Google Scholar]
- 9.Mills AA, et al. p63 is a p53 homologue required for limb and epidermal morphogenesis. Nature. 1999;398(6729):708–713. doi: 10.1038/19531. [DOI] [PubMed] [Google Scholar]
- 10.Yang A, et al. p63 is essential for regenerative proliferation in limb, craniofacial and epithelial development. Nature. 1999;398(6729):714–718. doi: 10.1038/19539. [DOI] [PubMed] [Google Scholar]
- 11.Yang A, Kaghad M, Caput D, McKeon F. On the shoulders of giants: p63, p73 and the rise of p53. Trends Genet. 2002;18(2):90–95. doi: 10.1016/s0168-9525(02)02595-7. [DOI] [PubMed] [Google Scholar]
- 12.Yang A, McKeon F. P63 and P73: P53 mimics, menaces and more. Nat Rev Mol Cell Biol. 2000;1(3):199–207. doi: 10.1038/35043127. [DOI] [PubMed] [Google Scholar]
- 13.Duijf PH, et al. Gain-of-function mutation in ADULT syndrome reveals the presence of a second transactivation domain in p63. Hum Mol Genet. 2002;11(7):799–804. doi: 10.1093/hmg/11.7.799. [DOI] [PubMed] [Google Scholar]
- 14.Yang A, et al. p63, a p53 homolog at 3q27-29, encodes multiple products with transactivating, death-inducing, and dominant-negative activities. Mol Cell. 1998;2(3):305–316. doi: 10.1016/s1097-2765(00)80275-0. [DOI] [PubMed] [Google Scholar]
- 15.Romano RA, et al. ΔNp63 knockout mice reveal its indispensable role as a master regulator of epithelial development and differentiation. Development. 2012;139(4):772–782. doi: 10.1242/dev.071191. [DOI] [PMC free article] [PubMed] [Google Scholar]
- 16.Senoo M, Pinto F, Crum CP, McKeon F. p63 Is essential for the proliferative potential of stem cells in stratified epithelia. Cell. 2007;129(3):523–536. doi: 10.1016/j.cell.2007.02.045. [DOI] [PubMed] [Google Scholar]
- 17.Su X, et al. TAp63 is a master transcriptional regulator of lipid and glucose metabolism. Cell Metab. 2012;16(4):511–525. doi: 10.1016/j.cmet.2012.09.006. [DOI] [PMC free article] [PubMed] [Google Scholar]
- 18.Berkers CR, Maddocks OD, Cheung EC, Mor I, Vousden KH. Metabolic regulation by p53 family members. Cell Metab. 2013;18(5):617–633. doi: 10.1016/j.cmet.2013.06.019. [DOI] [PMC free article] [PubMed] [Google Scholar]
- 19.Gottlieb E, Vousden KH. p53 regulation of metabolic pathways. Cold Spring Harb Perspect Biol. 2010;2(4):a001040. doi: 10.1101/cshperspect.a001040. [DOI] [PMC free article] [PubMed] [Google Scholar]
- 20.Mathupala SP, Heese C, Pedersen PL. Glucose catabolism in cancer cells. The type II hexokinase promoter contains functionally active response elements for the tumor suppressor p53. J Biol Chem. 1997;272(36):22776–22780. doi: 10.1074/jbc.272.36.22776. [DOI] [PubMed] [Google Scholar]
- 21.Kouwenhoven EN, et al. Genome-wide profiling of p63 DNA-binding sites identifies an element that regulates gene expression during limb development in the 7q21 SHFM1 locus. PLoS Genet. 2010;6(8):e1001065. doi: 10.1371/journal.pgen.1001065. [DOI] [PMC free article] [PubMed] [Google Scholar]
- 22.Kouwenhoven EN, et al. Transcription factor p63 bookmarks and regulates dynamic enhancers during epidermal differentiation. EMBO Rep. 2015;16(7):863–878. doi: 10.15252/embr.201439941. [DOI] [PMC free article] [PubMed] [Google Scholar]
- 23.Giacobbe A, et al. p63 controls cell migration and invasion by transcriptional regulation of MTSS1. Oncogene. 2015 doi: 10.1038/onc.2015.230. [DOI] [PubMed] [Google Scholar]
- 24.Rivetti di Val Cervo P, et al. p63-microRNA feedback in keratinocyte senescence. Proc Natl Acad Sci USA. 2012;109(4):1133–1138. doi: 10.1073/pnas.1112257109. [DOI] [PMC free article] [PubMed] [Google Scholar]
- 25.Wilson JE. Isozymes of mammalian hexokinase: Structure, subcellular localization and metabolic function. J Exp Biol. 2003;206(pt 12):2049–2057. doi: 10.1242/jeb.00241. [DOI] [PubMed] [Google Scholar]
- 26.Robey RB, Hay N. Mitochondrial hexokinases, novel mediators of the antiapoptotic effects of growth factors and Akt. Oncogene. 2006;25(34):4683–4696. doi: 10.1038/sj.onc.1209595. [DOI] [PubMed] [Google Scholar]
- 27.Gottlob K, et al. Inhibition of early apoptotic events by Akt/PKB is dependent on the first committed step of glycolysis and mitochondrial hexokinase. Genes Dev. 2001;15(11):1406–1418. doi: 10.1101/gad.889901. [DOI] [PMC free article] [PubMed] [Google Scholar]
- 28.Majewski N, et al. Hexokinase-mitochondria interaction mediated by Akt is required to inhibit apoptosis in the presence or absence of Bax and Bak. Mol Cell. 2004;16(5):819–830. doi: 10.1016/j.molcel.2004.11.014. [DOI] [PubMed] [Google Scholar]
- 29.da-Silva WS, et al. Mitochondrial bound hexokinase activity as a preventive antioxidant defense: Steady-state ADP formation as a regulatory mechanism of membrane potential and reactive oxygen species generation in mitochondria. J Biol Chem. 2004;279(38):39846–39855. doi: 10.1074/jbc.M403835200. [DOI] [PubMed] [Google Scholar]
- 30.d’Adda di Fagagna F. Living on a break: Cellular senescence as a DNA-damage response. Nat Rev Cancer. 2008;8(7):512–522. doi: 10.1038/nrc2440. [DOI] [PubMed] [Google Scholar]
- 31.Adams PD. Healing and hurting: Molecular mechanisms, functions, and pathologies of cellular senescence. Mol Cell. 2009;36(1):2–14. doi: 10.1016/j.molcel.2009.09.021. [DOI] [PubMed] [Google Scholar]
- 32.Rufini A, et al. TAp73 depletion accelerates aging through metabolic dysregulation. Genes Dev. 2012;26(18):2009–2014. doi: 10.1101/gad.197640.112. [DOI] [PMC free article] [PubMed] [Google Scholar]
- 33.Paris M, Rouleau M, Pucéat M, Aberdam D. Regulation of skin aging and heart development by TAp63. Cell Death Differ. 2012;19(2):186–193. doi: 10.1038/cdd.2011.181. [DOI] [PMC free article] [PubMed] [Google Scholar]
- 34.Sommer M, et al. DeltaNp63alpha overexpression induces downregulation of Sirt1 and an accelerated aging phenotype in the mouse. Cell Cycle. 2006;5(17):2005–2011. doi: 10.4161/cc.5.17.3194. [DOI] [PubMed] [Google Scholar]
- 35.Keyes WM, et al. p63 deficiency activates a program of cellular senescence and leads to accelerated aging. Genes Dev. 2005;19(17):1986–1999. doi: 10.1101/gad.342305. [DOI] [PMC free article] [PubMed] [Google Scholar]
- 36.Viticchiè G, et al. MicroRNA-203 contributes to skin re-epithelialization. Cell Death Dis. 2012;3:e435. doi: 10.1038/cddis.2012.174. [DOI] [PMC free article] [PubMed] [Google Scholar]
- 37.Candi E, et al. DeltaNp63 regulates thymic development through enhanced expression of FgfR2 and Jag2. Proc Natl Acad Sci USA. 2007;104(29):11999–12004. doi: 10.1073/pnas.0703458104. [DOI] [PMC free article] [PubMed] [Google Scholar]
- 38.Vander Heiden MG, Cantley LC, Thompson CB. Understanding the Warburg effect: The metabolic requirements of cell proliferation. Science. 2009;324(5930):1029–1033. doi: 10.1126/science.1160809. [DOI] [PMC free article] [PubMed] [Google Scholar]
- 39.Patra KC, et al. Hexokinase 2 is required for tumor initiation and maintenance and its systemic deletion is therapeutic in mouse models of cancer. Cancer Cell. 2013;24(2):213–228. doi: 10.1016/j.ccr.2013.06.014. [DOI] [PMC free article] [PubMed] [Google Scholar]
- 40.Peschiaroli A, et al. 2013. miR-143 regulates hexokinase 2 expression in cancer cells. Oncogene 32(6):797–802.
- 41.Wang L, et al. Hexokinase 2-mediated Warburg effect is required for PTEN- and p53-deficiency-driven prostate cancer growth. Cell Reports. 2014;8(5):1461–1474. doi: 10.1016/j.celrep.2014.07.053. [DOI] [PMC free article] [PubMed] [Google Scholar]
- 42.Panasyuk G, et al. PPARγ contributes to PKM2 and HK2 expression in fatty liver. Nat Commun. 2012;3:672. doi: 10.1038/ncomms1667. [DOI] [PMC free article] [PubMed] [Google Scholar]
- 43.Ramsey MR, et al. FGFR2 signaling underlies p63 oncogenic function in squamous cell carcinoma. J Clin Invest. 2013;123(8):3525–3538. doi: 10.1172/JCI68899. [DOI] [PMC free article] [PubMed] [Google Scholar]
- 44.Ramsey MR, He L, Forster N, Ory B, Ellisen LW. Physical association of HDAC1 and HDAC2 with p63 mediates transcriptional repression and tumor maintenance in squamous cell carcinoma. Cancer Res. 2011;71(13):4373–4379. doi: 10.1158/0008-5472.CAN-11-0046. [DOI] [PMC free article] [PubMed] [Google Scholar]
- 45.Piccolo S, Enzo E, Montagner M. p63, Sharp1, and HIFs: Master regulators of metastasis in triple-negative breast cancer. Cancer Res. 2013;73(16):4978–4981. doi: 10.1158/0008-5472.CAN-13-0962. [DOI] [PubMed] [Google Scholar]
- 46.Montagner M, et al. SHARP1 suppresses breast cancer metastasis by promoting degradation of hypoxia-inducible factors. Nature. 2012;487(7407):380–384. doi: 10.1038/nature11207. [DOI] [PubMed] [Google Scholar]
- 47.Adorno M, et al. A Mutant-p53/Smad complex opposes p63 to empower TGFbeta-induced metastasis. Cell. 2009;137(1):87–98. doi: 10.1016/j.cell.2009.01.039. [DOI] [PubMed] [Google Scholar]
- 48.Wu M, et al. Multiparameter metabolic analysis reveals a close link between attenuated mitochondrial bioenergetic function and enhanced glycolysis dependency in human tumor cells. Am J Physiol Cell Physiol. 2007;292(1):C125–C136. doi: 10.1152/ajpcell.00247.2006. [DOI] [PubMed] [Google Scholar]
- 49.Tucci P, et al. Rapamycin regulates biochemical metabolites. Cell Cycle. 2013;12(15):2454–2467. doi: 10.4161/cc.25450. [DOI] [PMC free article] [PubMed] [Google Scholar]