Significance
Glucokinase (GCK), the body’s primary glucose sensor, displays a unique sigmoidal kinetic response that is a hallmark of allostery. Allostery in GCK is different from textbook models, because the enzyme is monomeric and contains only one glucose binding site. Previously, synthetic activators and activating disease mutations were thought to share a common mechanism of allosteric activation in which GCK is shifted toward a glucose-bound–like state. Using mutagenesis and genetic selection, we identify an activated variant that utilizes a different mechanism. Limited proteolysis and NMR reveal that activation is achieved by modulating the dynamic properties of an active-site loop without perturbing the ensemble structure. This previously undescribed activation mechanism is shown to operate in naturally occurring, hyperinsulinemia-associated disease variants.
Keywords: allostery, monomeric cooperativity, glucokinase, diabetes, intrinsic disorder
Abstract
Cooperativity in human glucokinase (GCK), the body’s primary glucose sensor and a major determinant of glucose homeostatic diseases, is fundamentally different from textbook models of allostery because GCK is monomeric and contains only one glucose-binding site. Prior work has demonstrated that millisecond timescale order-disorder transitions within the enzyme’s small domain govern cooperativity. Here, using limited proteolysis, we map the site of disorder in unliganded GCK to a 30-residue active-site loop that closes upon glucose binding. Positional randomization of the loop, coupled with genetic selection in a glucokinase-deficient bacterium, uncovers a hyperactive GCK variant with substantially reduced cooperativity. Biochemical and structural analysis of this loop variant and GCK variants associated with hyperinsulinemic hypoglycemia reveal two distinct mechanisms of enzyme activation. In α-type activation, glucose affinity is increased, the proteolytic susceptibility of the active site loop is suppressed and the 1H-13C heteronuclear multiple quantum coherence (HMQC) spectrum of 13C-Ile–labeled enzyme resembles the glucose-bound state. In β-type activation, glucose affinity is largely unchanged, proteolytic susceptibility of the loop is enhanced, and the 1H-13C HMQC spectrum reveals no perturbation in ensemble structure. Leveraging both activation mechanisms, we engineer a fully noncooperative GCK variant, whose functional properties are indistinguishable from other hexokinase isozymes, and which displays a 100-fold increase in catalytic efficiency over wild-type GCK. This work elucidates specific structural features responsible for generating allostery in a monomeric enzyme and suggests a general strategy for engineering cooperativity into proteins that lack the structural framework typical of traditional allosteric systems.
Elucidating the molecular origins of allosteric regulation of protein function remains a primary goal of biochemistry, despite nearly a half-century of intense investigation (1). Early classical theories, such as the Monod–Wyman–Changeux (2) and Koshland–Nemethy–Filmer (3) models, have found utility in describing allosteric transitions (4, 5), but they are phenomenological in nature and lack a quantitative, predictive description of the underlying mechanism (6). Traditional models tend to describe allostery in terms of structural transitions between two discrete end states that are often viewed through the lens of static crystal structures. Recent focus on the role of dynamics (7, 8) and intrinsic disorder in protein structures (9–11) demonstrates that classic models are far from general (12–19). The ensemble allosteric model (6, 20) and the allosteric two-state model (21) reflect attempts to account for the role of dynamics and disorder in allosteric regulation. Identifying the full suite of structural and dynamic contributors to cooperativity promises to facilitate the discovery and understanding of new allosteric mechanisms that have precluded explanation to date. It also offers the promise of developing general approaches to endow allosteric properties on proteins that do not presently possess such regulatory capabilities.
Monomeric, single-site enzymes that display homotropic kinetic cooperativity represent allosteric systems that do not fall under the purview of textbook models (22). Instead, the mnemonic (23) and ligand-induced slow transition (LIST) (24) models have been developed to explain allostery in these systems. These models posit that cooperativity arises from conformational changes during ligand binding and release that occur on a timescale comparable to the catalytic rate constant, kcat. The sluggish nature of these conformational changes is directly responsible for hysteresis observed in the kinetic profiles (24, 25). Although the LIST and mnemonic models were prescient in that they invoke conformational heterogeneity to explain monomeric kinetic cooperativity, they both lack a quantitative, physical description of the underlying mechanism that drives allostery. Understanding the biophysical basis of cooperativity in monomeric, single-site enzymes would serve to further our understanding of a relatively unexplored class of proteins and expand allosteric models to nonclassical systems (17–19). Human glucokinase (GCK) has emerged as a model system for understanding allostery in monomeric, single-site enzymes and for exploring the role of dynamics in functional regulation of these proteins (22, 26, 27). The uniqueness of this type of allostery is underscored by the fact that cooperativity in GCK is fully a kinetic phenomenon. Equilibrium ligand binding to GCK is noncooperative (22). In addition, cooperativity in GCK does not appear to depend on endogenous effector molecules or posttranslational modification events.
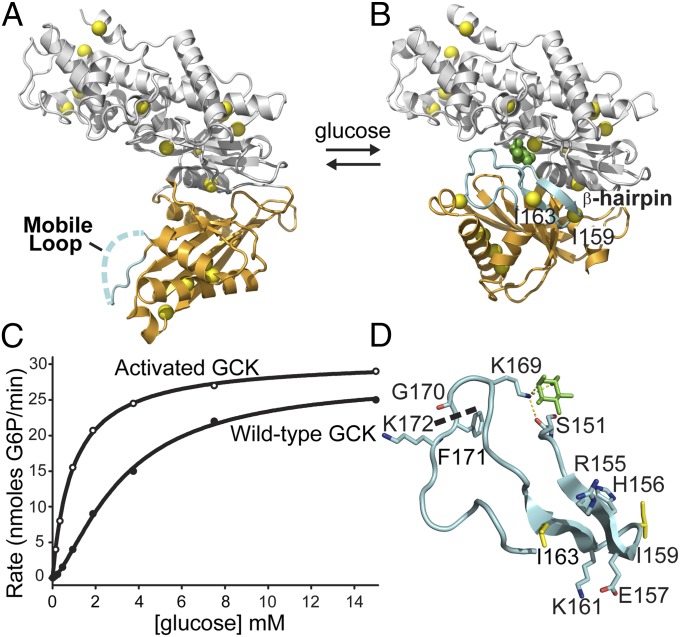
GCK catalyzes the rate-limiting step of glucose metabolism in the human pancreas and liver, the ATP-dependent phosphorylation of glucose to glucose-6-phosphate (26). In pancreatic β-cells, GCK activity triggers insulin release (28). GCK displays a cooperative kinetic response to glucose characterized by a Hill coefficient of 1.7 (Fig. 1). This sigmoidal response provides maximum sensitivity at 8 mM glucose, a concentration that correlates with physiological blood glucose levels (26). A series of familial, monogenic disease states reveals the importance of GCK function in the regulation of insulin levels and blood glucose homeostasis. A large set (>600) of inactivating mutations in gck lead to either maturity onset diabetes of the young (heterozygous) or the more severe permanent neonatal diabetes mellitus (homozygous) (29, 30). In contrast, activating gck mutations lead to persistent hyperinsulinemic hypoglycemia of infancy (PHHI), the severity of which scales with the level of GCK activation (31). PHHI-associated activating mutations are of particular interest in understanding the basis of cooperativity, because the disease state appears to result from a reduction in the enzyme’s cooperativity and a decrease in the glucose K0.5 value (32–34).
Fig. 1.
Conformational changes and kinetic profile of human GCK. (A) In the unliganded state, the mobile loop (cyan) displays no electron density and the small domain (orange) adopts a super-open conformation. (B) Upon glucose binding, the mobile loop folds into an antiparallel β-hairpin and K169 forms a hydrogen bonding network with glucose (green) and S151. Isoleucine residues (yellow) used as NMR reporters are evenly distributed throughout the molecule. (C) The sigmoidal kinetic response of GCK results from conformational rearrangements occurring on a timescale comparable to kcat. (D) View of the 151–180 loop, revealing the β-hairpin formed by residues 154–164 upon glucose binding (green). The thermolysin cleavage site is shown as a dashed line.
X-ray crystallographic studies of GCK confirm the existence of conformational heterogeneity (35), as proposed by the LIST and mnemonic mechanisms. The enzyme undergoes substantial reorganization upon glucose association, followed by little additional rearrangement upon ATP binding (Fig. 1 A and B). Most of the rearrangements occur in the small domain of GCK, whereas the large domain appears to remain largely static during the transition between the unliganded and glucose-bound states. A mobile loop spanning residues 151–180 lacks electron density in the unliganded structure, suggestive of an intrinsically disordered domain. Upon glucose binding, this loop folds over glucose and the region spanning residues 154–164 forms a β-hairpin (Fig. 1D). NMR experiments using site-specific 13C-labeled GCK demonstrate that the 151–180 loop is disordered in the unliganded state and experiences fast motional dynamics (27). Global fitting of kinetic Carr–Purcell–Meiboom–Gill (CPMG) NMR experiments to a two-state model suggests that the remainder of the small domain undergoes conformational exchange between at least two substantially populated states with a rate constant of 509 s−1 at 40 °C (36). Together, these results support a model in which GCK cooperativity results from dynamic structural transitions in the small domain, the timescale of which overlaps with enzymatic turnover.
A comprehensive understanding of GCK’s unique allosteric mechanism requires a detailed description of both the enzyme’s ensemble structure and its conformational dynamics. Here, using limited proteolysis and 2D 1H-13C heteronuclear multiple quantum coherence (HMQC) NMR of 13C-Ile–labeled enzyme, we investigate the contribution of structure and dynamics to GCK cooperativity. We uncover two functionally distinct mechanisms for GCK activation that perturb the allosteric response of GCK to glucose, both of which are observed in PHHI-associated variants. The first activation mechanism involves a shift in the ensemble structure of the enzyme toward a more compact state in which the small domain is preorganized for glucose binding. The second activation mechanism does not appear to alter the equilibrium distribution of conformers in the unliganded ensemble, but instead targets a dynamic loop that undergoes substantial structural alterations during the course of catalysis. The identification of two distinct mechanisms of GCK activation facilitates the generation of a noncooperative enzyme variant that displays a 100-fold increase in catalytic efficiency and a 50-fold higher equilibrium affinity for glucose compared with wild-type GCK. This enzyme represents the most active variant of human GCK identified to date. The ability to manipulate the allosteric response of a monomeric, single-site enzyme via targeted alterations in the functional properties of the scaffold suggests a general approach for engineering cooperativity into proteins that lack the structural framework typical of traditional allosteric systems.
Results and Discussion
Disorder in Unliganded GCK.
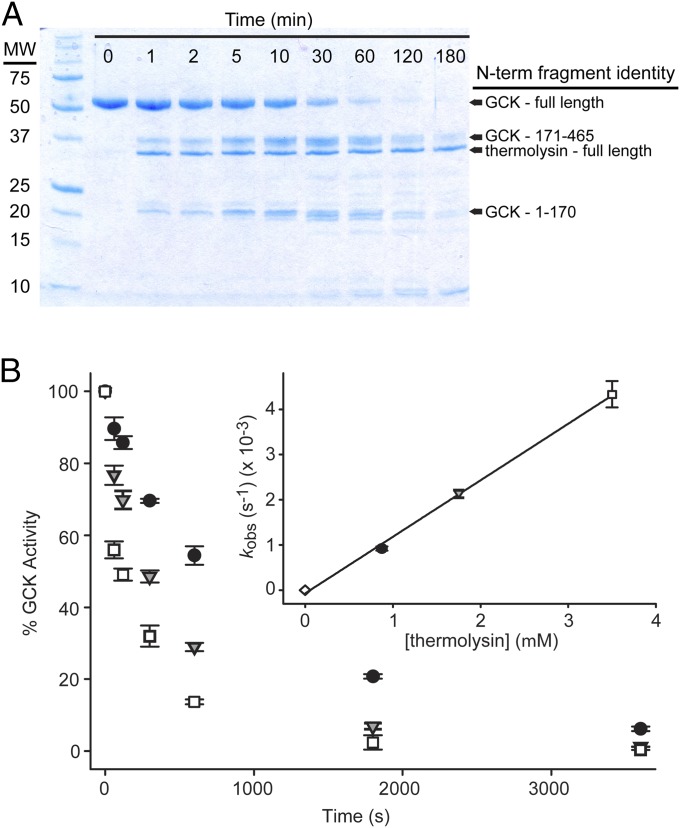
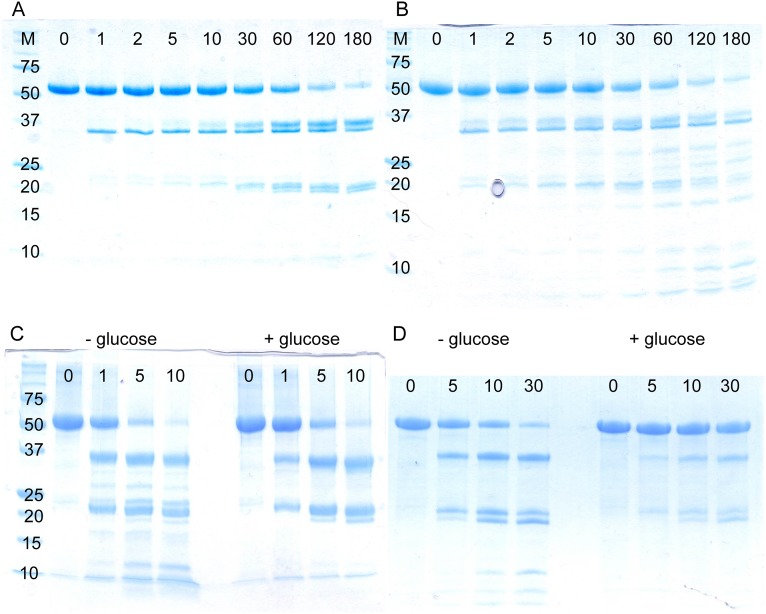
Past work in our laboratories demonstrated that cooperativity in human GCK is governed by millisecond timescale order-disorder transitions within the enzyme’s small domain (27, 36). To map the sites of disorder in GCK, we performed limited proteolysis with thermolysin, a broad specificity protease commonly used to probe protein structure (37–40). NMR studies indicate that the small domain is both dynamic and structurally heterogeneous (27). Based on these findings, we expected to observe multiple thermolysin cleavage sites in unliganded GCK. However, SDS/PAGE analysis of protease digestion reactions indicates that thermolysin cleaves GCK at only one position, identified by N-terminal sequencing as the peptide bond between G170 and F171 (Fig. 2A). These residues lie in the middle of the 151–180 loop. The cleavage pattern observed for wild-type GCK does not change upon addition of glucose or by introducing PHHI-associated activating mutations (Fig. S1), although both conditions alter proteolysis rates (Table S1). Moreover, treatment of unliganded GCK with proteinase K and trypsin, two proteases with orthogonal sequence specificities, results in a similar proteolysis pattern as observed after thermolysin digestion (Fig. S1). Taken together, these results indicate that the 151–180 loop is the primary site of disorder in GCK.
Fig. 2.
Mapping GCK intrinsic disorder via proteolysis. (A) Time course of GCK proteolysis by thermolysin monitored by SDS/PAGE. N-terminal sequencing of fragments reveals that GCK is cleaved at one site in the mobile loop between residues 170 and 171. (B) Proteolysis kinetics monitored by measuring residual GCK activity at increasing thermolysin concentrations. Curves were fitted with a single exponential decay function (error bars are ± SD) and the resulting proteolysis rates (kobs) were plotted versus thermolysin concentration to yield values for Kop (Inset; error bars are ± SE of fit).
Fig. S1.
Proteolysis profiles of human GCK. (A) Thermolysin digestion of wild-type GCK following addition of 0.2 M glucose. (B) Thermolysin digestion of the α13-helix variant. (C) Proteinase K digestion of GCK in the absence and presence of glucose. (D) Trypsin digestion of GCK in the absence and presence of glucose. Time points are listed in minutes from left to right across the top of each gel.
Table S1.
Proteolysis kinetics of GCK variants in the presence of 200 mM glucose
| Protein | kop* (x 10−3⋅s−1) | kcl,† s−1 | Kop‡ (x 10−2) | ΔG,§ kcal/mol |
| Wild-type | 1.0 ± 0.1 | 0.34 ± 0.12 | 0.29 ± 0.09 | 3.46 ± 0.3 |
| α13-helix + β-hairpin | 0.03 ± 0.0003 | 0.025 ± 0.002 | 0.12 ± 0.01 | 4.00 ± 0.4 |
| α-type activation | ||||
| S64P | 0.12 ± 0.009 | 0.22 ± 0.05 | 0.056 ± 0.01 | 3.99 ± 0.1 |
| T65I | 0.018 ± 0.0007 | 1.2 ± 0.22 | 0.0015 ± 0.0003 | 6.58 ± 1.2 |
| V455M | 0.16 ± 0.01 | 0.37 ± 0.08 | 0.043 ± 0.009 | 4.59 ± 0.2 |
| α13 helix | 0.0089 ± 0.0002 | 0.82 ± 0.08 | 0.0011 ± 0.0009 | 6.77 ± 0.08 |
| β-type activation | ||||
| M197V | 0.53 ± 0.04 | 0.77 ± 0.15 | 0.070 ± 0.01 | 4.31 ± 0.2 |
| I211F | 0.15 ± 0.02 | 0.28 ± 0.08 | 0.056 ± 0.02 | 4.43 ± 0.2 |
| Y214C | 6.2 ± 0.4 | 0.73 ± 0.13 | 0.86 ± 0.1 | 2.82 ± 0.1 |
| β-hairpin | 4.0 ± 1.0 | 0.91 ± 0.45 | 0.44 ± 0.19 | 3.22 ± 1.4 |
Rate constant for opening to the cleavable state.
Rate constant for closing from the cleavable state.
Equilibrium constant between the cleavable and uncleavable states.
Free energy difference between the cleavable and uncleavable states.
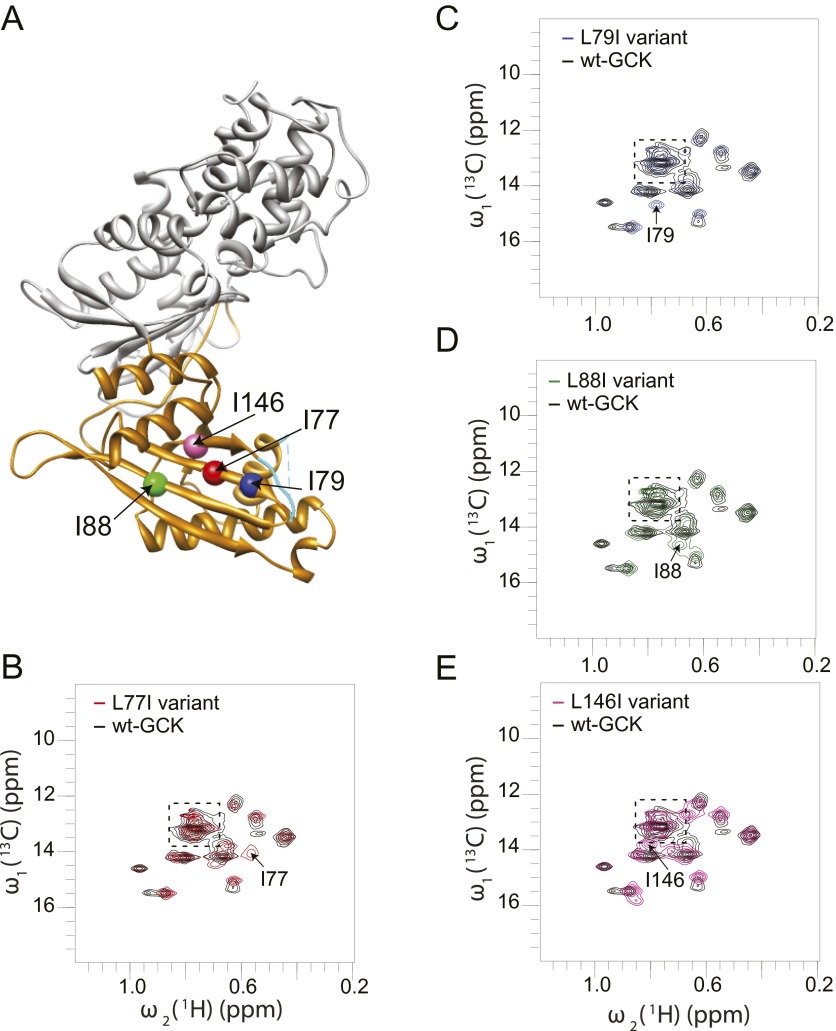
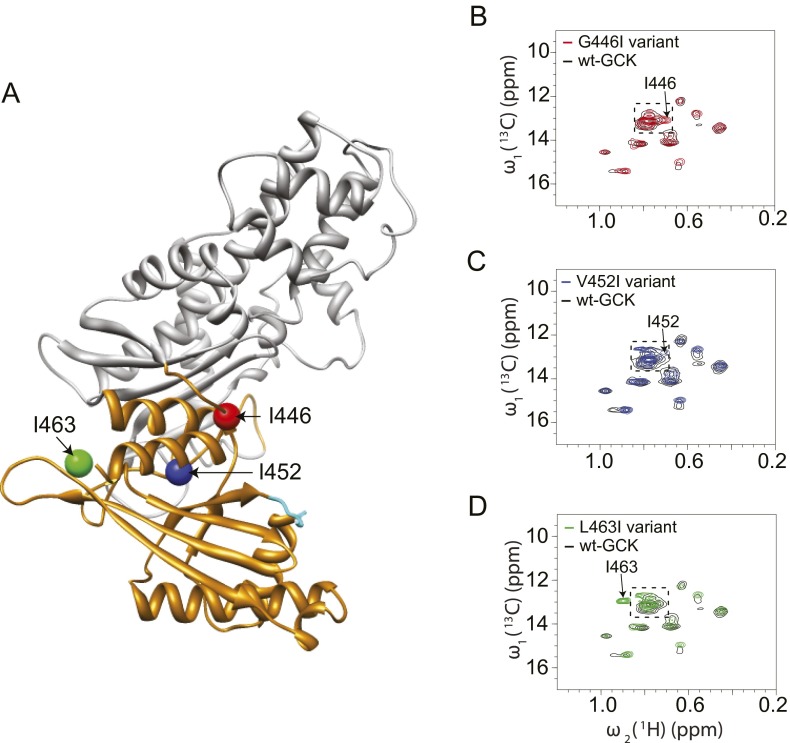
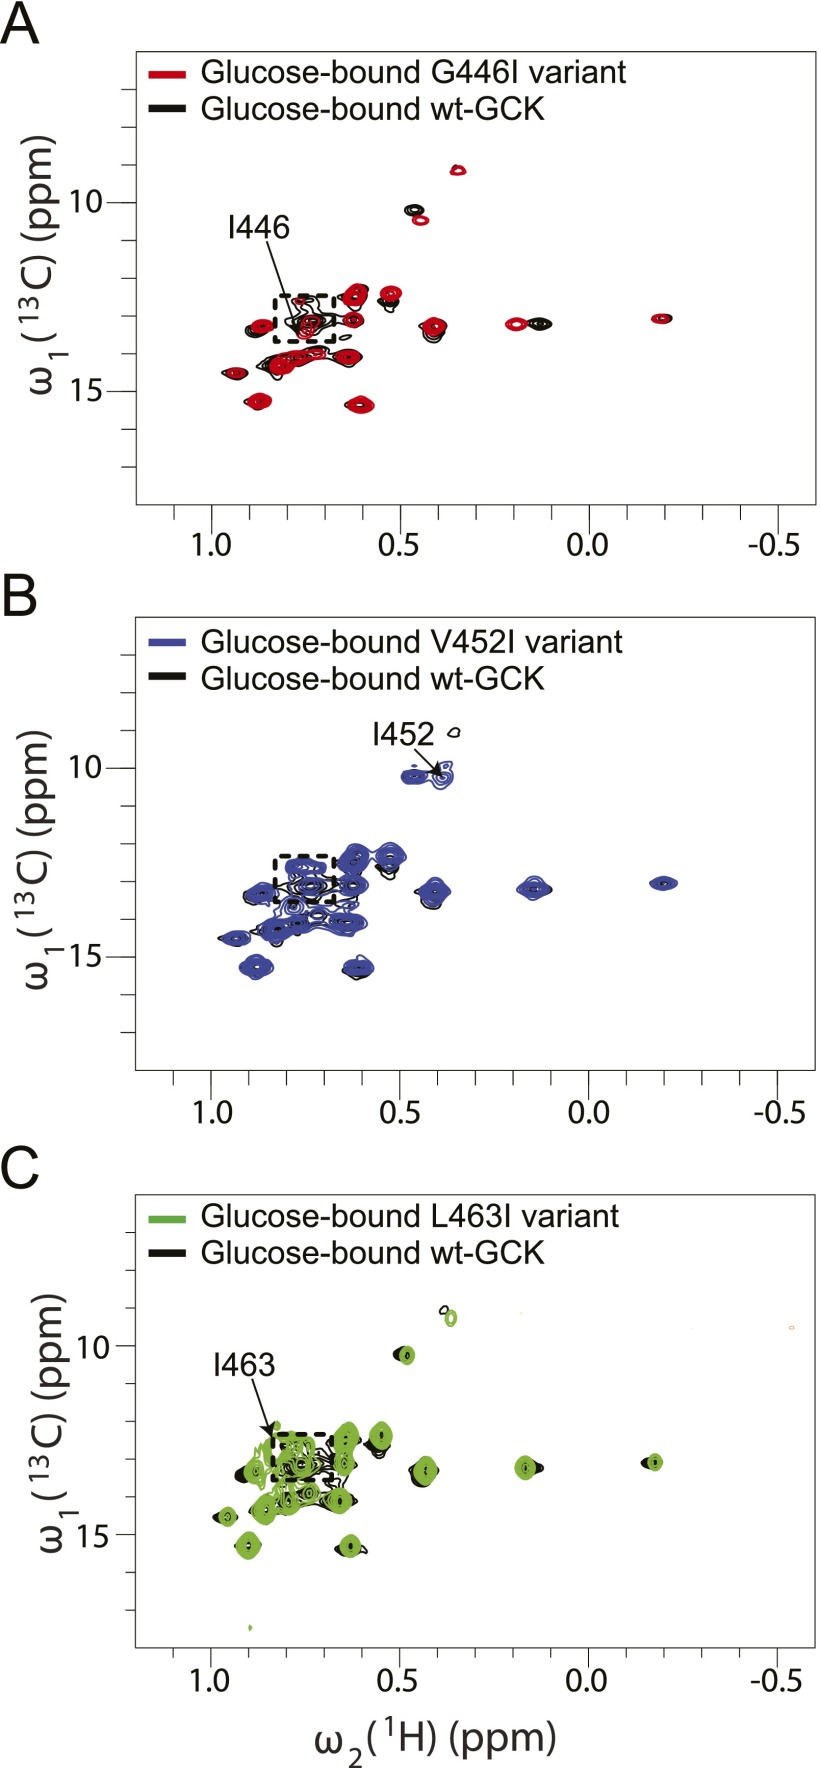
To investigate disorder in other regions of the small domain, we used 2D 1H-13C HMQC NMR analysis of 13C-Ile–labeled enzyme. GCK contains 17 Ile residues, 11 of which are observable in the unliganded 2D 1H-13C HMQC spectra without deuteration (27). After deuteration, the missing peaks become visible as weak cross-peaks. Upon addition of glucose, all Ile peaks become observable both in the absence and presence of deuteration (27). Site-specific labeling of Ile residues was used because Ile side-chain Cδ1 methyl groups are reliable reporters of intrinsic disorder and because 1H-15N transverse relaxation-optimized spectroscopy (TROSY) spectra of universal 15N-labeled GCK display significant cross-peak overlap and heterogeneous distribution of linewidths and intensities, which preclude detailed structural or dynamic analysis (41, 42). To probe disorder in the small domain β-sheet of GCK, we substituted 13C-labeled isoleucine for leucine at residues 77, 79, 88, and 146. The 2D 1H-13C HMQC spectrum of each unliganded variant reveals discrete cross-peaks for each inserted isoleucine residue, consistent with retention of secondary structure throughout the β-sheet in the absence of glucose (Fig. S2). A similar approach was used to investigate disorder within the C-terminal α13 helix. Following insertion of 13C-Ile probes in place of Gly446, Val452, and Leu463, 2D 1H-13C HMQC NMR analyses of all three variants revealed new cross-peaks with chemical shifts near the region expected for disordered isoleucines (Fig. S3). Upon glucose binding, the chemical shifts and linewidths of the G446I and L463I cross-peaks remain in the disordered region, whereas the V452I cross-peak shifts to a new position, away from the disordered region (Fig. S4). Residue 452 is located in the center of the α13 helix, whereas residues 446 and 463 are located at the extreme amino- and carboxy-terminal ends of the α13 helix, which likely explains their apparent flexibility both in the presence and absence of glucose. The NMR data are suggestive of partial disorder in the α13 helix, especially near the termini, but the data demonstrate that the core of the helix becomes structured in the glucose-bound state. Kinetic analyses of variants containing positional isoleucine substitutions suggest negligible functional perturbation in these proteins (Table S2).
Fig. S2.
Positional insertion of 13C-Ile to probe the structure of the small domain β-sheet of unliganded GCK. (A) Location of Ile insertions; (B–E) 1H-13C HMQC spectra of the L77I, L79I, L88I, and L146I variants of GCK demonstrate the appearance of new cross-peaks residing outside of the window expected for disordered isoleucines (boxed).
Fig. S3.
Positional insertion of 13C-Ile to probe the structure of the small domain α13-helix of unliganded GCK. (A) Location of Ile insertions; (B–D) 1H-13C HMQC spectra of the G446I, V452I, L463I variants of GCK demonstrate the appearance of new cross-peaks. The boxed area denotes the region expected for disordered isoleucines.
Fig. S4.
1H-13C HMQC spectrum of glucose bound GCK with positional 13C-Ile probes in the C-terminal α13-helix of GCK. I452 is shifted away from the disordered region (B), whereas I446 and I463 (A and C) remain in the disordered region (boxed area) upon addition of glucose.
Table S2.
Insertion of additional Ile probes is minimally perturbative as measured by steady-state kinetics
| Isoleucine variant | kcat, s−1 | K0.5, glucose, mM | Hill coefficient, H |
| Wild-type | 53 ± 1 | 8.5 ± 5.5 | 1.6 ± 0.1 |
| G446I | 40 ± 0.5 | 5.1 ± 0.5 | 1.3 ± 0.1 |
| V452I | 48 ± 0.7 | 6.9 ± 0.5 | 1.7 ± 0.2 |
| L463I | 58 ± 1 | 6.3 ± 0.4 | 1.6 ± 0.1 |
Genetic Selection of an Activated Loop Variant.
Given the importance of order-disorder transitions to GCK cooperativity, we reasoned that targeted substitutions in the 151–180 loop might modify the allosteric response of the enzyme. The crystal structure of glucose-bound GCK demonstrates that a segment of the loop spanning residues 154–164 adopts a β-hairpin in the presence of glucose (Fig. 1D). We postulated that optimizing this structure might activate the enzyme and impact allostery. To investigate this possibility, we randomized positions 154–157 and 161–162 by using gapped-duplex ligation and transformed the resulting 3.6 × 10⁵ member library into a glucokinase-deficient bacterium. Challenging this organism for survival on glucose minimal medium afforded the identification of a quadruple variant (R155H-H156M-E157L-K161V) that efficiently complemented the genetic deficiency. Mutagenic backcrossing with wild-type GCK revealed that the R155H substitution was dispensable for enzyme activation. Biochemical characterization of the activated loop variant, hereafter termed the β-hairpin variant, showed a ninefold increase in kcat/K0.5 value compared with wild-type GCK. Cooperativity was also reduced in the β-hairpin variant, with the Hill coefficient decreasing from 1.7 to 1.3 (Table S3). The level of enzyme activation observed in the β-hairpin variant (kcat/K0.5 = 5 × 10⁴ M−1⋅s−1) equals that previously achieved by optimizing the sequence of the α13 helix using a similar genetic selection strategy (43).
Table S3.
Kinetic and thermodynamic characteristics of GCK variants
| Parameter | Wild-type | β-hairpin | α13-helix | α13 helix + β-hairpin |
| kcat, s−1 | 50 ± 0.5 | 84 ± 7.2 | 50 ± 2.0 | 86 ± 2.0 |
| K0.5, glucose, mM | 8.1 ± 0.4 | 1.6 ± 0.3 | 1.0 ± 0.1 | 0.14 ± 0.01 |
| Hill coefficient | 1.7 ± 0.1 | 1.3 ± 0.1 | 1.2 ± 0.1 | 1.0 ± 0.1 |
| Km, ATP, mM | 0.50 ± 0.01 | 1.1 ± 0.1 | 0.16 ± 0.01 | 0.70 ± 0.1 |
| KD, glucose, mM | 2.9 ± 0.2 | 8.7 ± 2.0 | 0.049 ± 0.02 | 0.056 ± 0.008 |
| kcat/K0.5, M−1⋅s−1 | (6.2 ± 0.1) x 103 | (5.3 ± 0.1) x 104 | (5.0 ± 0.1) x 104 | (6.1 ± 0.1) x 105 |
A Unique Mechanism for GCK Activation.
To investigate the functional basis for activation in the β-hairpin variant, we used proteolysis kinetics. The apparent rate constants for proteolysis of wild-type GCK and the β-hairpin variant were determined by monitoring the time-dependent decay in enzyme activity following exposure to thermolysin (Fig. 2B). Proteolysis of both proteins follows an EX2 mechanism (38), as revealed by the linear dependencies of kobs on thermolysin concentration (Fig. 2B, Inset). Proteolysis kinetics established a value for Kop, the equilibrium constant between the cleavable and uncleavable forms of the loop, of 0.011 for wild-type GCK (Table 1). Thus, the cleavable form of unliganded GCK is 1.1% of the total ensemble, and the difference in free energy between the cleavable and uncleavable forms is 2.7 kcal/mol. Comparing the proteolysis of wild-type GCK with other systems investigated by limited proteolysis reveals that the level of disorder in the 151–180 loop is high. For example, proteolysis of ribonuclease H by thermolysin under nondenaturing conditions is characterized by a Kop value of 8.7 × 10⁻⁵, indicating that the cleavable form is only 0.0087% of the total population (38). Similarly, the cleavable form of maltose binding protein is only 0.000084% of the total population (39). In the β-hairpin variant, the Kop value increases to 0.023, indicating that the population of the cleavable form in the absence of glucose more than doubles compared with wild-type GCK. The higher Kop value of the β-hairpin variant suggests an alteration in the structure and/or dynamics of the mobile loop. Because proteolysis requires sites with high segmental mobility that are devoid of secondary structure (37, 40), the increased proteolytic susceptibility of the β-hairpin variant compared with wild-type GCK is consistent with an increase in loop flexibility.
Table 1.
Proteolysis constants for wild-type and activated GCK variants
| Protein | Kop (x 10−2) | ΔGc-u, kcal/mol |
| α13 helix | 0.63 ± 0.05 | 3.00 ± 0.2 |
| V455M | 0.64 ± 0.06 | 2.99 ± 0.3 |
| S64P | 0.77 ± 0.07 | 2.89 ± 0.3 |
| T65I | 1.0 ± 0.1 | 2.73 ± 0.2 |
| Wild-type | 1.1 ± 0.08 | 2.70 ± 0.2 |
| α13 helix + β-hairpin | 1.2 ± 0.09 | 2.64 ± 0.2 |
| M197V | 1.7 ± 0.1 | 2.40 ± 0.2 |
| β-hairpin | 2.3 ± 0.2 | 2.23 ± 0.2 |
| I211F | 3.7 ± 0.3 | 1.95 ± 0.2 |
| Y214C | 5.1 ± 0.7 | 1.76 ± 0.2 |
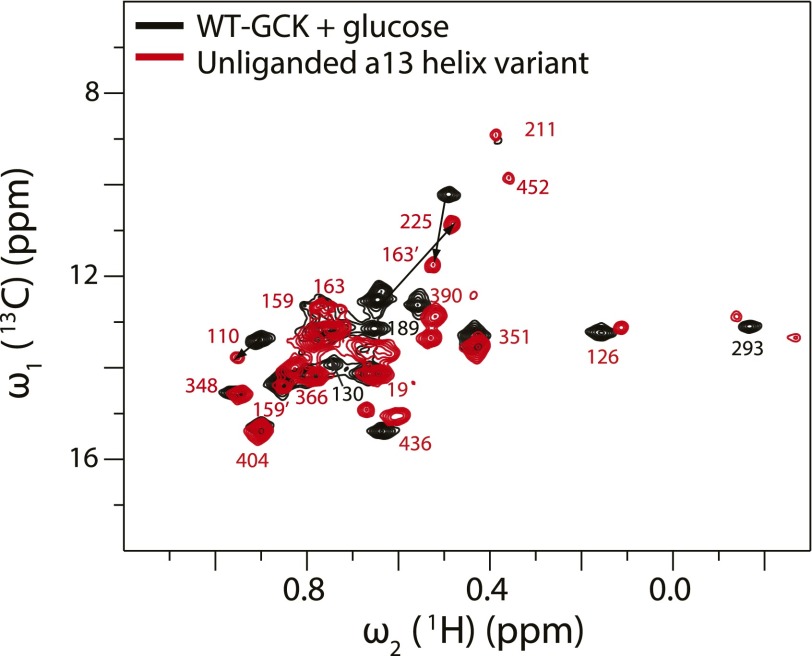
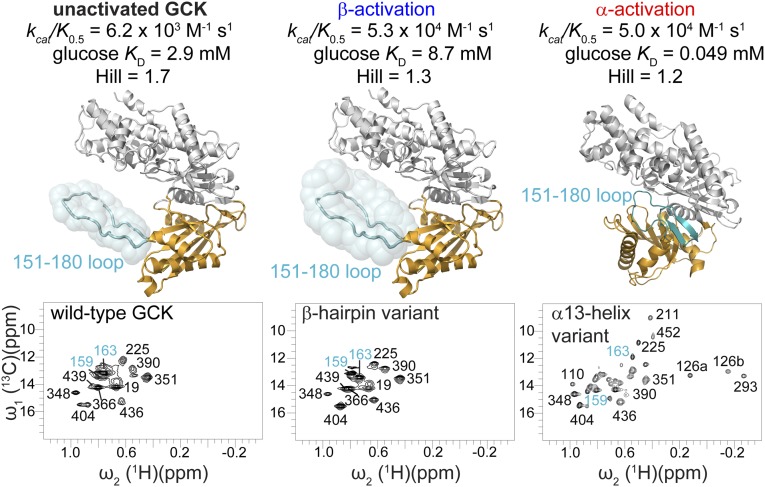
The β-hairpin activation mechanism, hereafter termed β-type, is notably different from the previously described, α-type mechanism by which small-molecule allosteric activators and other GCK variants operate. Two-dimensional 1H-13C HMQC analysis of GCK collected in the presence of an allosteric activator demonstrates that α-type activation is accomplished by a shift in the population of the enzyme toward a state resembling the glucose-bound conformation (27). Similarly, the α13 helix variant displays a 2D 1H-13C HMQC spectrum that resembles the wild-type glucose-bound spectrum (Fig. S5), with sharper lines and a larger number of observable small domain cross-peaks (Fig. 3) (27). In contrast to these findings, the 2D 1H-13C HMQC spectrum of the β-hairpin variant fails to reveal the appearance of additional cross-peaks from the small domain. Further evidence that the β-hairpin variant employs a distinct activation mechanism comes from the observation that the β-hairpin variant shows a threefold weaker affinity for glucose compared with wild-type GCK, whereas the α13 helix variant displays a 60-fold increase in equilibrium affinity for glucose (Table S3) (43).
Fig. S5.
Overlay of 1H-13C Ile HMQC spectra of glucose-bound wild-type GCK with the unliganded α13-helix variant. In the unliganded α13-helix variant, I159 and I163 each display two peaks. One is in the disordered region corresponding to their position in the glucose bound wild-type, whereas the other peak is shifted away from the disordered region (denoted with a prime).
Fig. 3.
Two functionally distinct mechanisms of GCK activation. α-type activation, as exemplified by the α13-helix variant, shifts the ensemble structure toward a state resembling the glucose-bound conformation, as evidenced by increased sharpness of cross-peaks, shifting of mobile loop cross-peaks away from the disordered region of the spectrum, and the appearance of new cross-peaks. β-type activation, as exemplified by the β-hairpin variant, alters the structure and/or dynamics of the mobile loop (cyan), as evidenced by increased sharpness of mobile loop cross-peaks that remain in the disordered region of the spectrum.
To investigate whether both α- and β-type mechanisms are involved in physiologically relevant GCK activation, we examined a series of naturally occurring PHHI-associated variants (30). Thermolysin proteolysis kinetics revealed that the S64P, T65I, and V455M variants decrease the proteolytic susceptibility of the loop in the unliganded state, indicating that local unfolding of the mobile loop is decreased (Table 1). Similar to the α13 helix variant, S64P displays a 25-fold increase in equilibrium affinity for glucose and the NMR spectrum demonstrates an increased prevalence of a state resembling the glucose-bound conformation (27). Conversely, M197V, I211F, and Y214C increase proteolytic susceptibility without substantially altering the affinity toward glucose. Notably, the Y214C variant displays the largest increase in Kop value, where the cleavable form of this enzyme increases to 5.1% of the total unliganded population. These findings suggest that both activation mechanisms are operational in GCK disease variants.
We also examined the thermodynamic consequences of activation via both mechanisms by measuring the temperature dependence of glucose KD values. The low affinity of GCK for glucose precludes the use of isothermal titration calorimetry for thermodynamic analysis (Table S3). Van’t Hoff analysis demonstrates that glucose binding is endothermic and driven by a favorable change in entropy for all enzyme variants. The ΔH value for glucose binding to wild-type GCK at 25 °C is 12.9 ± 0.3 kcal/mol and the TΔS is 15.7 ± 0.3 kcal/mol, in agreement with literature precedent (44). For the β-hairpin variant, glucose binding produces similar values, with ΔH = 12.0 ± 0.3 kcal/mol and TΔS = 15.4 ± 0.3 kcal/mol. The thermodynamic signature of glucose binding to the α13 helix variant is strikingly different, with ΔH = 2.6 ± 0.1 and TΔS = 8.4 ± 0.1. The smaller change in entropy produced by glucose association with the α13 helix variant is consistent with NMR data, which suggest that the unliganded ensemble is shifted toward a narrower distribution of states. Contributions of conformational entropy to the thermodynamics of ligand binding have been established in several protein and peptide systems (15, 19, 45, 46), yet the extent to which conformational entropy plays a role in the thermodynamics of glucose association with GCK remains to be determined. Differences in solvation entropy between individual conformational states and enzyme variants, which might significantly contribute to the measured entropy, are also unknown.
Engineering a Hyperactive, Noncooperative GCK.
To explore the maximum level of activity attainable by leveraging both activation mechanisms, we constructed a GCK variant that incorporates the substitutions identified in both the β-hairpin and α13 helix variants. The resulting protein differs from wild-type GCK at seven amino acid positions, and kinetic characterization of this variant reveals that cooperativity is fully abolished (Table S3). Moreover, the kcat/Km value displayed by this noncooperative GCK is 6.1 × 10⁵ M−1⋅s−1, which represents a striking 100-fold increase in catalytic efficiency over wild-type GCK. This hyperactive, noncooperative GCK variant also displays an increase in equilibrium binding affinity for glucose compared with wild-type GCK. It is noteworthy that these kinetic and thermodynamic features match those displayed by noncooperative human hexokinase isozymes I–III (47–49). In particular, the glucose Km value for this variant is 140 µM, which matches the Km values of other high-affinity representatives of the hexokinase family (47). Our engineered, noncooperative variant is the most active form of GCK thus far reported. Interestingly, this protein is also resistant to inhibition by the glucokinase regulatory protein (Table S4). GKRP exclusively targets the super-open conformation of GCK, in which the large and small domains are separated by a large opening angle (50). This finding suggests that the conformational ensemble of hyperactive, noncooperative GCK is shifted such that the super-open state is substantially depopulated. Collectively, our results demonstrate that targeted substitution of just a small number of GCK residues is sufficient to convert this allosteric monomeric enzyme into a noncooperative catalyst that is highly sensitive toward glucose.
Table S4.
The hyperactive α13-helix + β-hairpin variant GCK is not inhibited by recombinant rat GKRP
| Condition | Rate, nmoles G6P/min |
| α13-helix + β-hairpin | 40.7 ± 0.1 |
| α13-helix + β-hairpin with sorbitol-6-phosphate (500 μM) | 41.9 ± 0.3 |
| α13-helix + β-hairpin with sorbitol-6-phosphate (500 μM) and GKRP (10 μM) | 45.2 ± 0.3 |
All rates are the average of two trials ± SD. Rates were determined via LDH/PK linked enzyme assay as described in Materials and Methods in the presence of 5 mM glucose and 22 nM of the α13-helix + β-hairpin variant GCK. Under identical conditions, wild-type GCK activity is reduced 20% by the presence of GKRP and sorbitol 6-phosphate.
Activation Mechanisms and GCK Cooperativity.
The discovery that site-specific substitutions in the mobile loop alter the allosteric properties of human GCK is consistent with our current understanding of kinetic cooperativity in this monomeric enzyme. Unliganded GCK is postulated to sample multiple conformational states that are distinguishable from one another, in part, by the magnitude of the opening angle between the small and large domains. Cooperativity is dictated by the equilibrium distribution of states within the unliganded ensemble and the rates of interconversion between these states, both of which are impacted by physiological concentrations of glucose. In α-type activation, as exemplified by the α13 helix variant, the thermodynamic distribution of enzyme states is perturbed and the ensemble structure is shifted in favor of the glucose-bound state. Allosteric effectors operate via this same mechanism, to promote an increase in the equilibrium concentration of a more compact, closed state. In contrast, β-type activation, as exemplified by the β-hairpin variant, results from an alteration in the structure and/or dynamics of the mobile loop.
How might alterations in the loop activate catalysis and reduce cooperativity? A clue to that question may be provided by the observation from viscosity variation experiments that product release partially limits the value of kcat for wild-type GCK (51). In principle, an increase in loop mobility could enhance turnover by facilitating access to, and egress from, the active site. The extent to which the detailed structural and dynamic properties of the mobile loop are altered by the substitutions present in the β-hairpin variant warrants further investigation to establish the detailed mechanism by which activation is achieved. An interesting remaining question concerns the extent to which the dynamics of the mobile loop, which appears to be rapid on the NMR timescale, might be coupled to the slower motions associated with the larger scale reorganization of the small domain that occur during the catalytic cycle.
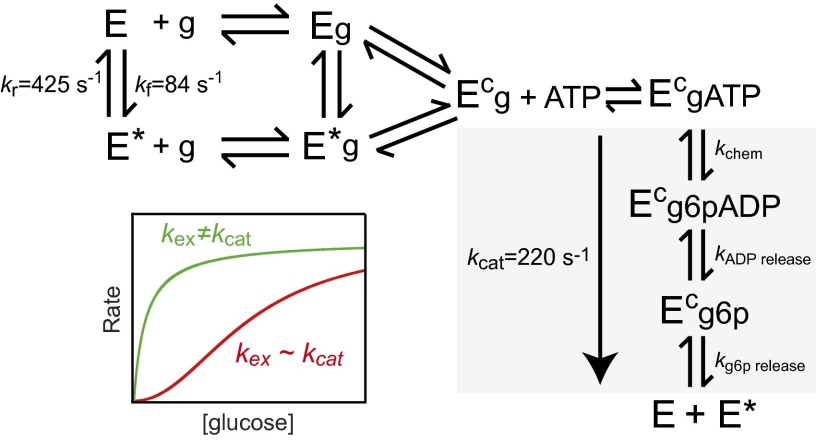
Incorporating the present findings within the context of prior work allows us to develop a model for GCK cooperativity that semiquantitatively explains both activation mechanisms (Fig. 4). Transient-state glucose binding experiments and NMR studies support a kinetic model that involves two distinct unliganded enzyme conformations, a ground state (E) and an excited state (E*) (49, 52). Kinetic CPMG NMR experiments quantified the rate constant for exchange between E and E*, kex, and demonstrated that it overlaps with the value of kcat (36). The near equivalency in these kinetic parameters ensures that rapid equilibrium in substrate binding is not obtained during catalysis (53, 54). Accordingly, the sigmoidal kinetics of GCK results from differential flux through the nonequilibrated E and E* catalytic pathways as glucose concentrations vary across the physiological range. This model reveals that GCK can be activated, and cooperativity reduced, by altering the values of kex and/or kcat such that conformational interconversion no longer coincides with turnover. Altering the values of the forward and/or reverse rate constants for conformational exchange, such that the equilibrium distribution between E and E* is shifted toward one state, results in α-type activation. β-type activation occurs when the equivalency between the values of kex and kcat is removed without eliminating the two-state behavior of unliganded GCK. Thus, the model presented in Fig. 4 unifies the seemingly disparate activation mechanisms and provides a general framework for understanding noncooperative disease variants that cause hyperinsulinemia.
Fig. 4.
Model of GCK cooperativity. Unliganded GCK undergoes millisecond exchange between E and E* with a rate constant (kex = kf + kr) comparable to kcat, which produces kinetic cooperativity (red). Cooperativity is reduced (green) by alterations in kex or kcat such that these values are no longer comparable. α-type activation results from alterations in kex that cause a population shift toward one-state, whereas β-type activation results from alterations in kex and/or kcat that do not substantially perturb the conformational equilibrium. Steps that contribute to the value of kcat are colored gray, g is glucose, g6p is glucose 6-phosphate, and values for kex, kf, kr, and kcat are from ref. 36.
Conclusions
The ultimate test of an allosteric model is the ability to use the resulting conceptual framework to modify the allosteric response in defined ways. Here, we show that we can tailor kinetic cooperativity in a monomeric, single-site enzyme by modifying discrete structural features of the catalyst. Indeed, our findings suggest that GCK cooperativity is intimately linked to both the equilibrium distribution of conformers within the unliganded ensemble and the motional dynamics associated with substrate binding and product release. Collectively, the data suggest that targeted alterations of a protein’s dynamic conformational landscape may represent a general strategy for engineering allostery into protein scaffolds that do not presently possess such capabilities (55).
Materials and Methods
An Activated GCK with Optimized β-Hairpin.
A library of GCK coding sequences with residues 154–157, 161, and 162 randomized was generated via gapped-duplex ligation as described (43). The library was transformed into glucokinase-deficient BM5430(DE3) Escherichia coli cells for selection experiments. Glucose and IPTG were optimized such that cells harboring wild-type GCK produced colonies after 5 d of growth at 37 °C. The activated variant identified from the library, R155H-H156M-E157L-K161V, produced colonies after 18 h under these same conditions.
NMR Measurements.
Isotopically labeled GCK was produced as described (27, 41). NMR spectra of GCK samples were collected at a 800-MHz proton frequency on a Bruker Avance instrument equipped with a TCI cryogenic probe. 1H-13C methyl-TROSY HMQC 2D NMR experiments were recorded as matrices of 512 × 128 complex data points for the wild-type and 1024 × 256 complex data points for β-hairpin variants, respectively. Data were processed with NMRPipe (56) and CcpNmr (57) software.
Proteolysis.
The thermolysin cleavage site in GCK was determined via N-terminal sequencing. The intrinsic rate constant, kint, for cleavage of this site was determined by measuring cleavage of a fluorogenic peptide corresponding to the sequence of the cleavage site. Proteolysis kinetics of wild-type and activated GCK variants were determined by measuring the decay of GCK activity upon exposure to increasing amounts of thermolysin. Proteolysis of GCK follows an EX2 type mechanism (38). Fitting of observed decay rates yields equilibrium constants, Kop, that describe the local unfolding state of the cleavage site.
Full experimental details can be found in SI Materials and Methods.
SI Materials and Methods
Production of a GCK with an Optimized Mobile Loop/β-Hairpin Sequence.
Two endogenous restriction sites, Bsu36I and AvrII, within the GCK expression plasmid pBGM101 were used to insert the gapped-duplex library. A second Bsu36I site located upstream in the GCK coding sequence was removed via QuikChange site-directed mutagenesis. Fifty micrograms of the plasmid encoding GCK was digested overnight at 37 °C in 1× reaction buffer 3 (New England Biolabs) with Bsu36I (64 U) and AvrII (10 U). The restriction enzymes were heat inactivated, and the insert was removed with a Sephacryl S-200 spin column (GE Healthcare). The digested vector was then eluted and desalted with a G-50 spin column (GE Healthcare). This procedure produced a template vector with Bsu36I and AvrII overhangs complementary to the gapped-duplex library.
The gapped-duplex oligonucleotide sequence was designed to span the region from residue Val154 to Gly162 with randomized codons at amino acid positions 154–157 and 161–162. The oligonucleotide sequence (LIB) was 5′-CTAGGCTTCACCTTCTCCTTTCCT(XNK)4GACATCGAT(XNK)2ATCCTTCTCAACTGGACCAAGGGCTTCAAGGCC-3′. The base composition of the randomized XNK codons was as follows: X = A(32%)/C(21%)/G(39%)/T(8%); N = A(25%)/C(25%)/G(25%)/T(25%); K = T(50%)/G(50%). The duplex library was prepared by annealing the LIB oligonucleotide to two shorter oligonucleotides, Oligo1 (5′-TGAGGCCTTGAAGC CCTTGGTCC-3′) and Oligo2 (5′-GATCCCTTATCGAT-3′), complementary to the nonrandom ends of the LIB oligonucleotide, leaving 5′ and 3′ ends compatible with the digested template vector. All oligonucleotides were ordered from Integrated DNA Technologies and were phosphorylated at the 5′ end. LIB was mixed with 10-fold excess Oligo1 and Oligo2 in annealing buffer containing 20 mM Tris⋅HCl (pH 7.0), 2 mM MgCl2, and 50 mM NaCl, heated to 65 °C for 15 min then allowed to cool to room temperature. The annealed library was mixed with 5.5 µg of digested template vector and T4 DNA Ligase (200 U) (New England Biolabs) in 1× T4 DNA Ligase reaction buffer. The ligated library was precipitated by addition of sodium acetate to 75 mM (pH 5) and three volumes of ice-cold 100% ethanol. The precipitate was pelleted by centrifugation at 21,000 × g for 10 min, dried at 45 °C for 10 min, and resuspended in 10 µL of warm nuclease-free ddH2O.
Library analysis was performed following transformation and plating of BM5340(DE3) E. coli cells on LB agar supplemented with 150 µg/mL ampicillin, 40 µg/mL kanamycin, and 25 µg/mL chloramphenicol. The estimated library size was 3.6 × 10⁵. To estimate codon distribution in the randomized library, plasmid DNA from overnight cultures of 20 colonies was purified and sequenced. Selections were performed by plating 104 cfu per plate. Glucose (800 µM) and IPTG (50 µM) concentrations were optimized such that wild-type GCK restored growth after 5 d of incubation at 37 °C. Under identical conditions, the β-hairpin quadruple variant produced colonies after 18 h. Kinetic parameters and equilibrium dissociation constants for glucose were measured as described (34, 41).
Proteolysis.
Thermolysin from Bacillus proteolyticus rokko was purchased from Sigma (T7902) and diluted to ∼10 mg/mL (2.5 M NaCl; 0.1 M CaCl2) and stored at −20 °C until use. No further purification was performed. To measure the intrinsic rate constant of cleavage, kint (equivalent to kcat/Km), of the site identified by N-terminal sequencing, proteolytic rates of a fluorogenic peptide corresponding to the cleavage sequence (ABZ-K-G-F-K-pNA) (Peptide 2.0) were determined. Rates of ABZ fluorescence increase due to peptide cleavage were measured on a Cary Eclipse Fluorescence Spectrometer housed in the Physical Biochemistry Facility in the Institute of Molecular Biophysics at Florida State University with excitation at 323 nm and emission at 420 nm. Assays were performed at room temperature in 50 mM Hepes, pH 7.6, 50 mM KCl, 10 mM CaCl2, and 10 mM DTT with 4–30 μM peptide. Proteolysis was initiated by addition of 33 nM thermolysin. Rates vs. [peptide] were fitted to a straight line, the slope of which is kint. At 0 mM glucose, kint was 118,994 ± 8,934 M−1⋅s−1 and was unchanged at 200 mM glucose. This rate is in agreement with second-order rate constants of thermolysin cleavage of similar peptides (38, 39).
N-terminal hexahistidine-tagged recombinant pancreatic human GCK and activated variants were produced and purified as described (43). Proteolysis conditions for GCK were as follows: 50 mM Hepes, pH 7.6, 50 mM KCl, 10 mM CaCl2, 10 mM DTT, and either 0 or 200 mM glucose. Final reaction volumes were 500 μL. Five to 10 micromolar GCK was equilibrated in the above solution for 10 min. Proteolysis was initiated by addition of thermolysin. To determine proteolytic constants, [Thermolysin] was varied, whereas [GCK] was held constant for a single GCK variant and condition (i.e., plus or minus glucose). Forty-microliter aliquots of the proteolysis reaction were taken at appropriate time points and protease activity quenched by addition of 10 μL of 100 mM EDTA. Proteolysis was monitored by measuring GCK activity spectrophotometrically by using an NADH-coupled LDH/PK assay as described (43). Rates of proteolysis (kobs) were determined by fitting GCK percent activity vs. time curves to a single exponential decay function. Plots of kobs as a function of thermolysin concentration were fitted with either a linear function to provide Kop, the equilibrium constant between the cleavable and uncleavable forms of GCK, or a hyperbolic function, which provides values of Kop and kop, the rate constant of opening of the cleavage site.
The proteolysis patterns of GCK digestion were visualized by using SDS/PAGE, whereby 10 μL of each quenched reaction mixture was removed, mixed with 5 μL of SDS sample buffer containing 5% (vol/vol) BME and heated at 80 °C for 5 min. Samples were run on 16.5% acrylamide gels at 150 V for 1.5 h. Gels were fixed and stained with Coomassie Brilliant Blue G-Colloidal (Sigma) according to manufacturer’s protocol. For proteolysis fragment identification, a C-terminal hexa-histidine tagged GCK was used to allow unambiguous identification by N-terminal sequencing. A proteolysis reaction was set up as above, but with a 100-μL final volume. Thermolysin was added, and after 5 min, the reaction was quenched by addition of EDTA. The sample was split into four aliquots, 20 μL of SDS sample buffer was added, and samples were heated at 100 °C for 5 min. All four samples were loaded onto a 16.5% acrylamide gel allowing sufficient quantity of sample for N-terminal sequencing. SDS/PAGE was run as described above. After electrophoresis, the samples were transferred to a PVDF membrane at 20 V and 80 mA at 4 °C overnight. The membrane was stained with Coomassie and submitted to the Analytical Laboratory at Florida State University for N-terminal sequencing by Edman degradation.
NMR Sample Preparation, Data Collection, and Analysis.
GCK variant constructs from the β-hairpin selection were transformed into BM5340(DE3) and one colony was inoculated into 50 mL of LB containing ampicilin (150 µg/mL), chloramphenicol (100 µg/mL), and kanamycin (50 µg/ mL). Large-scale cultures were inoculated to a starting OD600 of 0.01. Protein expression was induced by addition of IPTG to 1 mM at an OD600 of 0.8. Expression was carried out at 20 °C for 20 h. Cells were lysed by French Press. Ni2+-affinity chromatography was performed as described above. Samples were then dialyzed against 1 L of 50 mM potassium phosphate buffer containing KCl and 10 mM DTT and concentrated until the volume reached less than 1 mL. Concentrated enzyme was loaded onto a S-300 SE column equilibrated with the same buffer used for dialysis at 0.12 mL/min. NMR data were collected at 800 MHz proton frequency on a Bruker Avance instrument equipped with a TCI cryogenic probe. GCK samples for NMR were prepared in potassium phosphate buffer (25 mM, pH 8.0), containing KCl (25 mM), DTT (10 mM), deuterated glycerol (5% vol/vol), and D2O (∼10% vol/vol). 1H-13C methyl-TROSY HMQC 2D NMR experiments were recorded as matrices of 512 × 128 complex data points for the wild-type and 1024 × 256 complex data points for β-hairpin variants, respectively. Data were processed with NMRPipe (55) and CcpNmr (56) software.
Acknowledgments
This work was supported by American Heart Association Grant 12POST12040344 (to M.L.), National Science Foundation Grant MCB-0918362 (to R.B.), and NIH Grant 1R01DK081358 (to B.G.M.).
Footnotes
The authors declare no conflict of interest.
This article is a PNAS Direct Submission. A.J.W. is a guest editor invited by the Editorial Board.
See Commentary on page 11430.
This article contains supporting information online at www.pnas.org/lookup/suppl/doi:10.1073/pnas.1506664112/-/DCSupplemental.
References
- 1.Changeux JP. 50 years of allosteric interactions: The twists and turns of the models. Nat Rev Mol Cell Biol. 2013;14(12):819–829. doi: 10.1038/nrm3695. [DOI] [PubMed] [Google Scholar]
- 2.Monod J, Wyman J, Changeux JP. On the nature of allosteric transitions: A plausible model. J Mol Biol. 1965;12:88–118. doi: 10.1016/s0022-2836(65)80285-6. [DOI] [PubMed] [Google Scholar]
- 3.Koshland DE, Jr, Némethy G, Filmer D. Comparison of experimental binding data and theoretical models in proteins containing subunits. Biochemistry. 1966;5(1):365–385. doi: 10.1021/bi00865a047. [DOI] [PubMed] [Google Scholar]
- 4.Macol CP, Tsuruta H, Stec B, Kantrowitz ER. Direct structural evidence for a concerted allosteric transition in Escherichia coli aspartate transcarbamoylase. Nat Struct Biol. 2001;8(5):423–426. doi: 10.1038/87582. [DOI] [PubMed] [Google Scholar]
- 5.Freiburger L, et al. Substrate-dependent switching of the allosteric binding mechanism of a dimeric enzyme. Nat Chem Biol. 2014;10(11):937–942. doi: 10.1038/nchembio.1626. [DOI] [PubMed] [Google Scholar]
- 6.Motlagh HN, Wrabl JO, Li J, Hilser VJ. The ensemble nature of allostery. Nature. 2014;508(7496):331–339. doi: 10.1038/nature13001. [DOI] [PMC free article] [PubMed] [Google Scholar]
- 7.Henzler-Wildman K, Kern D. Dynamic personalities of proteins. Nature. 2007;450(7172):964–972. doi: 10.1038/nature06522. [DOI] [PubMed] [Google Scholar]
- 8.Cui Q, Karplus M. Allostery and cooperativity revisited. Protein Sci. 2008;17(8):1295–1307. doi: 10.1110/ps.03259908. [DOI] [PMC free article] [PubMed] [Google Scholar]
- 9.Tompa P. Intrinsically disordered proteins: A 10-year recap. Trends Biochem Sci. 2012;37(12):509–516. doi: 10.1016/j.tibs.2012.08.004. [DOI] [PubMed] [Google Scholar]
- 10.Uversky VN. A decade and a half of protein intrinsic disorder: Biology still waits for physics. Protein Sci. 2013;22(6):693–724. doi: 10.1002/pro.2261. [DOI] [PMC free article] [PubMed] [Google Scholar]
- 11.Schulenburg C, Hilvert D. Protein conformational disorder and enzyme catalysis. Top Curr Chem. 2013;337:41–67. doi: 10.1007/128_2012_411. [DOI] [PubMed] [Google Scholar]
- 12.Eisenmesser EZ, Bosco DA, Akke M, Kern D. Enzyme dynamics during catalysis. Science. 2002;295(5559):1520–1523. doi: 10.1126/science.1066176. [DOI] [PubMed] [Google Scholar]
- 13.Wolf-Watz M, et al. Linkage between dynamics and catalysis in a thermophilic-mesophilic enzyme pair. Nat Struct Mol Biol. 2004;11(10):945–949. doi: 10.1038/nsmb821. [DOI] [PubMed] [Google Scholar]
- 14.Schrank TP, Bolen DW, Hilser VJ. Rational modulation of conformational fluctuations in adenylate kinase reveals a local unfolding mechanism for allostery and functional adaptation in proteins. Proc Natl Acad Sci USA. 2009;106(40):16984–16989. doi: 10.1073/pnas.0906510106. [DOI] [PMC free article] [PubMed] [Google Scholar]
- 15.Popovych N, Sun S, Ebright RH, Kalodimos CG. Dynamically driven protein allostery. Nat Struct Mol Biol. 2006;13(9):831–838. doi: 10.1038/nsmb1132. [DOI] [PMC free article] [PubMed] [Google Scholar]
- 16.Ferreon AC, Ferreon JC, Wright PE, Deniz AA. Modulation of allostery by protein intrinsic disorder. Nature. 2013;498(7454):390–394. doi: 10.1038/nature12294. [DOI] [PMC free article] [PubMed] [Google Scholar]
- 17.Volkman BF, Lipson D, Wemmer DE, Kern D. Two-state allosteric behavior in a single-domain signaling protein. Science. 2001;291(5512):2429–2433. doi: 10.1126/science.291.5512.2429. [DOI] [PubMed] [Google Scholar]
- 18.Masterson LR, Mascioni A, Traaseth NJ, Taylor SS, Veglia G. Allosteric cooperativity in protein kinase A. Proc Natl Acad Sci USA. 2008;105(2):506–511. doi: 10.1073/pnas.0709214104. [DOI] [PMC free article] [PubMed] [Google Scholar]
- 19.Tzeng SR, Kalodimos CG. Protein activity regulation by conformational entropy. Nature. 2012;488(7410):236–240. doi: 10.1038/nature11271. [DOI] [PubMed] [Google Scholar]
- 20.Hilser VJ, Wrabl JO, Motlagh HN. Structural and energetic basis of allostery. Annu Rev Biophys. 2012;41:585–609. doi: 10.1146/annurev-biophys-050511-102319. [DOI] [PMC free article] [PubMed] [Google Scholar]
- 21.Tsai CJ, Nussinov R. A unified view of “how allostery works”. PLOS Comput Biol. 2014;10(2):e1003394. doi: 10.1371/journal.pcbi.1003394. [DOI] [PMC free article] [PubMed] [Google Scholar]
- 22.Porter CM, Miller BG. Cooperativity in monomeric enzymes with single ligand-binding sites. Bioorg Chem. 2012;43:44–50. doi: 10.1016/j.bioorg.2011.11.001. [DOI] [PMC free article] [PubMed] [Google Scholar]
- 23.Ricard J, Meunier JC, Buc J. Regulatory behavior of monomeric enzymes. 1. The mnemonical enzyme concept. Eur J Biochem. 1974;49(1):195–208. doi: 10.1111/j.1432-1033.1974.tb03825.x. [DOI] [PubMed] [Google Scholar]
- 24.Ainslie GR, Jr, Shill JP, Neet KE. Transients and cooperativity. A slow transition model for relating transients and cooperative kinetics of enzymes. J Biol Chem. 1972;247(21):7088–7096. [PubMed] [Google Scholar]
- 25.Frieden C. Slow transitions and hysteretic behavior in enzymes. Annu Rev Biochem. 1979;48:471–489. doi: 10.1146/annurev.bi.48.070179.002351. [DOI] [PubMed] [Google Scholar]
- 26.Cornish-Bowden A, Cardenas ML. Glucokinase: A monomeric enzyme with positive cooperativity. In: Matchinsky FM, Magnuson MA, editors. Glucokinase and Glycemic Disease, from Basics to Novel Therapeutics. Karger; Basel: 2004. pp. 125–134. [Google Scholar]
- 27.Larion M, Salinas RK, Bruschweiler-Li L, Miller BG, Brüschweiler R. Order-disorder transitions govern kinetic cooperativity and allostery of monomeric human glucokinase. PLoS Biol. 2012;10(12):e1001452. doi: 10.1371/journal.pbio.1001452. [DOI] [PMC free article] [PubMed] [Google Scholar]
- 28.Matschinsky FM. Glucokinase as glucose sensor and metabolic signal generator in pancreatic β-cells and hepatocytes. Diabetes. 1990;39(6):647–652. doi: 10.2337/diab.39.6.647. [DOI] [PubMed] [Google Scholar]
- 29.Vionnet N, et al. Nonsense mutation in the glucokinase gene causes early-onset non-insulin-dependent diabetes mellitus. Nature. 1992;356(6371):721–722. doi: 10.1038/356721a0. [DOI] [PubMed] [Google Scholar]
- 30.Osbak KK, et al. Update on mutations in glucokinase (GCK), which cause maturity-onset diabetes of the young, permanent neonatal diabetes, and hyperinsulinemic hypoglycemia. Hum Mutat. 2009;30(11):1512–1526. doi: 10.1002/humu.21110. [DOI] [PubMed] [Google Scholar]
- 31.Wabitsch M, et al. Heterogeneity in disease severity in a family with a novel G68V GCK activating mutation causing persistent hyperinsulinaemic hypoglycaemia of infancy. Diabet Med. 2007;24(12):1393–1399. doi: 10.1111/j.1464-5491.2007.02285.x. [DOI] [PubMed] [Google Scholar]
- 32.Gloyn AL, et al. Insights into the biochemical and genetic basis of glucokinase activation from naturally occurring hypoglycemia mutations. Diabetes. 2003;52(9):2433–2440. doi: 10.2337/diabetes.52.9.2433. [DOI] [PubMed] [Google Scholar]
- 33.Christesen HBT, et al. Activating glucokinase (GCK) mutations as a cause of medically responsive congenital hyperinsulinism: Prevalence in children and characterisation of a novel GCK mutation. Eur J Endocrinol. 2008;159(1):27–34. doi: 10.1530/EJE-08-0203. [DOI] [PubMed] [Google Scholar]
- 34.Pal P, Miller BG. Activating mutations in the human glucokinase gene revealed by genetic selection. Biochemistry. 2009;48(5):814–816. doi: 10.1021/bi802142q. [DOI] [PubMed] [Google Scholar]
- 35.Kamata K, Mitsuya M, Nishimura T, Eiki J, Nagata Y. Structural basis for allosteric regulation of the monomeric allosteric enzyme human glucokinase. Structure. 2004;12(3):429–438. doi: 10.1016/j.str.2004.02.005. [DOI] [PubMed] [Google Scholar]
- 36.Larion M, et al. Kinetic cooperativity in human pancreatic glucokinase originates from millisecond dynamics of the small domain. Angew Chem Int Ed Engl. 2015;54(28):8129–8132. doi: 10.1002/anie.201501204. [DOI] [PMC free article] [PubMed] [Google Scholar]
- 37.Fontana A, et al. Probing protein structure by limited proteolysis. Acta Biochim Pol. 2004;51(2):299–321. [PubMed] [Google Scholar]
- 38.Park C, Marqusee S. Probing the high energy states in proteins by proteolysis. J Mol Biol. 2004;343(5):1467–1476. doi: 10.1016/j.jmb.2004.08.085. [DOI] [PubMed] [Google Scholar]
- 39.Chang Y, Park C. Mapping transient partial unfolding by protein engineering and native-state proteolysis. J Mol Biol. 2009;393(2):543–556. doi: 10.1016/j.jmb.2009.08.006. [DOI] [PubMed] [Google Scholar]
- 40.Hubbard SJ. The structural aspects of limited proteolysis of native proteins. Biochim Biophys Acta. 1998;1382(2):191–206. doi: 10.1016/s0167-4838(97)00175-1. [DOI] [PubMed] [Google Scholar]
- 41.Larion M, Salinas RK, Bruschweiler-Li L, Brüschweiler R, Miller BG. Direct evidence of conformational heterogeneity in human pancreatic glucokinase from high-resolution nuclear magnetic resonance. Biochemistry. 2010;49(37):7969–7971. doi: 10.1021/bi101098f. [DOI] [PMC free article] [PubMed] [Google Scholar]
- 42.Wishart DS, Sykes BD. The 13C chemical-shift index: A simple method for the identification of protein secondary structure using 13C chemical-shift data. J Biomol NMR. 1994;4(2):171–180. doi: 10.1007/BF00175245. [DOI] [PubMed] [Google Scholar]
- 43.Larion M, Miller BG. 23-Residue C-terminal alpha-helix governs kinetic cooperativity in monomeric human glucokinase. Biochemistry. 2009;48(26):6157–6165. doi: 10.1021/bi9007534. [DOI] [PubMed] [Google Scholar]
- 44.Molnes J, Bjørkhaug L, Søvik O, Njølstad PR, Flatmark T. Catalytic activation of human glucokinase by substrate binding: Residue contacts involved in the binding of D-glucose to the super-open form and conformational transitions. FEBS J. 2008;275(10):2467–2481. doi: 10.1111/j.1742-4658.2008.06391.x. [DOI] [PubMed] [Google Scholar]
- 45.Kasinath V, Sharp KA, Wand AJ. Microscopic insights into the NMR relaxation-based protein conformational entropy meter. J Am Chem Soc. 2013;135(40):15092–15100. doi: 10.1021/ja405200u. [DOI] [PMC free article] [PubMed] [Google Scholar]
- 46.Wand AJ. The dark energy of proteins comes to light: Conformational entropy and its role in protein function revealed by NMR relaxation. Curr Opin Struct Biol. 2013;23(1):75–81. doi: 10.1016/j.sbi.2012.11.005. [DOI] [PMC free article] [PubMed] [Google Scholar]
- 47.Wilson JE. Hexokinases. Rev Physiol Biochem Pharmacol. 1995;126:65–198. doi: 10.1007/BFb0049776. [DOI] [PubMed] [Google Scholar]
- 48.Wilson JE. Isozymes of mammalian hexokinase: Structure, subcellular localization and metabolic function. J Exp Biol. 2003;206(Pt 12):2049–2057. doi: 10.1242/jeb.00241. [DOI] [PubMed] [Google Scholar]
- 49.Larion M, Miller BG. Homotropic allosteric regulation in monomeric mammalian glucokinase. Arch Biochem Biophys. 2012;519(2):103–111. doi: 10.1016/j.abb.2011.11.007. [DOI] [PMC free article] [PubMed] [Google Scholar]
- 50.Beck T, Miller BG. Structural basis for regulation of human glucokinase by glucokinase regulatory protein. Biochemistry. 2013;52(36):6232–6239. doi: 10.1021/bi400838t. [DOI] [PMC free article] [PubMed] [Google Scholar]
- 51.Bowler JM, Hervert KL, Kearley ML, Miller BG. Small-molecule allosteric activation of human glucokinase in the absence of glucose. ACS Med Chem Lett. 2013;4(7):580–584. doi: 10.1021/ml400061x. [DOI] [PMC free article] [PubMed] [Google Scholar]
- 52.Larion M, Miller BG. Global fit analysis of glucose binding curves reveals a minimal model for kinetic cooperativity in human glucokinase. Biochemistry. 2010;49(41):8902–8911. doi: 10.1021/bi1008672. [DOI] [PMC free article] [PubMed] [Google Scholar]
- 53.Frieden C. Kinetic aspects of regulation of metabolic processes. The hysteretic enzyme concept. J Biol Chem. 1970;245(21):5788–5799. [PubMed] [Google Scholar]
- 54.Neet KE, Ainslie GR., Jr Hysteretic enzymes. Methods Enzymol. 1980;64:192–226. doi: 10.1016/s0076-6879(80)64010-5. [DOI] [PubMed] [Google Scholar]
- 55. doi: 10.1038/ncomms7968. Choi JH, Laurent AH, Hilser VJ, Ostermeier M (2015) Design of protein switches based on an ensemble model of allostery. Nat Commun 6:6968. [DOI] [PMC free article] [PubMed] [Google Scholar]
- 56.Delaglio F, et al. NMRPipe: A multidimensional spectral processing system based on UNIX pipes. J Biomol NMR. 1995;6(3):277–293. doi: 10.1007/BF00197809. [DOI] [PubMed] [Google Scholar]
- 57.Vranken WF, et al. The CCPN data model for NMR spectroscopy: Development of a software pipeline. Proteins. 2005;59(4):687–696. doi: 10.1002/prot.20449. [DOI] [PubMed] [Google Scholar]


