Significance
Epstein–Barr virus (EBV) is a human herpesvirus that establishes persistent infection of the B-cell compartment. EBV is associated with autoimmune diseases, including systemic lupus erythematosus (SLE). However, the molecular mechanisms by which EBV contributes to autoimmunity remain unclear. We used previously undescribed mouse models to study the role of EBV-encoded latent membrane protein 2A (LMP2A), which mimics B-cell receptor signaling. Interestingly, LMP2A not only enhanced B-cell survival but also upregulated the transcription factor zinc finger and bric-a-brac, tramtrack domain-containing protein 20 and promoted plasma cell differentiation. When expressed late in B-cell development, LMP2A also caused prominent features of SLE, including autoantibody production with kidney immune complex deposition. Our findings suggest that LMP2A has important roles in B-cell activation and differentiation and in the development of EBV-associated autoimmune diseases.
Keywords: LMP2A, germinal center, plasma cell differentiation, B cells, autoimmune diseases
Abstract
Epstein–Barr virus (EBV) infects germinal center (GC) B cells and establishes persistent infection in memory B cells. EBV-infected B cells can cause B-cell malignancies in humans with T- or natural killer-cell deficiency. We now find that EBV-encoded latent membrane protein 2A (LMP2A) mimics B-cell antigen receptor (BCR) signaling in murine GC B cells, causing altered humoral immune responses and autoimmune diseases. Investigation of the impact of LMP2A on B-cell differentiation in mice that conditionally express LMP2A in GC B cells or all B-lineage cells found LMP2A expression enhanced not only BCR signals but also plasma cell differentiation in vitro and in vivo. Conditional LMP2A expression in GC B cells resulted in preferential selection of low-affinity antibody-producing B cells despite apparently normal GC formation. GC B-cell–specific LMP2A expression led to systemic lupus erythematosus-like autoimmune phenotypes in an age-dependent manner. Epigenetic profiling of LMP2A B cells found increased H3K27ac and H3K4me1 signals at the zinc finger and bric-a-brac, tramtrack domain-containing protein 20 locus. We conclude that LMP2A reduces the stringency of GC B-cell selection and may contribute to persistent EBV infection and pathogenesis by providing GC B cells with excessive prosurvival effects.
Epstein–Barr virus (EBV) is a B-lymphotropic human herpesvirus associated with a variety of hematopoietic cancers, including endemic Burkitt lymphoma, Hodgkin lymphoma, lymphoproliferative disorders in immune-compromised people, nasopharyngeal carcinoma, and some gastric cancers (1, 2). Nevertheless, EBV establishes lifelong latent infection by adolescence in more than 95% of adults worldwide. EBV efficiently infects resting human B cells in vitro, leading to their activation and proliferation. EBV-infected B cells grow in vitro as immortalized lymphoblastoid cell lines (LCL). LCLs express EBV-encoded proteins including the EBV nuclear antigens (EBNAs) EBNA1, EBNA2, EBNA3A, EBNA3B, EBNA3C, and EBNALP and the latent membrane proteins LMP1, LMP2A, and LMP2B. Of these EBV gene products, EBNA2, EBNALP, EBNA3A, EBNA3C, and LMP1 are essential for B-cell transformation (3), whereas EBNA1 is necessary for EBV episome persistence (4).
LMP2A consists of an N-terminal cytoplasmic domain, 12 membrane-spanning domains, and a short C-terminal cytoplasmic domain. The N-terminal cytoplasmic domain has an immune receptor tyrosine-based activation motif (ITAM), which can recruit the protein tyrosine kinases Syk and Src (5). In LCLs or mouse cells that ectopically express LMP2A, LMP2A suppresses B-cell antigen receptor (BCR) signaling (6–8). In mice lacking BCR expression, transgenic LMP2A can partially rescue B-cell differentiation (9–11), indicating that LMP2A can mimic tonic BCR signals necessary for B-cell survival in vivo (12). Likewise, LMP2A is essential for growth transformation of germinal center (GC)-derived BCR− B cells (13). Depending on its B-cell expression level in murine models, constitutive LMP2A expression alters B-cell development or augments the differentiation and activation of antigen-driven B cells (9, 10, 14–16).
In the peripheral blood of persistently infected people, EBV resides exclusively in IgD− memory B cells (17). However, in tonsils, EBV is found not only in memory B cells but also in GC and IgD+ resting B cells in which EBNA1, LMP1, and LMP2A are expressed (17, 18). Thereby, EBV may use antigen-driven B-cell activation and differentiation in mucosal secondary lymphoid organs, particularly GC reactions, to establish persistent infection in the memory B-cell pool. Together with LMP1, which constitutively activates CD40 signaling (19, 20), LMP2A may provide a survival advantage for EBV-infected B cells by modifying GC B-cell selection. However, B-lineage–specific expression of LMP1 inhibits GC formation (20) or causes B-cell ablation through immune surveillance (21). LMP2A does not affect affinity maturation of B cells in GCs when expressed in B cells of a transgenic mouse line (22). Constitutive expression in transgenic mice used in these previous studies may be inappropriate for studying the influence of infection-induced virus proteins on B-cell differentiation, particularly in GCs. To date, the impact of LMP2A on differentiation and selection of GC B cells is still controversial.
To explore the possibility that LMP2A contributes to persistent EBV infection by modifying GC B-cell selection, we generated an experimental mouse system in which LMP2A is conditionally expressed in GC B cells, similar to LMP2A expression in EBV-infected human B cells. Using this system, we analyzed the effects of LMP2A expression on B-cell entry into and differentiation within GCs.
Results
LMP2A Expression in B Cells Results in B-Cell Hyperactivation and Impaired Humoral Responses.
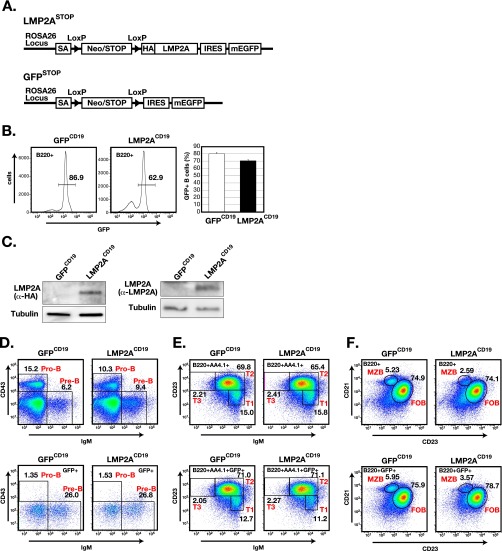
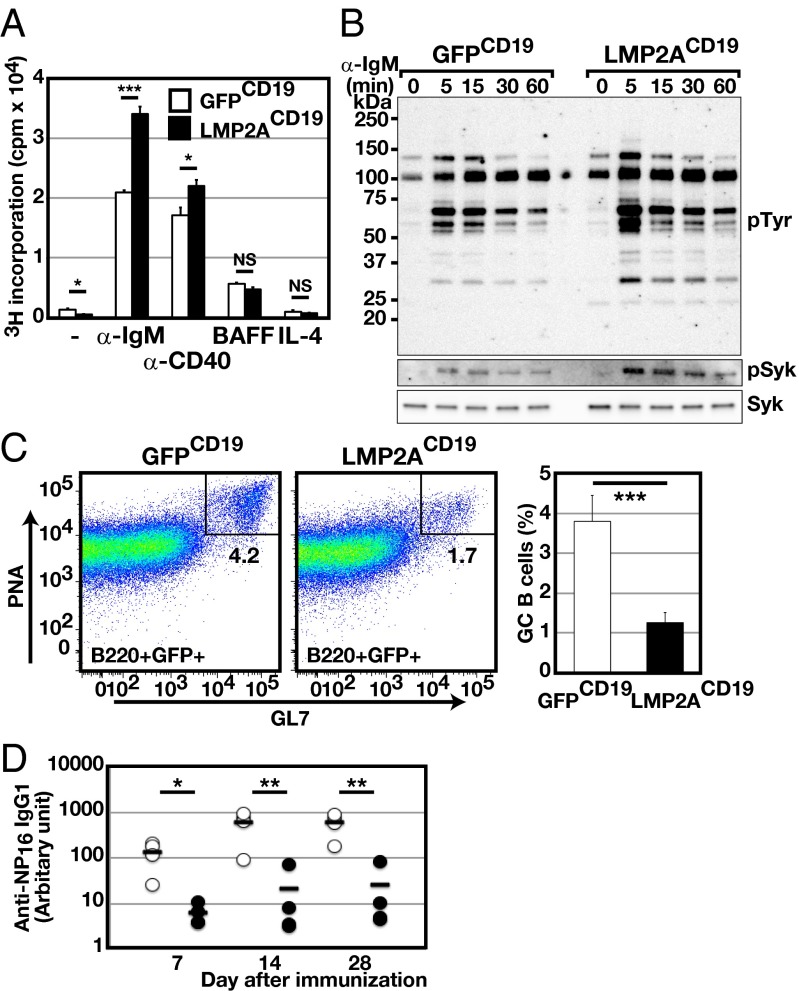
To characterize the effects of LMP2A expression on humoral immune responses, we generated mice in which LMP2A was conditionally expressed in B cells. We produced two knockin mice, LMP2ASTOP mice and control GFPSTOP mice, into whose ROSA26 locus one of two cassettes was inserted (Fig. S1A). LMP2ASTOP mice received a cassette containing floxed neomycin phosphotransferase cDNA (NEO) with a stop codon, N-terminal HA-tagged LMP2A, an internal ribosome entry site sequence (IRES), and monomeric enhanced GFP (mEGFP). GFPSTOP mice received a cassette containing floxed NEO with a stop codon, an IRES, and mEGFP (Fig. S1A). Subsequently, LMP2ASTOP mice and GFPSTOP mice were crossed with CD19-Cre mice to generate mice that express both LMP2A and GFP (LMP2ACD19) or only GFP (GFPCD19) in all B-lineages. Approximately 80% of B-lineage cells expressed GFP in LMP2ACD19 mice and GFPCD19 mice. HA-tagged LMP2A expression in LMP2ACD19 B cells was confirmed also (Fig. S1 B and C). Analysis of proliferative activity revealed that B cells from LMP2ACD19 mice were more responsive to BCR stimulation than B cells in GFPCD19 mice (Fig. 1A), although LMP2A expression did not affect B-cell differentiation (Fig. S1 D–F). Consistent with B-cell responses in LMP2ACD19 mice, tyrosine phosphorylation of proteins, including Syk, was significantly higher in anti-IgM–stimulated LMP2ACD19 B cells despite normal NF-κB activation (Fig. 1B and Fig. S2A), suggesting that LMP2A may affect only some BCR signals.
Fig. S1.
Generation and characterization of LMP2ACD19 and GFPCD19 mice. (A) Schematic gene structures of the LMP2ASTOP and GFPSTOP mice. SA, splice acceptor sequence; Neo/STOP, Neo-STOP cassette sequence composed of neomycin phosphotransferase gene followed by a stop codon; IRES, internal ribosome entry site sequence; mEGFP, the sequence encoding the monomeric EGFP; LoxP, loxP sequence. (B, Left) The frequency of splenic GFP+ B cells (GFP+B220+) of LMP2ACD19 or GFPCD19 mice was analyzed by flow cytometry (n = 4). The numbers indicate the frequencies of cells in the gates. (Right) Columns (open: GFPCD19 mice, closed: LMP2ACD19 mice) indicate mean frequencies. (C) The expression of LMP2A in splenic B cells of LMP2ACD19 mice was analyzed by Western blot using an antibody against HA or LMP2A. Data are representative of three independent experiments. (D–F) Representative flow cytometric analyses of B cells from LMP2ACD19 and GFPCD19 mice. The frequency of pre-B cells (IgM+CD43−) or pro-B cells (IgM−CD43+) in bone marrow (D), transitional 1 (T1) B cells (B220+AA4.1+IgM+CD23lo), T2 B cells (B220+AA4.1+IgM+CD23hi), or T3 B cells (B220+AA4.1+IgM−CD23hi) (E), or marginal zone B (MZB) cells (B220+CD21hiCD23lo) or follicular B (FOB) cells (B220+CD21loCD23hi) (F) in spleen were analyzed by flow cytometry. Lower panels in D–F show the GFP+ population. The numbers indicate the frequencies of cells in the gates. Data are representative of three independent experiments.
Fig. 1.
LMP2A expression in B-lineage cells accelerates B-cell activation but causes impaired humoral responses. (A) Purified B cells from spleens of LMP2ACD19 or GFPCD19 mice were cultured with the indicated stimuli. Cultures were pulsed with 3H-thymidine, and 3H-thymidine incorporation was analyzed. Data are representative of three independent experiments. (B) Purified B cells from spleens of LMP2ACD19 or GFPCD19 mice were stimulated with α-IgM F(ab′)2 for the indicated periods, and the expression of phosphorylated tyrosine (pTyr), phosphorylated Syk (pSyk), and total Syk were analyzed by Western blot. Data are representative of three independent experiments. (C and D) LMP2ACD19 and GFPCD19 mice were immunized i.p. with NP-CGG in alum. (C, Left) Flow cytometric analysis of splenic GC B cells (CD19+GL7hiPNAhi) from LMP2ACD19 or GFPCD19 mice 14 d after immunization (n = 4). The numbers indicate the frequencies of cells in the gates. (Right) Columns (open: GFPCD19; closed: LMP2ACD19) indicate mean frequencies. (D) The serum titers of NP-specific IgG1 were analyzed by ELISA (open circles: GFPCD19; filled circles: LMP2ACD19; n = 4). IgG1 with affinity for NP was captured using NP16-BSA. The bar in each time point indicates the average. Error bars show the means ± SEM. *P < 0.05; **P < 0.01; ***P < 0.001.
Fig. S2.
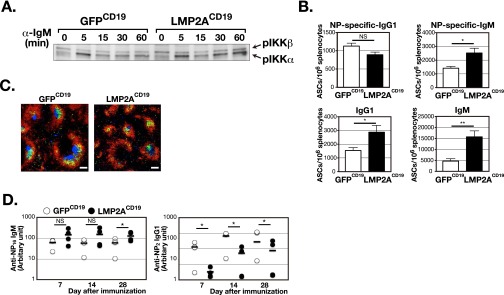
LMP2A expression in B-lineage cells impairs humoral responses. (A) Purified B cells from spleen of LMP2ACD19 or GFPCD19 mice were stimulated with anti-IgM F(ab′)2 for the indicated periods, and the expression levels of phosphorylated IκB kinase α and β (pIKKα and β) were analyzed by Western blot. (B–D) LMP2ACD19 and GFPCD19 mice were immunized i.p. with NP-CGG in alum. (B) The number of NP-specific ASCs or total ASCs in the spleen was analyzed by ELISPOT assay (n = 5). Seven days after immunization, splenocytes were prepared from either LMP2ACD19 or GFPCD19 mice and used for the assay. (C) Immunofluorescence staining of frozen spleen sections from LMP2ACD19 or GFPCD19 mice 14 d after immunization, using anti-GL7 (blue), anti-IgD (red), and anti-CD35 (green) antibodies. (Scale bars, 100 µm.) Data are representative of four independent experiments. (D) The serum titers of NP-specific IgM and IgG1 were analyzed by ELISA (open circles: GFPCD19; filled circles: LMP2ACD19; n = 4). Total IgM with affinity for NP was captured using NP16-BSA, and IgG1 with high affinity for NP was captured using NP2-BSA. The bar in each time period indicates the average. Error bars show the means ± SEM. *P < 0.05; NS, not statistically significant.
To assess the overall effect of LMP2A expression on humoral immune responses, LMP2ACD19 mice and GFPCD19 mice were immunized with (4-hydroxy-3-nitrophenyl) acetyl chicken gamma globulin (NP-CGG). In the initial phase of humoral immune responses, some antigen-committed B cells proliferate and differentiate into low-affinity antibody-secreting plasmablasts in the extrafollicular area, whereas others migrate to the follicle and start to form GCs. An enzyme-linked immunospot (ELISPOT) analysis demonstrated significant increases in number of antibody-secreting cells (ASCs), particularly IgM+ cells in spleens of LMP2ACD19 mice 1 wk after immunization (Fig. S2B), indicating that LMP2A promotes extrafollicular B-cell differentiation into plasma cells. Immunohistochemical analysis of spleen sections revealed defective GC formation in LMP2ACD19 mice (Fig. S2C) and fewer GL7+ and peanut agglutinin (PNA)-binding GC B cells in LMP2ACD19 mice than in GFPCD19 mice 2 wk after immunization. (Fig. 1C). Antigen-specific IgG1 antibody responses also were severely impaired in LMP2ACD19 mice, although IgM responses in these mice were either unaffected or augmented (Fig. 1D and Fig. S2D). These data indicate that constitutive LMP2A expression enhances the differentiation of antigen-committed B cells into ASCs but suppresses either GC B-cell expansion or entry into GCs.
LMP2A Expression in GC B Cells Results in Decreased Antigen-Specific B Cells Without Decreased GC Formation.
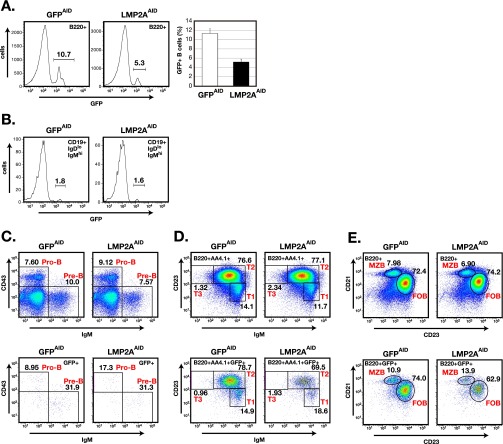
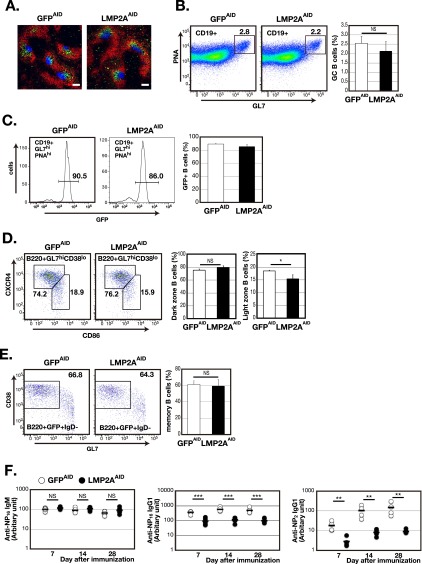
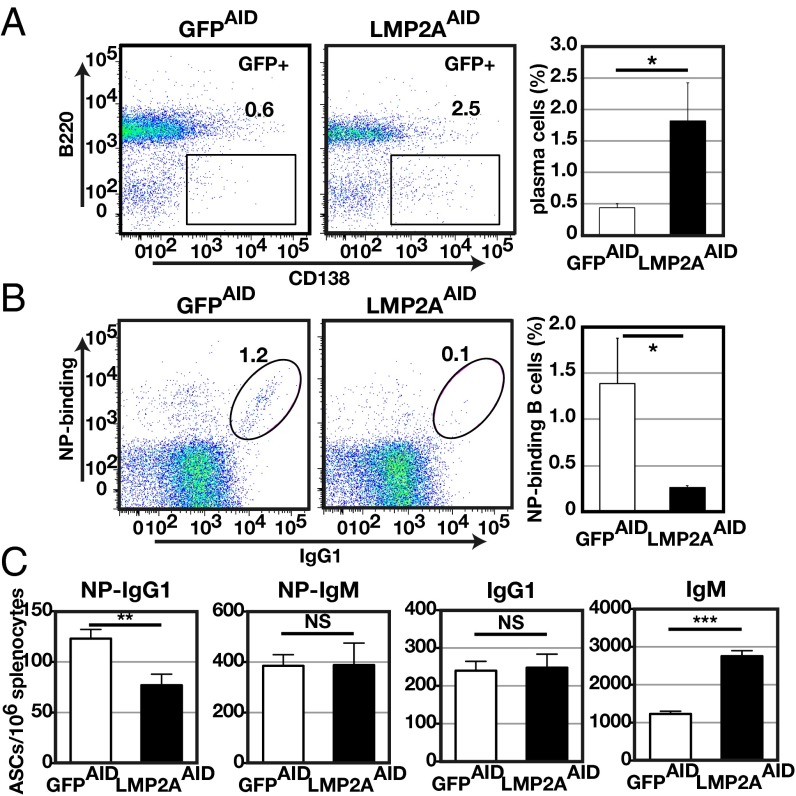
To determine more precisely how LMP2A expression affects GC B-cell differentiation, LMP2ASTOP mice and GFPSTOP mice were crossed with Aicda-Cre mice (23). The Aicda locus, which encodes the enzyme activation-induced cytidine deaminase (AID), is activated selectively in GC B cells (24). The resulting strains express LMP2A and GFP (LMP2AAID mice) or only GFP (GFPAID mice) upon activation of the Aicda locus. In these mice, most B cells were GFP−, although some splenic B cells were GFP+ (Fig. S3A). These GFP+ B cells acquired LMP2A and GFP coexpression as a consequence of differentiation in the bone marrow, where a fraction of immature B cells express AID (25). Small numbers of GFP+ cells were observed in immature bone marrow B cells (Fig. S3B). There was little or no difference in the surface phenotype of GFP+ and GFP− splenic B cells of unimmunized LMP2AAID mice (Fig. S3 C–E), suggesting that inducible LMP2A expression did not affect B-cell development in LMP2AAID mice. When immunized with NP-CGG, LMP2AAID mice, unlike LMP2ACD19 mice, formed GCs morphologically indistinguishable from those of GFPAID mice (Figs. S2C and S4A). Flow cytometry analysis revealed that GC B cell frequencies were comparable in LMP2AAID mice and GFPAID mice (Fig. S4B). As expected, in both groups of mice more than 85% of GC B cells expressed GFP (Fig. S4C). The only difference detected between these two groups of mice was a slightly but significantly lower frequency of light-zone GC B cells in LMP2AAID mice than in GFPAID mice (Fig. S4D). Following positive selection by follicular dendritic cell (FDC)-presented antigen, light-zone GC B cells either reenter the dark zone for further cell division or leave the GC to differentiate into plasma cells or memory B cells (26). To determine the effects of LMP2A expression on post-GC B-cell function, we characterized memory B cells and plasma cells following immunization. The frequency of GFP+, B220−, and CD138+ splenic plasma cells was significantly higher in LMP2AAID mice than in GFPAID mice (Fig. 2A), although there was no difference in GFP+, B220+, IgD−, GL7lo, and CD38+ splenic memory B cells between the two groups (Fig. S4E).
Fig. S3.
Characterization of LMP2AAID and GFPAID mice. (A, Left) The frequencies of splenic GFP+ B cells (GFP+B220+) of LMP2AAID and GFPAID mice were analyzed by flow cytometry (n = 4). The numbers indicate the frequencies of cells in the gates. (Right) Columns (open: GFPAID mice; closed: LMP2AAID mice) indicate mean of frequencies. (B–E) Representative flow cytometric analyses of B cells from LMP2AAID and GFPAID mice. The frequencies of GFP+ immature B cells (CD19+IgDloIgMhiGFP+) (B) or pre-B cells (IgM+CD43−) or pro-B cells (IgM−CD43+) (C) in bone marrow, transitional 1 (T1) B cells (B220+AA4.1+IgM+CD23lo), T2 B cells (B220+AA4.1+IgM+CD23hi), or T3 B cells (B220+AA4.1+IgM−CD23hi) (D), and marginal zone B (MZB) cells (B220+CD21hiCD23lo) or follicular B (FOB) cells (B220+CD21loCD23hi) (E) in spleen were analyzed by flow cytometry. Lower panels in C–E show the GFP+ population. The numbers indicate the frequencies of cells in the gates. Data are representative of three independent experiments.
Fig. S4.
LMP2A expression in GC B cells does not affect GC formation. (A) Immunofluorescence staining of frozen spleen sections from LMP2AAID or GFPAID mice 14 d after immunization, using anti-GL7 (blue), anti-IgD (red), and anti-CD35 (green) antibodies. (Scale bars, 100 µm.) Data are representative of four independent experiments. (B–E, Left) Flow cytometric analysis of GC B cells (CD19+GL7hiPNAhi) (B), GFP+ GC B cells (CD19+GL7hiPNAhiGFP+) (C), dark-zone B cells (B220+GL7hiCD38loCXCR4+CD86−), light-zone B cells (B220+GL7hiCD38loCXCR4−CD86+) (D), or memory B cells (B220+GFP+CD38hiIgD−GL7lo) (E) in the spleen, 14 d after immunization (n = 4). The numbers indicate frequencies of cells in the gates. (Right) Columns (open: GFPAID; closed: LMP2AAID) indicate mean frequencies. (F) The serum titers of NP-specific IgM and IgG1 were analyzed by ELISA (open circles: GFPAID; filled circles: LMP2AAID; n = 4). Total IgM and IgG1 with affinity for NP were captured using NP16-BSA, and IgG1 with high affinity for NP was captured with NP2-BSA. The bar in each time point indicates the average. Error bars show the means ± SEM. *P < 0.05; **P < 0.01; ***P < 0.001; NS, not statistically significant.
Fig. 2.
LMP2A expression in GC B cells reduces the generation of antigen-specific B cells. LMP2AAID and GFPAID mice were immunized i.p. with NP-CGG in alum. (A and B, Left) Flow cytometric analysis of plasma cells (GFP+B220−CD138+) (A) or NP-binding+ B cells (CD4−CD8−CD11b−CD3ε−Gr-1−IgM−IgD−IgG1+GFP+CD19+NP-binding+) (B) in the spleen 14 d after immunization (n = 4). The numbers indicate frequencies of cells in the gates. (A and B, Right) Columns (open: GFPAID, closed: LMP2AAID) indicate mean frequencies. (C) The number of NP-specific IgG1+ (NP-IgG1) and IgM+ (NP-IgM) ASCs or total ASCs in the spleen was analyzed by ELISPOT assay (n = 5). Sixteen days after immunization, splenocytes were prepared from either LMP2AAID or GFPAID mice and used for the assay. Error bars show the means ± SEM. *P < 0.05; **P < 0.01; ***P < 0.001; NS, not statistically significant.
Frequencies of Antigen-Specific B Cells and Serum Levels of Antigen-Specific Antibodies in LMP2AAID and GFPAID Mice.
Despite morphologically normal GC formation and elevated plasma cells, the frequency of NP-binding B cells was significantly reduced in GCs of LMP2AAID mice (Fig. 2B). Serum levels of NP-specific IgG1, particularly, high-affinity IgG1, also were significantly lower in LMP2AAID mice than in GFPAID mice, although the serum level of NP-specific IgM in LMP2AAID mice was comparable to that in GFPAID mice (Fig. S4F). ELISPOT assays revealed that frequencies of NP-specific IgG1-secreting cells were significantly reduced in LMP2AAID mice 16 d after immunization, although the numbers of total IgM-secreting cells were elevated (Fig. 2C). These results indicate that Aicda-Cre–dependent expression of LMP2A strongly inhibits antigen-specific antibody responses but not GC formation, while enhancing plasma cell differentiation.
B Cells of LMP2AAID and WT Mice Have Comparable Ability to Expand in GCs.
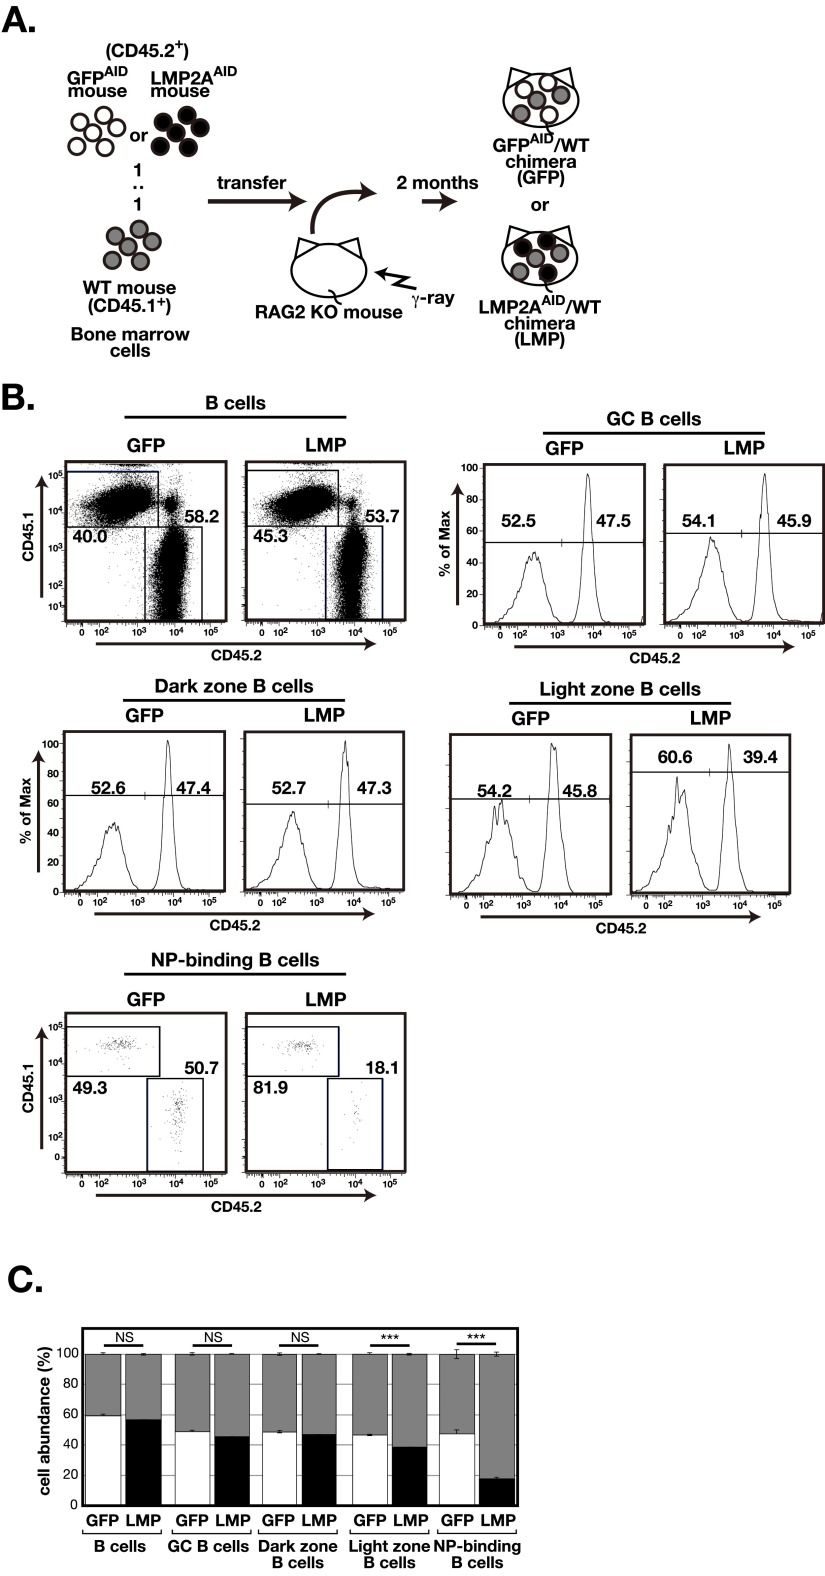
To compare the ability of LMP2A-expressing and normal B cells to expand and differentiate in GCs under more competitive conditions, equal numbers of bone marrow cells from LMP2AAID mice, GFPAID mice (CD45.2+), and WT mice (CD45.1+) were cotransferred into irradiated recombination activating gene 2 (Rag2)-knockout mice to generate LMP2AAID/WT or GFPAID/WT chimeric mice (Fig. S5A). The resulting bone marrow chimeric mice were immunized with NP-CGG and then were analyzed for GC formation 2 wk after immunization. Almost equal numbers of LMP2AAID-derived and WT-derived GC B cells were detected in immunized LMP2AAID/WT chimeras (Fig. S5 B and C). The frequencies of LMP2AAID-derived light-zone GC B cells were slightly but significantly reduced in LMP2AAID/WT chimeras, as in LMP2AAID mice (Figs. S4D and S5 B and C). The frequencies of LMP2AAID-derived cells were significantly lower than those of WT cells among NP-binding B cells in LMP2AAID/WT chimeras (Fig. S5 B and C). These findings suggest that LMP2AAID-derived B cells and WT B cells do not differ in their ability to expand in GCs. However, LMP2A-expressing B cells were less reactive to antigens.
Fig. S5.
The ability of LMP2A-expressing B cells to expand in GCs is comparable to that of WT B cells. (A) A schematic protocol for bone marrow transfer to generate mixed bone marrow chimeric mice. Bone marrow cells from LMP2AAID or GFPAID mice (CD45.2+) and WT mice (CD45.1+) (1:1) were cotransferred into Rag2−/− mice. (B) Flow cytometric analysis of CD45.1+ or CD45.2+ B cells (CD19+), GC B cells (B220+GL7hiCD38lo), dark-zone B cells (B220+GL7hiCD38loCXCR4+CD86−), light-zone B cells (B220+GL7hiCD38loCXCR4−CD86+), or NP-binding B cells (CD4−CD8−CD11b−CD3e−Gr-1−IgM−IgD−IgG1+GFP+CD19+NP-binding+) in spleen 14 d after immunization with NP-CGG in alum (n = 3). The numbers indicate the frequencies of CD45.1+ or CD45.2+ cells in the gates. GFP: GFPAID/WT chimeras; LMP: LMP2AAID/WT chimeras. (C) Columns (gray: CD45.1+; open: CD45.2+ in GFPAID/WT chimeras; closed: CD45.2+ in LMP2AAID/WT chimeras) indicate the ratio of CD45.1+ or CD45.2+ cells in each cell types. GFP: GFPAID/WT chimeras; LMP: LMP2AAID/WT chimeras. Error bars show the means ± SEM. ***P < 0.001; NS, not statistically significant.
LMP2A Expression in GC B Cells Suppresses the Selection of High-Affinity B Cells Expressing the VH186.2 Gene Segment.
To investigate LMP2A effects on the selection of high-affinity antibody-producing B cells in GCs, single NP-binding B cells from spleens of immunized LMP2AAID mice or GFPAID mice were sorted by FACS. The Ig heavy-chain VH186.2 genes, which are preferentially used by high-affinity NP-specific B cells in C57BL/6 mice, were amplified by RT-PCR, and then PCR direct sequencing was performed (27–30). As shown in Table S1, the use of the VH186.2 gene segment in NP-binding B cells was more than 2.5-fold lower in LMP2AAID mice than in GFPAID mice. However, the replacement mutation/silent mutation (R/S) ratio of complementarity-determining regions (CDR) 1 and 2, the frequency of DFL16.1 use, the frequency of YYGS sequence insertion in CDR3, and the frequency of W-to-L mutation in CDR1 in VH186.2+ B cells was not affected by the expression of LMP2A in GC B cells. Thus, it appears that LMP2A expression severely impairs selection of high-affinity B cells expressing the VH186.2 gene but not somatic hypermutation in GCs.
Table S1.
Somatic genetics at the Ig locus of NP-binding B cells
| GFPAID (n) | LMP2AAID (n) | |
| VH186.2 usage* | 44.8 (96) | 16.7 (96) |
| R/S ratio† | ||
| CDR1+CDR2 | 7.6 (43) | 7.2 (16) |
| Framework | 2.3 (43) | 2.9 (16) |
| DFL16.1 use (%)‡ | 69.8 (43) | 82.4 (16) |
| YYGS (%)§ | 44.2 (43) | 37.5 (16) |
| W-to-L 33 (%)¶ | 62.8 (43) | 68.8 (16) |
The percentage of the cells with rearranged VH186.2 gene.
The mean value of R/S ratio in VH186.2 gene.
The percentage of the cells with rearranged DFL16.1 gene segment coupled to VH186.2 gene.
The percentage of the cells with rearranged YYGS in CDR3 coupled to rearranged VH186.2 gene.
The percentage of the cells with rearrange VH186.2 gene carrying the W-to-L mutation at position 33.
LMP2A Expression Enhances Differentiation of B Cells into ASCs.
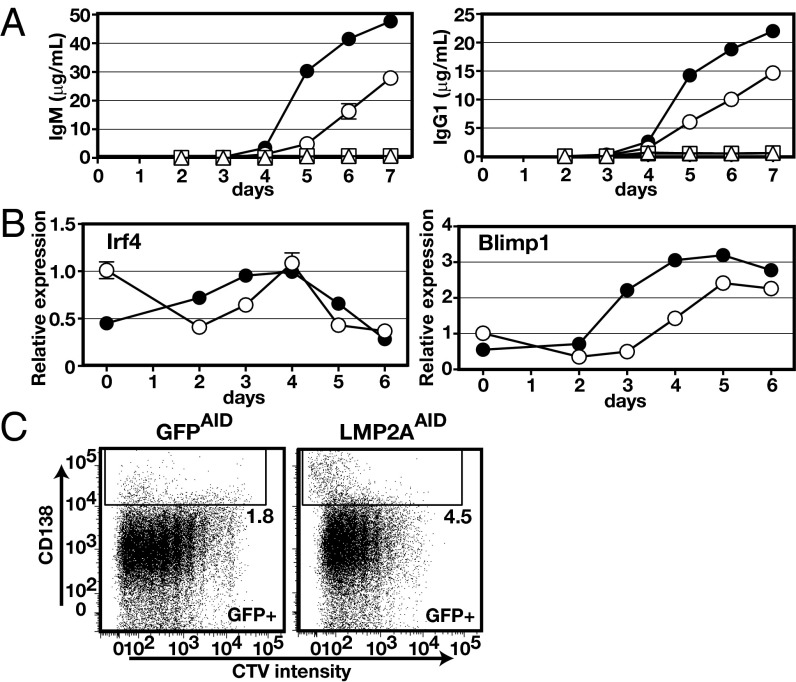
The increased numbers of ASCs, particularly IgM-secreting cells, suggested that LMP2A may affect the differentiation of B cells into plasma cells or affect Ig isotype class-switching. To test this possibility, B cells isolated from LMP2ACD19 mice were cultured in the presence of IL-4, IL-5, and soluble CD40 ligand (sCD40L). Both IgM and IgG production were more rapidly inducible in LMP2ACD19 B cells than in GFPCD19 B cells (Fig. 3A). Furthermore, significantly higher levels of interferon regulatory factor 4 (Irf4) and B lymphocyte-induced maturation protein 1 (Blimp1) mRNAs, which encode key transcription factors involved in plasma cell differentiation, were induced in LMP2ACD19 B cells before Ig secretion. Nonetheless, Irf4 and Blimp1 mRNAs levels were lower in LMP2ACD19 B cells than in control B cells before stimulation (Fig. 3B). CD138 staining, in combination with a dye-dilution assay, also revealed a higher frequency of CD138+ cells in LMP2AAID B cells after several cell divisions (Fig. 3C). These in vitro findings suggest that LMP2A accelerates the differentiation of B cells into antibody-forming cells, which may explain the increased numbers of plasma cells and ASCs in spleens of immunized LMP2AAID mice.
Fig. 3.
LMP2A expression enhances B-cell differentiation into ASCs. (A) Purified splenic B cells from LMP2ACD19 or GFPCD19 mice were cultured for 7 d with the indicated stimuli (triangle: unstimulated; square: IL-4 and IL-5; circle: IL-4, IL-5, and sCD40L), and the cultured supernatants were analyzed by ELISA (open symbols: GFPCD19; filled symbols: LMP2ACD19; n = 3). Error bars show the means ± SEM. Data are representative of three independent experiments. (B) Expression of the indicated genes was analyzed by RT-qPCR. Purified splenic B cells from either LMP2ACD19 or GFPCD19 mice were cultured with anti-CD40 antibody and IL-4 for the indicated times (open circles: GFPCD19, filled circles: LMP2ACD19; n = 3). Error bars show the means ± SEM. (C) Purified splenic B cells from either LMP2AAID or GFPAID mice were labeled with CellTrace Violet (CTV) and cultured with anti-CD40 antibody and IL-4 for 4 d. Then CD138 expression was analyzed by flow cytometry. The numbers indicate the frequencies of GFP+CD138+ cells in the gates. Data are representative of three independent experiments.
LMP2A Expression in GC B Cells Leads to Autoantibody Production and Development of Glomerulonephritis.
It has been suggested that impaired affinity maturation in GCs may lead to autoantibody production (31). EBV titers have been reported to correlate with disease activity in patients with systemic lupus erythematosus (32–36), suggesting a possible involvement of EBV infection in autoantibody production. Indeed, we detected anti-dsDNA antibodies only in sera of LMP2AAID mice (Fig. 4A). Anti-cardiolipin antibodies also were detected in sera of LMP2AAID mice and, to a lesser extent, in sera of LMP2ACD19 mice (Fig. 4B). Staining of kidney sections from either 6-mo-old unimmunized LMP2AAID mice or GFPAID mice with H&E or anti-IgG and IgM revealed subendothelial deposition of antibodies and development of glomerulonephritis-like lesions in LMP2AAID mice (Fig. 4C).
Fig. 4.
LMP2AAID mice develop a lupus-like autoimmune phenotype. (A and B) The serum titers of anti-dsDNA (A) or anti-cardiolipin (B) antibody in 8- to 20-wk-old mice were measured by ELISA. (Left) open circles: GFPAID; filled circles: LMP2AAID; (Right) open circles: GFPCD19, filled circles: LMP2ACD19. n = 6–8. Error bars show the means ± SEM. **P < 0.01; ***P < 0.001; NS; not statistically significant. (C) Paraffin-embedded kidney sections from 6-mo-old LMP2AAID or GFPAID mice were stained with H&E (Left) or anti-IgG/IgM (Right). (Scale bars, 50 µm.) Data are representative of three independent experiments.
LMP2A Expression Induced Epigenetic Changes in B Cells That Correlate with Plasma Cell Differentiation.
To investigate the effects of LMP2A expression on the B-cell epigenetic landscape, histone 3 lysine 4 monomethylation (H3K4me1) enhancer marks, histone 3 lysine 4 trimethylation (H3K4me3) promoter marks, and histone 3 lysine 27 acetylation (H3K27ac) active promoter or enhancer marks were analyzed. ChIP sequencing (ChIP-seq) analysis was done on biological replicate samples of splenic B220+ B cells from LMP2ACD19 mice and GFPCD19 mice. ChIP-seq reads were first mapped to the mouse genome mm9. Model-based analysis for ChIP-seq (MACS) identified 37,150 significant H3K27ac peaks in GFPCD19 B cells and 37,497 significant H3K27ac peaks in LMP2ACD19 B cells. Altogether, 58,342 significant H3K4me1 peaks in GFPCD19 B cells and 55,293 significant H3K4me1 peaks in LMP2ACD19 B cells were identified, along with 27,881 significant H3K4me3 peaks in GFPCD19 B cells and 26,481 significant H3K4me3 peaks in LMP2ACD19 B cells.
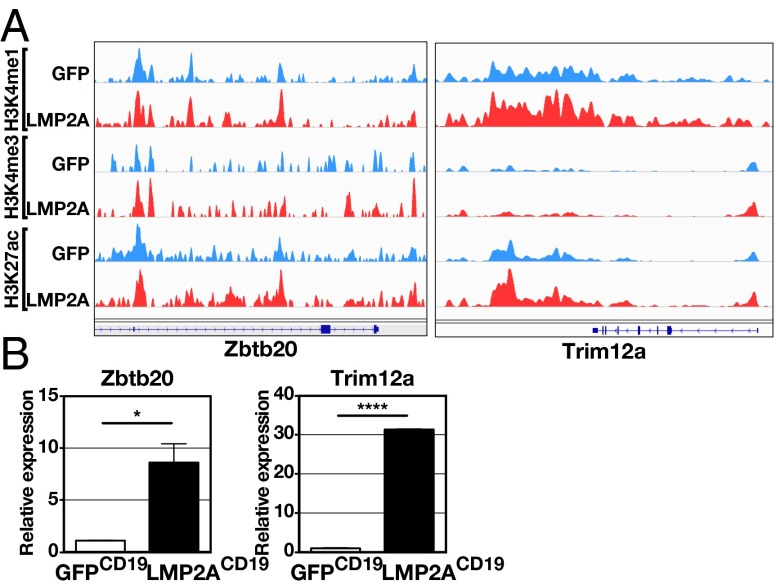
Unexpectedly, LMP2A expression in B cells resulted in increased H3K4me1 and H3K27ac signals by ≥1.5-fold at only a small number of gene loci, including zinc finger and bric-a-brac, tramtrack (BTB) domain containing protein 20 (Zbtb20) and tripartite motif-containing 12A (Trim12a) (Fig. 5A and Table S2). Consistent with this result, quantitative PCR (qPCR) showed significantly increased Zbtb20 and Trim12a transcript levels in LMP2ACD19 B cells (P = 0.01 and P < 0.0001, respectively) (Fig. 5B). Zbtb20 encodes a zinc finger protein that has been shown to be important for B-cell differentiation into ASCs and for plasma cell longevity (37, 38). Therefore, the induction of Zbtb20 expression by LMP2A in B cells may at contribute, at least in part, to the observed LMP2A effects on B-cell differentiation into antibody-secreting plasma cells.
Fig. 5.
LMP2A-mediated epigenetic and transcription effects on Zbtb20 and Trim12a. (A) H3K4me1, H3K4me3, and H3K27ac ChIP-seq signals at the Zbtb20 (Left) and Trim12a (Right) enhancers from LMP2ACD19 and GFP CD19 B cells are shown. (B) Expression of Zbtb20 and Trim12a genes in LMP2ACD19 and GFPCD19 B cells was evaluated by RT-qPCR. Error bars show the means ± SEM. *P < 0.05; ****P < 0.0001.
Table S2.
Genes associated with LMP2A-activated sites (LMP2ACD19/GFPCD19 ≥ 1.5-fold) based on histone mark ChIP-seq signals
| Histone mark | Associated gene | Fold change (LMP2A/GFP) |
| H3K4me1 | Clasp2 | 1.63 |
| Trim12a | 1.62 | |
| Zbtb20 | 1.54 | |
| H3K4me3 | Upb1 | 1.76 |
| Rgs3 | 1.60 | |
| H3K27ac | Odz4 | 1.98 |
| Trim12a | 1.65 | |
| Clasp2 | 1.52 | |
| Zbtb20 | 1.51 |
Pathways Affected by LMP2A-Induced Epigenetic Changes.
In contrast to the limited number of sites that were positively affected by LMP2A, we observed a generally repressive role of LMP2A on global histone modifications. Most sites that differed between LMP2ACD19 B cells and GFPCD19 B cells were repressed in LMP2ACD19 B cells, with ≥1.5-fold decreased H3K27ac ChIP-seq signal at more than 300 sites. The top 300 loci that differed in H3K27ac, H3k4me1, or H3K4me3 signals between LMP2ACD19 B cells and GFPCD19 B cells were analyzed further for pathway enrichment. H3K27ac, H3K4me1, and H3K4me3 sites affected by LMP2A expression were linked to their nearest genes. IntPath analysis (39) of genes with decreased H3K27ac signal found enrichment for the TNFα/NF-κB pathway. Genes with decreased H3K4me1 signal were enriched for B-cell receptor signaling pathway and apoptosis (Table S3).
Table S3.
IntPath pathway analysis of genes associated with top 300 LMP2A-repressed sites (GFPCD19/LMP2ACD19 ≥ 1.5-fold) based on histone mark ChIP-seq signals
| Histone mark | Associated pathway | P value |
| H3K4me1 | Glycosaminoglycan biosynthesis - chondroitin sulfate | 0.006109 |
| p53 signaling pathway | 0.006682 | |
| Apoptosis | 0.008195 | |
| ES cell pluripotency pathways | 0.014606 | |
| NLR proteins | 0.017381 | |
| Pathways in cancer | 0.024661 | |
| Adipogenesis | 0.028524 | |
| Wnt signaling pathway and pluripotency | 0.028527 | |
| Toll-like receptor signaling pathway | 0.030697 | |
| Biotin metabolism | 0.034783 | |
| Intestinal immune network for IgA production | 0.037504 | |
| Glycan biosynthesis | 0.037854 | |
| B-cell receptor signaling | 0.043578 | |
| TGF-β receptor signaling pathway | 0.047006 | |
| H3K4me3 | Formaldehyde oxidation | 0.008229 |
| Pentose phosphate | 0.012 | |
| Protein processing in endoplasmic reticulum | 0.028723 | |
| Biotin metabolism | 0.036036 | |
| Pyridoxal 5′-phosphate salvage pathway | 0.036036 | |
| H3K27ac | Pyridoxal 5′-phosphate salvage pathway | 0.000317 |
| TNF-α NF-κB signaling pathway | 0.001924 | |
| Vitamin B6 metabolism | 0.006169 | |
| Vasopressin-regulated water reabsorption | 0.006324 | |
| Toll-like receptor signaling | 0.020474 | |
| Interleukin signaling pathway | 0.020788 | |
| Prostate cancer | 0.020813 | |
| Phosphatidylethanolamine biosynthesis | 0.021371 | |
| Kennedy pathway | 0.024978 | |
| Pyrimidine ribonucleotides de novo biosynthesis | 0.02844 | |
| Pyrimidine metabolism | 0.029214 | |
| Aminoacyl-tRNA biosynthesis | 0.036095 | |
| Integrin-mediated cell adhesion | 0.036235 | |
| Glyoxylate and dicarboxylate metabolism | 0.03643 | |
| Proteasome | 0.037004 | |
| Hypertrophy model | 0.048478 |
NLR, nucleotide-binding domain and leucine-rich repeat containing.
Discussion
In this study, we analyzed the effects of conditional expression of LMP2A on B-cell functions and humoral immune responses. LMP2A constitutively activates Syk in vitro and transduces BCR-like signals in vitro and in vivo (5, 10, 11). Indeed, in B cells derived from LMP2ACD19 mice, LMP2A enhanced Syk tyrosine phosphorylation and B-cell proliferation in response to BCR stimulation, further supporting the existence of crosstalk between LMP2A and BCR signals. Moreover, B cells from both LMP2ACD19 and LMP2AAID mice displayed significantly accelerated in vitro differentiation into ASCs when stimulated with anti-CD40 antibody or sCD40L in combination with IL-4. These results are consistent with the reports that LMP2A expression facilitates plasma cell differentiation in vitro and in vivo in response to CD40 stimulation or Toll-like receptor agonists (40, 41). These findings strongly suggest that LMP2A affects BCR signals as well as CD40 signals.
The expression of LMP2A resulted in the impairment of antigen-specific antibody responses without affecting GC formation in immunized LMP2AAID mice. Defective humoral immune responses appeared to be a consequence of the preferential selection of low-affinity B cells but not high-affinity B cells, as underscored by the reduced use of the VH186.2 gene segment by NP-binding GC B cells of LMP2AAID mice. Bone marrow chimera experiments revealed that LMP2AAID-derived B cells had the ability to expand and survive in GCs and that this ability was comparable to that of normal B cells, even though they expressed mostly low-affinity BCR. This selection and survival advantage of LMP2AAID-derived low-affinity B cells could be attributed to LMP2A-mediated enhancement of BCR signals. It also is noteworthy that increased numbers of plasma cells and IgM-secreting cells, detected by flow cytometry and ELISPOT, respectively, were observed in LMP2AAID mice 2 wk after immunization, whereas the frequencies of antigen-specific cells in total IgM- and IgG1-secreting cells were decreased compared with those of immunized control mice. This finding is consistent with LMP2A-mediated enhancement of in vitro plasma cell differentiation and suggests that LMP2A may accelerate the differentiation of GC B cells into plasma cells, even before affinities of antibodies mature sufficiently, leading to the reduction in high-affinity antibody-producing B cells in LMP2AAID mice.
Numbers of ASCs were significantly higher in LMP2ACD19 mice than in GFPCD19 mice 1 wk after immunization, and LMP2A expression suppressed subsequent GC formation. These observations suggest that LMP2A expression from an early stage of B-cell development may skew the fate of B-cell development. In this context, LMP2A may shift early B-cell–lineage cells from being antigen-committed in the initial phase of the immune response (42) toward extrafollicular plasma cell differentiation. Interestingly, in the acute phase of infectious mononucleosis (IM), 70–80% of circulating EBV-infected B cells differentiate toward plasmacytoid cells (43). Also of note, in patients with IM, EBV-infected B cells are preferentially located in the extrafollicular area of lymphoid tissues, and some exhibit a plasmacytoid phenotype and express the replication-associated protein BZLF (44). Our results suggest that LMP2A may have important roles in establishing these B-cell phenotypes.
Although LMP2A expression had limited effect on the epigenetic landscape, we observed robust up-regulation of Irf4 and Zbtb20 expression in LMP2A-expressing B cells. Zbtb20 was up-regulated at the mRNA level by approximately eightfold. Interestingly, IRF4 binds to the Zbtb20 promoter and up-regulates Zbtb20 expression (37, 38). Thus, LMP2A- and IRF4-mediated up-regulation of Zbtb20 may be an important mechanism by which EBV promotes plasma cell survival. Recent studies revealed that Zbtb20, which is a Bcl6 homolog and a member of the broad complex BTB zinc finger family, is a transcriptional repressor that has critical roles in plasma cell differentiation and survival (37, 45). Zbtb20 is physiologically expressed in B1 and GC B cells, with highest expression in long-lived bone marrow ASCs (37). Zbtb20 enhances primary B-cell terminal differentiation into ASCs and enhances plasma cell survival in a B-cell–intrinsic manner (45). Interestingly, MCL1 levels are reduced in Zbtb20-deficient plasma cells relative to WT controls, suggesting a key Zbtb20 antiapoptotic role. Taken together, our findings suggest that LMP2A may be an important viral factor that enhances plasmacytoid differentiation of EBV-infected B cells, which can trigger the viral replication program.
LMP2A robustly induced Trim12a expression in B cells. TRIM12a is a member of the tripartite motif family, which contains RING, B-box, and coiled coil domains. Although Trim12a function remains largely uncharacterized, it is notable that Trim12 was previously implicated as a candidate gene in defective T-cell–negative selection in the nonobese diabetic (NOD) mouse strain (46). TRIM12 expression was reduced by ∼300-fold in NOD thymocytes relative to controls. A major objective of future research will be to characterize further how TRIM12a may underlie LMP2A effects on B-cell development.
Despite these effects on Zbtb20 and Trim12a, most LMP2A effects on the B-cell epigenetic landscape suggested that LMP2a represses many B-cell loci. Consistent with this observation, LMP2A coexpression reversed LMP1-induced B-cell hyperactivation phenotypes in a murine model (22). Pathways suppressed by LMP2A expression included apoptosis, Toll-like receptor signaling, B-cell receptor signaling, and the TNFα/NF-κB pathway (Table S3). Does LMP2A activate signaling molecules downstream of BCR signals? We also performed microarray analysis to determine the change in gene expression by LMP2A in B cells. We found marked similarities in the gene-expression profiles of LMP2A- and BCR-activated B cells (Fig. S6) (47). However, quantitative analysis of these gene expressions will be required to confirm these possibilities.
Fig. S6.
The change in gene expression caused by LMP2A expression correlates with that caused by BCR stimulation in B cells. Genes differentially expressed in splenic B220+ LMP2ACD19 B cells and GFPCD19 B cells (LMP2A) were compared with those in mb-1Cre/TAK1+/+ B cells stimulated for 24 h with 10 µg/mL anti-IgM and unstimulated B cells (α-IgM) (47) using NextBio analysis. (A) Venn diagram shows the number of common and unique genes in both sets. (B) The significance of overlap between gene subsets. The scale of the bar is measured in −log(P value), so the taller the bar, the higher the significance of the gene overlap. The accession number for the public data used for the graphs is GSE41176.
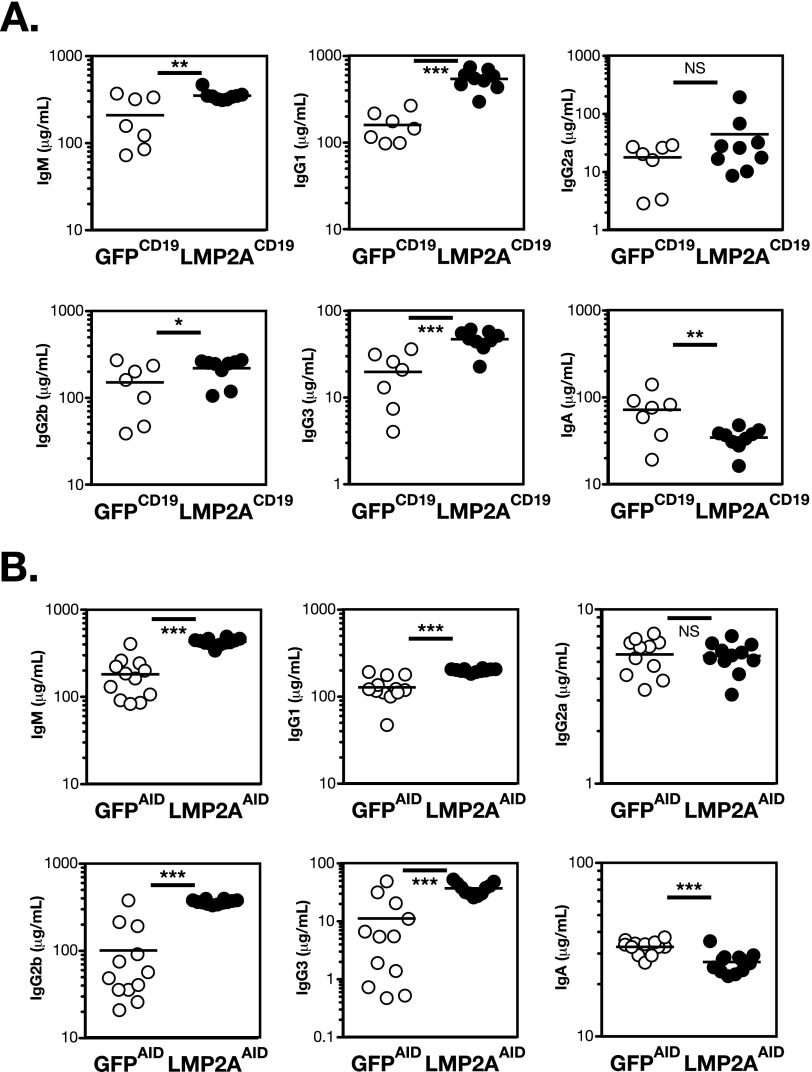
LMP2AAID mice produced autoantibodies against dsDNA and cardiolipin and had detectable immune complex deposition in the kidney; LMP2ACD19 mice also produced anti-cardiolipin antibodies. EBV titers correlate with systemic lupus erythematosus disease activity in some patients (32–36). Both LMP2ACD19 and LMP2AAID mice exhibited hyperimmunoglobulinemia (Fig. S7), which often is associated with autoantibody production in murine autoimmunity models (31, 48). Likewise, autoantibody production often is observed in IM patients (49, 50). We speculate that LMP2A may have an important role in the generation of self-reactive B cells by enabling EBV-infected B cells to bypass GC selection. Interestingly, EBV-infected memory B cells obtained from IM patients express lower levels of self-reactive antibodies than EBV-uninfected memory cells (51). Therefore, additional mechanisms may shape the repertoire of EBV-infected memory B cells, and LMP2A-mediated changes in GC B-cell selection may be particularly important for the generation of low-affinity antibody-producing plasma cells.
Fig. S7.
Both LMP2ACD19 and LMP2AAID mice exhibit hyperimmunoglobulinemia. Serum Ig titers of LMP2ACD19 or GFPCD19 mice (A) or LMP2AAID or GFPAID mice (B) were measured by ELISA [open circles: GFPCD19 (A) or GFPAID (B); filled circles: LMP2ACD19 (A) or LMP2AAID (B)]. n = 6–8. The bar in each graph indicates the average. *P < 0.05; **P < 0.01; ***P < 0.001; NS, not statistically significant.
In summary, conditional LMP2A expression in mice reduced the stringency of B-cell selection in GCs and resulted in preferential generation of low-affinity antibody-producing cells, possibly by augmenting BCR signals. These data strongly support the hypothesis that LMP2A contributes to persistent EBV infection in memory B cells by providing a survival advantage to EBV-infected GC B cells. In addition, LMP2A accelerated plasma cell differentiation in vitro and in vivo through enhanced Zbtb20 expression. These findings provide insights into the mechanism of persistent EBV infection in lymphoid tissues.
Materials and Methods
To generate LMP2ASTOP mice, the targeting vector used to insert the HA-tagged LMP2A gene cassette into the ROSA26 locus was introduced into BALB/c ES cells. The mutant ES cells were microinjected into C57BL/6 mice, and heterozygous offspring were intercrossed into C57BL/6 mice. Mice were maintained in pathogen-free animal facilities at the Research Institute for Microbial Diseases, Osaka University, and were immunized i.p. with 100 µg NP-CGG (Biosearch Technologies) in alum following the guidelines of Osaka University for animal studies. This study was approved by the Osaka University Institutional Animal Care and Use Committee. Western blotting, ELISA, and ELISPOT assays were performed following standard or published protocols. ChIP-seq assay and data analysis were performed as previously described (52). For more details, see SI Materials and Methods.
SI Materials and Methods
Mice.
C57BL/6 mice were purchased from CREA Japan, Inc. CD19-Cre mice were provided by Junji Takeda, Osaka University, Osaka, and Aicda-Cre mice were provided by Meinrad Busslinger, Vienna Biocenter, Vienna. To generate LMP2ASTOP mice, the targeting vector used to insert the HA-tagged LMP2A gene cassette into the ROSA26 locus was introduced into BALB/c ES cells. The mutant ES cells were microinjected into C57BL/6 mice, and heterozygous offspring were intercrossed into C57BL/6 mice for at least 15 generations. To generate LMP2ACD19 and LMP2AAID mice, LMP2ASTOP mice were crossed with CD19-Cre and Aicda-Cre mice, respectively (Fig. S1A). GFPCD19 and GFPAID mice that express only GFP were generated as described above. For generation of bone marrow chimeric mice, equal numbers of bone marrow cells from either LMP2AAID or GFPAID (CD45.2+) and Ly5.1 (CD45.1+) donor mice were transferred into irradiated Rag2−/− hosts. For immunization of mice, 100 μg of NP-CGG (Biosearch Technologies) precipitated in alum was injected i.p. All mice were maintained in a specific pathogen-free animal facility in accordance with the Osaka University guidelines for animal experimentation.
Antibodies.
The following antibodies and affinity reagents were used for flow cytometric analysis and immunofluorescence staining: anti-CD19 (Pacific Blue or APC-Cy7 conjugated), anti-B220 (APC, Pacific Blue, V500, or PerCP-Cy5.5 conjugated), anti-CD8 (APC-Cy7 conjugated), anti-IgM (APC, PerCP-Cy5.5, or APC-Cy7 conjugated), biotinylated anti-IgG1, anti-CD138 (APC conjugated), biotinylated anti-CXCR4, anti-CXCR5 [phycoerythrin (PE) conjugated], anti–CD86 (V450 conjugated), anti–CD38 (PE-Cy7 conjugated), biotinylated anti-CD35, anti-CD21/CD35 (PE conjugated), anti-CD43 (PE conjugated), streptavidin (PE conjugated), streptavidin (APC-Cy7 conjugated), and streptavidin (PE-Cy7 conjugated) (all obtained from BD Biosciences), anti-CD4 (APC-Cy7 conjugated), anti-CD11b (APC-Cy7 conjugated), anti–Gr-1 (APC-Cy7 conjugated), anti-CD3ε (APC-Cy7 conjugated), anti–IgD (APC-Cy7 or PerCP-Cy5.5 conjugated), and anti-CD45.1 (Pacific Blue-conjugated) (all obtained from BioLegend); anti-GL7 (Alexa Fluor 647 conjugated), anti-CD45.1 (APC conjugated), anti-CD45.2 (PE, or APC-Cy7 conjugated), anti-CD23 (PE-Cy7 conjugated), and biotinylated anti-AA4.1 (all obtained from eBioscience); goat anti-mouse IgG + IgM, streptavidin (Cy3 conjugated) (all obtained from Jackson ImmunoResearch); anti-IgD (PE conjugated) (SouthernBiotech), and streptavidin-(Alexa Fluor 488-conjugated) (Invitrogen). NP-PE was prepared by conjugating the NP–coupled imide-ester (Biosearch Technologies) with PE (Thermo Scientific). Biotinylated PNA was obtained from Vector Laboratories.
The antibodies for Western blot analysis were the following: anti-phosphotyrosine (4G10; Merck Millipore), anti-pSyk, anti-pIKKα/β (Cell Signaling Technology), anti-Syk (Santa Cruz Biotechnology), anti-HA (3F10; Roche Applied Science), anti-LMP2A (14B7; Abcam), and anti–α-tubulin (Sigma-Aldrich).
Cell Culture and Reagents.
Mature B cells or B220+ B cells from splenocytes were purified using the magnetic cell sorting-based B-cell isolation kit or B220 MicroBeads, according to the manufacturer’s protocol (Miltenyi Biotec). The cells were cultured in RPMI 1640 medium containing 10% (vol/vol) FBS, streptomycin/penicillin, 2-mercaptoethanol, and minimal essential medium (MEM) Nonessential Amino Acid Solution (all obtained from GIBCO).
ELISA.
Antibody titers against dsDNA, cardiolipin, or NP in sera were determined by ELISA. Blunt-ended plasmid DNA (pUC19) was captured to determine the titer of anti-dsDNA antibody. To analyze the anti-cardiolipin antibody, cardiolipin (Sigma-Aldrich) was used as described previously (53). To detect anti-NP antibody, NP16-BSA or NP2-BSA (Biosearch Technologies) was used for capture, and ELISA was performed as described previously (20). To measure the serum Ig titer, 10 µg/mL anti-mouse IgM, IgG1, IgG2a, IgG2b, IgG3, or IgA (SouthernBiotech) was used for capture as previously described (48).
Proliferation Assay.
For thymidine-incorporation assays, 1 × 10⁵ purified mature B cells from LMP2ACD19 or GFPCD19 mice were cultured in triplicate in a flat-bottomed 96-well plate with 10 µg/mL goat anti-IgM F(ab′)2 (SouthernBiotech), 10 µg/mL anti-CD40 antibody (BD Biosciences), 20 ng/mL B-cell activating factor (R&D Systems), or 20 ng/mL IL-4 (R&D Systems) for 48 h. Twelve hours before harvest, the cells were pulsed with 3H-thymidine (PerkinElmer). For dye-dilution proliferation assays, 1 × 10⁵ purified B220+ B cells from LMP2AAID or GFPAID mice were labeled using the CellTrace Violet Cell Proliferation Kit according to the manufacturer’s protocol (Invitrogen). Labeled cells were cultured for 4 d in 24-well plates with 10 µg/mL anti-CD40 antibody and 20 ng/mL IL-4 and then were analyzed by flow cytometry.
ELISPOT Assay.
The number of ASCs was analyzed by ELISPOT assay. Multiscreen Mixes Cellulose Ester Membranes plates (Millipore) were coated with 10 µg/mL anti-mouse IgM, IgG1 antibody (SouthernBiotech), or 50 µg/mL NP16-BSA in PBS. Splenocytes (104, 105, or 106 cells per well) in RPMI 1640 containing 10% FBS were incubated for 4 h at 37 °C. ASCs were detected using alkaline phosphatase-conjugated goat anti-mouse IgM or IgG1 antibody (SouthernBiotech).
Flow Cytometric Analysis and Cell Sorting.
Flow cytometric analysis was performed using a FACSCanto II and FACS DIVA software (BD Biosciences). For sequence analysis of Ig heavy-chain cDNA, splenocytes from LMP2AAID or GFPAID mice immunized with NP-CGG in alum for 18 d were stained with fluorescence-labeled anti-CD4, -CD8, -CD11b, -Gr-1, -CD3ε (lineage) together with fluorescence-labeled anti-IgM, -IgD, -CD19, -IgG1, and -NP-PE. Lineage-negative IgM−IgD−CD19+GFP+IgG1+NP-binding+ B cells were obtained by single-cell sorting using FACSAria II and the FACS DIVA software (BD Biosciences).
Microscopy.
Immunofluorescence images were obtained using a FV1000 confocal laser-scanning microscope (4× or 10×) and FV10-ASW software (Olympus). H&E-stained images were obtained using an Axioplan2 microscope (20×) (Zeiss), a DP25 microscope camera (Olympus), and DP2-BSW software (Olympus).
Sequence Analysis of IgH cDNA.
To extract total RNA from sorted cells, each cell was lysed in lysis buffer containing first-strand buffer (Toyobo), RNase inhibitor (Wako), 0.2 mM dNTP (Takara), 0.25% Nonidet P-40 (Wako), and oligo-dT primer (Toyobo). Reverse transcription was performed by adding reverse transcriptase (Toyobo), and synthesized cDNA was used as a template for the first PCR (primer pairs: 5′-GCTGTATCATGCTCTTCTTG-3′ for the VH186.2 leader sequence, 5′-GGATGACTCATCCCAGGGTCACCATGGAGT-3′ for the constant region of the IgG1 gene). The first PCR product was used as a template for nested PCR (primer pairs: 5′-GGTGTCCACTCCCAGGTCCA-3′, 5′-CCAGGGGCCAGTGGATAGAC-3′). The PCR products were subjected to direct DNA sequencing, and the sequences were compared with the VH186.2 germline sequence.
RT–qPCR.
To evaluate the mRNA expression of Irf4, Blimp1, Zbtb20, and Trim12a, total RNAs were isolated, and cDNAs were generated by reverse transcription using ReverTra Ace (Toyobo) and random primer (Takara). For qPCR, the primers used for PCR were as follows: for Gapdh, 5′-CTGGAGAAACCTGCCAAG-3′ and 5′-AGAGTGGGAGTTGCTGTTG-3′; for Irf4, 5′-CAAAGCCCTCAGTCGTTGTCC-3′ and 5′-TCTGTGCTCCAATCCCAGAGTG-3′; for Blimp1 (Prdm1), 5′-TCCAACCTGAAGGTCCAC-3′ and 5′-GTGGCTTCTCTCCTGTGTG-3′; for Zbtb20, 5′-GGCATCTGAGGAGAATGAGA-3′ and 5′-GTTGTGAAGGTTGATGCTGTG-3′ (37); and for Trim12a, 5′-CCTGTCTGTCTGAACCTGATGG-3′ and 5′- GGCTTGAACATTTTGAGCCTCT-3′ (54). THUNDERBIRD qPCR Mix (Toyobo) and StepOnePlus (Applied Biosystems) were used according to the manufacturers’ protocols.
ChIP Assays and Sequencing.
Mouse splenic B220+ B cells were cross-linked in 1% (vol/vol) formaldehyde, lysed in lysis buffer [50 mM Tris·HCl (pH 8.1), 10 mM EDTA, 1% SDS, and protease inhibitors (Roche)] and sonicated for twenty 20-s cycles on ice. Lysate was diluted 10-fold with dilution buffer [16.7 mM Tris·HCl (pH 8.1), 1.2 mM EDTA, 167 mM NaCl, 1.1% Triton X-100, 0.01% SDS, and protease inhibitors], and ChIP-grade rabbit polyclonal antibodies (Abcam) against H3k4me1, H3K4me3, and H3K27ac were added to immune precipitate H3K4me1–DNA, H3K4me3–DNA and H3K27ac–DNA complexes, respectively. Protein–DNA complexes were captured with the addition of protein A agarose/salmon sperm DNA and then were washed once with low-salt wash buffer [20 mM Tris·HCl (pH 8.1), 2 mM EDTA, 150 mM NaCl, 1% Triton X-100, 1% SDS] for 15 min at 4 °C with rotation, once with high-salt wash buffer [20 mM Tris·HCl (pH 8.1), 2 mM EDTA, 500 mM NaCl, 1% Triton X-100, 1% SDS], once with LiCl wash buffer [10 mM Tris·HCl (pH 8.1, 1 mM EDTA, 0.25 M LiCl, 1% Nonidet P-40, 1% deoxycholate acid], and twice with Tris-EDTA buffer. Protein–DNA complexes were eluted from the protein A beads by rotating at room temperature two times for 15 min each in 250 μL of elution buffer (100 mM NaHCO3, 1% SDS) to a final volume of 500 μL. DNA–protein cross-linking was reversed by the addition of 20 μL of 5 M NaCl and incubation at 65 °C for 4 h. DNA was purified using a PCR MinElute column (Qiagen). ChIP-seq DNA libraries were prepared and sequenced using HiSeq2500 sequencer (Illumina).
ChIP-Seq Data Alignment, Identification of Enriched Regions, Calculation of ChIP-Seq Signal Density, and Pathway Enrichment Analysis.
All ChIP-Seq reads were mapped to the mouse mm9 reference genome using Bowtie (version 0.12.9) (55). Alignments were done with parameters -S -t -p 1 -k 1 -m 1. MACS (1.4.2) (56) was used to identify ChIP-seq transcription factor binding sites. Default parameters were used with the exception of ‘‘to-large,’’ which was set because of the low sequencing depth of older ChIP-seq datasets. To calculate the density of ChIP-seq signals, binding sites of LMP2A and GFP groups were intersected, and the overlapping binding sites of both groups were chosen. ChIP-seq signals (ChIP-seq Reads) of each group were plotted onto the binding sites, and for each binding site the average ChIP-seq signal (per base pair) was calculated by dividing the binding region's total mapped reads by its width. The enriched pathways of superenhancer-associated genes were identified using the ‘‘Identify Pathways’’ function of the IntPath database (39).
Microarray Analysis.
Total RNA was extracted with the RNeasy Mini Kit (Qiagen) according to the manufacturer's protocol. One hundred nanograms of total RNA obtained from splenic B220+ B cells of LMP2ACD19 or GFPCD19 mice was reverse transcribed and labeled using a Low Input Quick-Amp Labeling Kit (Agilent). Eight hundred twenty-five nanograms of complementary RNAs labeled with either Cy-3 or Cy-5 (Perkin-Elmer) were hybridized onto Agilent Mouse GE 4 × 44 K v2 Microarray (G4846A) as dye-swapped experiments. After washing in GE washing buffer, slides were scanned with an Agilent Microarray Scanner G2505C. Feature extraction software (version 10.7.3.1) using defaults for all parameters was used to convert images into gene-expression data. Subio Platform and Subio Basic Plug-in (v1.17; Subio, Inc.) were used for quality control. The signature genes (P < 0.05, one-sample t-test) with mean fold changes greater than +2 (more than twice) or less than −2 (less than half) at LMP2ACD19 B cells compared with GFPCD19 B cells were subjected to further evaluation. The data have been deposited in GEO as GSE70521. To define the similarity of differentially expressed genes, we used the Systems Biology analysis tool NextBio (57).
Statistical Analysis.
Statistical analyses were performed using the unpaired, two-tailed Student’s t test. A P value < 0.05 was considered statistically significant.
Acknowledgments
We thank M. Okabe for providing GFP transgenic mice; K. Nakamura and Y. Kabumoto for help with the flow cytometric analyses; members of the H.K. laboratory, S. Tada, O. Simma, and H. Jinzai for critical discussions; M. Ishiguro, K. Shiozaki, T. Sugimoto, R. Hirai, C. Enya, and Y. Namura for technical assistance; K. Kubota for secretarial support; Micah Luftig and Alan Rickinson for critical reading of the manuscript; and Bo Zhao for technical assistance with ChIP-seq and helpful discussions. This work was supported in part by Grants-in-Aid for Scientific Research from the Japan Society for the Promotion of Science (to T.Y., H.K., and S.S.); by a Grant-in-Aid for the Global Centers of Excellence Program from the Ministry of Education, Culture, Sports, Science and Technology of Japan; by National Cancer Institute Grants R01 CA085180 (to E.K.) and K08 CA140780 (to B.E.G.); and by a Burroughs Wellcome Medical Scientist Career Award (to B.E.G.).
Footnotes
The authors declare no conflict of interest.
Data deposition: The sequences reported in this paper have been deposited in the Gene Expression Omnibus database (accession nos. GSE70521 and GSE71408).
This article contains supporting information online at www.pnas.org/lookup/suppl/doi:10.1073/pnas.1514484112/-/DCSupplemental.
References
- 1.Young LS, Rickinson AB. Epstein-Barr virus: 40 years on. Nat Rev Cancer. 2004;4(10):757–768. doi: 10.1038/nrc1452. [DOI] [PubMed] [Google Scholar]
- 2.Rickinson AB, Kieff E. 2007. Epstein-Barr virus. Fields Virology (Lippincott Williams & Wilkins, Philadelphia). 5th Ed, Vol 2, pp 2655–2700.
- 3.Wang F, et al. Epstein-Barr virus latent membrane protein (LMP1) and nuclear proteins 2 and 3C are effectors of phenotypic changes in B lymphocytes: EBNA-2 and LMP1 cooperatively induce CD23. J Virol. 1990;64(5):2309–2318. doi: 10.1128/jvi.64.5.2309-2318.1990. [DOI] [PMC free article] [PubMed] [Google Scholar]
- 4.Yates JL, Warren N, Sugden B. Stable replication of plasmids derived from Epstein-Barr virus in various mammalian cells. Nature. 1985;313(6005):812–815. doi: 10.1038/313812a0. [DOI] [PubMed] [Google Scholar]
- 5.Fruehling S, Longnecker R. The immunoreceptor tyrosine-based activation motif of Epstein-Barr virus LMP2A is essential for blocking BCR-mediated signal transduction. Virology. 1997;235(2):241–251. doi: 10.1006/viro.1997.8690. [DOI] [PubMed] [Google Scholar]
- 6.Miller CL, Longnecker R, Kieff E. Epstein-Barr virus latent membrane protein 2A blocks calcium mobilization in B lymphocytes. J Virol. 1993;67(6):3087–3094. doi: 10.1128/jvi.67.6.3087-3094.1993. [DOI] [PMC free article] [PubMed] [Google Scholar]
- 7.Miller CL, Lee JH, Kieff E, Longnecker R. An integral membrane protein (LMP2) blocks reactivation of Epstein-Barr virus from latency following surface immunoglobulin crosslinking. Proc Natl Acad Sci USA. 1994;91(2):772–776. doi: 10.1073/pnas.91.2.772. [DOI] [PMC free article] [PubMed] [Google Scholar]
- 8.Miller CL, et al. Integral membrane protein 2 of Epstein-Barr virus regulates reactivation from latency through dominant negative effects on protein-tyrosine kinases. Immunity. 1995;2(2):155–166. doi: 10.1016/s1074-7613(95)80040-9. [DOI] [PubMed] [Google Scholar]
- 9.Caldwell RG, Wilson JB, Anderson SJ, Longnecker R. Epstein-Barr virus LMP2A drives B cell development and survival in the absence of normal B cell receptor signals. Immunity. 1998;9(3):405–411. doi: 10.1016/s1074-7613(00)80623-8. [DOI] [PubMed] [Google Scholar]
- 10.Merchant M, Caldwell RG, Longnecker R. The LMP2A ITAM is essential for providing B cells with development and survival signals in vivo. J Virol. 2000;74(19):9115–9124. doi: 10.1128/jvi.74.19.9115-9124.2000. [DOI] [PMC free article] [PubMed] [Google Scholar]
- 11.Casola S, et al. B cell receptor signal strength determines B cell fate. Nat Immunol. 2004;5(3):317–327. doi: 10.1038/ni1036. [DOI] [PubMed] [Google Scholar]
- 12.Monroe JG. ITAM-mediated tonic signalling through pre-BCR and BCR complexes. Nat Rev Immunol. 2006;6(4):283–294. doi: 10.1038/nri1808. [DOI] [PubMed] [Google Scholar]
- 13.Mancao C, Hammerschmidt W. Epstein-Barr virus latent membrane protein 2A is a B-cell receptor mimic and essential for B-cell survival. Blood. 2007;110(10):3715–3721. doi: 10.1182/blood-2007-05-090142. [DOI] [PMC free article] [PubMed] [Google Scholar]
- 14.Caldwell RG, Brown RC, Longnecker R. Epstein-Barr virus LMP2A-induced B-cell survival in two unique classes of EmuLMP2A transgenic mice. J Virol. 2000;74(3):1101–1113. doi: 10.1128/jvi.74.3.1101-1113.2000. [DOI] [PMC free article] [PubMed] [Google Scholar]
- 15.Portis T, Longnecker R. Epstein-Barr virus (EBV) LMP2A alters normal transcriptional regulation following B-cell receptor activation. Virology. 2004;318(2):524–533. doi: 10.1016/j.virol.2003.09.017. [DOI] [PubMed] [Google Scholar]
- 16.Ikeda A, Merchant M, Lev L, Longnecker R, Ikeda M. Latent membrane protein 2A, a viral B cell receptor homologue, induces CD5+ B-1 cell development. J Immunol. 2004;172(9):5329–5337. doi: 10.4049/jimmunol.172.9.5329. [DOI] [PubMed] [Google Scholar]
- 17.Babcock GJ, Decker LL, Volk M, Thorley-Lawson DA. EBV persistence in memory B cells in vivo. Immunity. 1998;9(3):395–404. doi: 10.1016/s1074-7613(00)80622-6. [DOI] [PubMed] [Google Scholar]
- 18.Babcock GJ, Hochberg D, Thorley-Lawson AD. The expression pattern of Epstein-Barr virus latent genes in vivo is dependent upon the differentiation stage of the infected B cell. Immunity. 2000;13(4):497–506. doi: 10.1016/s1074-7613(00)00049-2. [DOI] [PubMed] [Google Scholar]
- 19.Mosialos G, et al. The Epstein-Barr virus transforming protein LMP1 engages signaling proteins for the tumor necrosis factor receptor family. Cell. 1995;80(3):389–399. doi: 10.1016/0092-8674(95)90489-1. [DOI] [PubMed] [Google Scholar]
- 20.Uchida J, et al. Mimicry of CD40 signals by Epstein-Barr virus LMP1 in B lymphocyte responses. Science. 1999;286(5438):300–303. doi: 10.1126/science.286.5438.300. [DOI] [PubMed] [Google Scholar]
- 21.Zhang B, et al. Immune surveillance and therapy of lymphomas driven by Epstein-Barr virus protein LMP1 in a mouse model. Cell. 2012;148(4):739–751. doi: 10.1016/j.cell.2011.12.031. [DOI] [PMC free article] [PubMed] [Google Scholar]
- 22.Vrazo AC, Chauchard M, Raab-Traub N, Longnecker R. Epstein-Barr virus LMP2A reduces hyperactivation induced by LMP1 to restore normal B cell phenotype in transgenic mice. PLoS Pathog. 2012;8(4):e1002662. doi: 10.1371/journal.ppat.1002662. [DOI] [PMC free article] [PubMed] [Google Scholar]
- 23.Kwon K, et al. Instructive role of the transcription factor E2A in early B lymphopoiesis and germinal center B cell development. Immunity. 2008;28(6):751–762. doi: 10.1016/j.immuni.2008.04.014. [DOI] [PubMed] [Google Scholar]
- 24.Muramatsu M, et al. Specific expression of activation-induced cytidine deaminase (AID), a novel member of the RNA-editing deaminase family in germinal center B cells. J Biol Chem. 1999;274(26):18470–18476. doi: 10.1074/jbc.274.26.18470. [DOI] [PubMed] [Google Scholar]
- 25.Qin H, et al. Activation-induced cytidine deaminase expression in CD4+ T cells is associated with a unique IL-10-producing subset that increases with age. PLoS One. 2011;6(12):e29141. doi: 10.1371/journal.pone.0029141. [DOI] [PMC free article] [PubMed] [Google Scholar]
- 26.Victora GD, Nussenzweig MC. Germinal centers. Annu Rev Immunol. 2012;30:429–457. doi: 10.1146/annurev-immunol-020711-075032. [DOI] [PubMed] [Google Scholar]
- 27.Jacob J, Przylepa J, Miller C, Kelsoe G. In situ studies of the primary immune response to (4-hydroxy-3-nitrophenyl)acetyl. III. The kinetics of V region mutation and selection in germinal center B cells. J Exp Med. 1993;178(4):1293–1307. doi: 10.1084/jem.178.4.1293. [DOI] [PMC free article] [PubMed] [Google Scholar]
- 28.McHeyzer-Williams MG, McLean MJ, Lalor PA, Nossal GJV. Antigen-driven B cell differentiation in vivo. J Exp Med. 1993;178(1):295–307. doi: 10.1084/jem.178.1.295. [DOI] [PMC free article] [PubMed] [Google Scholar]
- 29.Jacob J, Kelsoe G, Rajewsky K, Weiss U. Intraclonal generation of antibody mutants in germinal centres. Nature. 1991;354(6352):389–392. doi: 10.1038/354389a0. [DOI] [PubMed] [Google Scholar]
- 30.McHeyzer-Williams MG, Nossal GJV, Lalor PA. Molecular characterization of single memory B cells. Nature. 1991;350(6318):502–505. doi: 10.1038/350502a0. [DOI] [PubMed] [Google Scholar]
- 31.Vinuesa CG, Sanz I, Cook MC. Dysregulation of germinal centres in autoimmune disease. Nat Rev Immunol. 2009;9(12):845–857. doi: 10.1038/nri2637. [DOI] [PubMed] [Google Scholar]
- 32.Evans AS, Rothfield NF, Niederman JC. Raised antibody titres to E.B. virus in systemic lupus erythematosus. Lancet. 1971;1(7691):167–168. doi: 10.1016/s0140-6736(71)91937-4. [DOI] [PubMed] [Google Scholar]
- 33.Kang I, et al. Defective control of latent Epstein-Barr virus infection in systemic lupus erythematosus. J Immunol. 2004;172(2):1287–1294. doi: 10.4049/jimmunol.172.2.1287. [DOI] [PubMed] [Google Scholar]
- 34.Gross AJ, Hochberg D, Rand WM, Thorley-Lawson DA. EBV and systemic lupus erythematosus: A new perspective. J Immunol. 2005;174(11):6599–6607. doi: 10.4049/jimmunol.174.11.6599. [DOI] [PubMed] [Google Scholar]
- 35.Yu S-F, et al. Detecting Epstein-Barr virus DNA from peripheral blood mononuclear cells in adult patients with systemic lupus erythematosus in Taiwan. Med Microbiol Immunol (Berl) 2005;194(3):115–120. doi: 10.1007/s00430-004-0230-5. [DOI] [PubMed] [Google Scholar]
- 36.Larsen M, et al. Exhausted cytotoxic control of Epstein-Barr virus in human lupus. PLoS Pathog. 2011;7(10):e1002328. doi: 10.1371/journal.ppat.1002328. [DOI] [PMC free article] [PubMed] [Google Scholar]
- 37.Chevrier S, et al. The BTB-ZF transcription factor Zbtb20 is driven by Irf4 to promote plasma cell differentiation and longevity. J Exp Med. 2014;211(5):827–840. doi: 10.1084/jem.20131831. [DOI] [PMC free article] [PubMed] [Google Scholar]
- 38.Kometani K, Kurosaki T. Differentiation and maintenance of long-lived plasma cells. Curr Opin Immunol. 2015;33:64–69. doi: 10.1016/j.coi.2015.01.017. [DOI] [PubMed] [Google Scholar]
- 39.Zhou H, et al. IntPath--an integrated pathway gene relationship database for model organisms and important pathogens. BMC Syst Biol. 2012;6(Suppl 2):1–17. doi: 10.1186/1752-0509-6-S2-S2. [DOI] [PMC free article] [PubMed] [Google Scholar]
- 40.Swanson-Mungerson M, Bultema R, Longnecker R. Epstein-Barr virus LMP2A enhances B-cell responses in vivo and in vitro. J Virol. 2006;80(14):6764–6770. doi: 10.1128/JVI.00433-06. [DOI] [PMC free article] [PubMed] [Google Scholar]
- 41.Lechouane F, et al. B-cell receptor signal strength influences terminal differentiation. Eur J Immunol. 2013;43(3):619–628. doi: 10.1002/eji.201242912. [DOI] [PubMed] [Google Scholar]
- 42.Paus D, et al. Antigen recognition strength regulates the choice between extrafollicular plasma cell and germinal center B cell differentiation. J Exp Med. 2006;203(4):1081–1091. doi: 10.1084/jem.20060087. [DOI] [PMC free article] [PubMed] [Google Scholar]
- 43.Robinson JE, Smith D, Niederman J. Plasmacytic differentiation of circulating Epstein-Barr virus-infected B lymphocytes during acute infectious mononucleosis. J Exp Med. 1981;153(2):235–244. doi: 10.1084/jem.153.2.235. [DOI] [PMC free article] [PubMed] [Google Scholar]
- 44.Niedobitek G, et al. Epstein-Barr virus (EBV) infection in infectious mononucleosis: Virus latency, replication and phenotype of EBV-infected cells. J Pathol. 1997;182(2):151–159. doi: 10.1002/(SICI)1096-9896(199706)182:2<151::AID-PATH824>3.0.CO;2-3. [DOI] [PubMed] [Google Scholar]
- 45.Wang Y, Bhattacharya D. Adjuvant-specific regulation of long-term antibody responses by ZBTB20. J Exp Med. 2014;211(5):841–856. doi: 10.1084/jem.20131821. [DOI] [PMC free article] [PubMed] [Google Scholar]
- 46.Liston A, et al. Impairment of organ-specific T cell negative selection by diabetes susceptibility genes: Genomic analysis by mRNA profiling. Genome Biol. 2007;8(1):R12. doi: 10.1186/gb-2007-8-1-r12. [DOI] [PMC free article] [PubMed] [Google Scholar]
- 47.Shinohara H, et al. Positive feedback within a kinase signaling complex functions as a switch mechanism for NF-κB activation. Science. 2014;344(6185):760–764. doi: 10.1126/science.1250020. [DOI] [PubMed] [Google Scholar]
- 48.Yasui T, et al. Protein kinase N1, a cell inhibitor of Akt kinase, has a central role in quality control of germinal center formation. Proc Natl Acad Sci USA. 2012;109(51):21022–21027. doi: 10.1073/pnas.1218925110. [DOI] [PMC free article] [PubMed] [Google Scholar]
- 49.Jenson HB. Acute complications of Epstein-Barr virus infectious mononucleosis. Curr Opin Pediatr. 2000;12(3):263–268. doi: 10.1097/00008480-200006000-00016. [DOI] [PubMed] [Google Scholar]
- 50.Misra R, Venables PJW, Watkins RPF, Maini RN. Autoimmunity to cardiolipin in infectious mononucleosis. Lancet. 1987;2(8559):629. doi: 10.1016/s0140-6736(87)93019-4. [DOI] [PubMed] [Google Scholar]
- 51.Tracy SI, et al. Persistence of Epstein-Barr virus in self-reactive memory B cells. J Virol. 2012;86(22):12330–12340. doi: 10.1128/JVI.01699-12. [DOI] [PMC free article] [PubMed] [Google Scholar]
- 52.Zhao B, et al. The NF-κB genomic landscape in lymphoblastoid B cells. Cell Reports. 2014;8(5):1595–1606. doi: 10.1016/j.celrep.2014.07.037. [DOI] [PMC free article] [PubMed] [Google Scholar]
- 53.Pierangeli SS, Harris EN. A protocol for determination of anticardiolipin antibodies by ELISA. Nat Protoc. 2008;3(5):840–848. doi: 10.1038/nprot.2008.48. [DOI] [PubMed] [Google Scholar]
- 54.Wang X, Seed B. A PCR primer bank for quantitative gene expression analysis. Nucleic Acids Res. 2003;31(24):e154. doi: 10.1093/nar/gng154. [DOI] [PMC free article] [PubMed] [Google Scholar]
- 55.Langmead B, Trapnell C, Pop M, Salzberg SL. Ultrafast and memory-efficient alignment of short DNA sequences to the human genome. Genome Biol. 2009;10(3):R25. doi: 10.1186/gb-2009-10-3-r25. [DOI] [PMC free article] [PubMed] [Google Scholar]
- 56.Zhang Y, et al. Model-based analysis of ChIP-Seq (MACS) Genome Biol. 2008;9(9):R137. doi: 10.1186/gb-2008-9-9-r137. [DOI] [PMC free article] [PubMed] [Google Scholar]
- 57.Kupershmidt I, et al. Ontology-based meta-analysis of global collections of high-throughput public data. PLoS One. 2010;5(9):e13066. doi: 10.1371/journal.pone.0013066. [DOI] [PMC free article] [PubMed] [Google Scholar]


